4767
Texture analysis of native T1 mapping in dilated cardiomyopathy1MRI, The first affiliated hospital of Zhengzhou University, Zhengzhou, People's Republic of China, 2MR, Siemens Healthcare Ltd, Shanghai, People's Republic of China
Synopsis
MR native T1 mapping technique was found have the ability of detecting diffuse myocardial fibrosis which was found in histological examination of dilated cardiomypathy (DCM). Texture analysis of T1 mapping had been proved to be able to provide more information besides T1 value. We found several histogram parameters (statistical class of texture analysis) were significantly higher in DCM than that of healthy volunteers. The areas under the receiver operating characteristic curve of histogram parameters were calculated. The results indicate that texture analysis of T1 mapping may be helpful for the diagnosis of DCM.
Purpose
Diffuse myocardial fibrosis is frequently observed in histology of dilated cardiomypathy (DCM)[1].T1 mapping technique has the potential to measure fibrosis quantitatively and therefore may provide novel cardiac magnetic resonance(CMR) insights into myocardial tissue characterization[2]. However, only T1 relaxation time is obtained using T1 mapping technique. Texture analysis(TA) describes a variety of image analysis techniques that quantify the variation in surface intensity or patterns, including many features which are imperceptible to the human visual system[3]. The application of texture analysis in medical image analysis are not limited[4]. The texture feature of T1 mapping was performed in dilated cardiomypathy and healthy volunteers to explore whether texture analysis of T1 mapping will be helpful for the diagnosis of dilated cardiomyopathy.
Methods
Forty seven subjects were analyzed including thirty-three DCM patients (exclude other cardiovascular diseases, including but not limited to hypertension, CHD and valve disease) retrospectively and fourteen healthy volunteers (no cardiovascular disease risk factors with normal ECG and cardiac ultrasound) prospectively. The CMR scanning, including cine and native T1 mapping were performed using a clinical 3.0T scanner (Magnetom Skyra, Siemens, Erlangen, Germany) and a 16-channel body coil. Cine images of 3 long-axis views (4-chamber, 2-chamber, and 3-chamber views) and transverse axial views (eight to eleven slices, depending on the size of heart) were acquired. A modified Look-Locker Inversion Recovery (MOLLI) sequence was used to acquire T1 maps in 3 short-axis slices (base, middle and apex). Eleven histogram parameters (statistical class of TA), including mean, maximum, minimum, standard deviation (SD), kurtosis, skewness and five percentiles (10, 25, 50, 75 and 90), were calculated using Matlab (V.R2011b, MathWorks, Natick, MA). The discrepancy of TA parameters between DCM and volunteers was analyzed by SPSS (V22, SPSS, Chicago). Receiver operating characteristic (ROC) curve of those histogram parameters were plotted and the area under the curve (AUC) of the ROC were calculated.Results
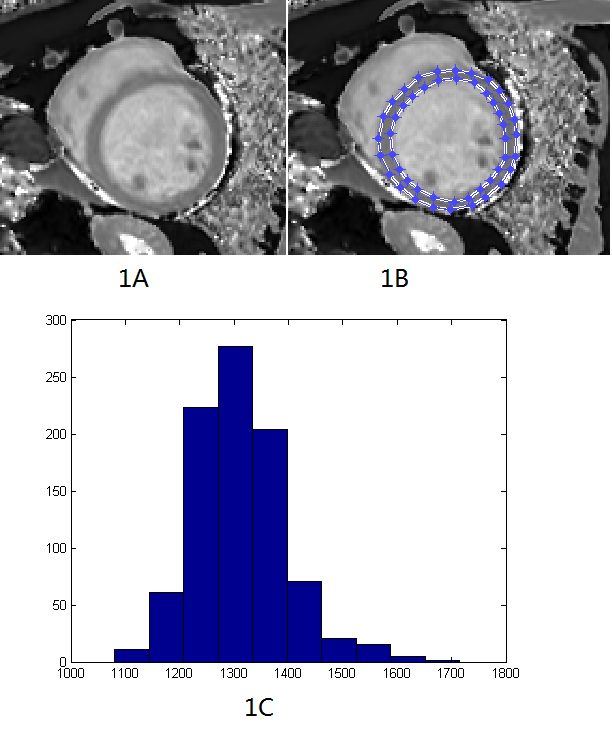
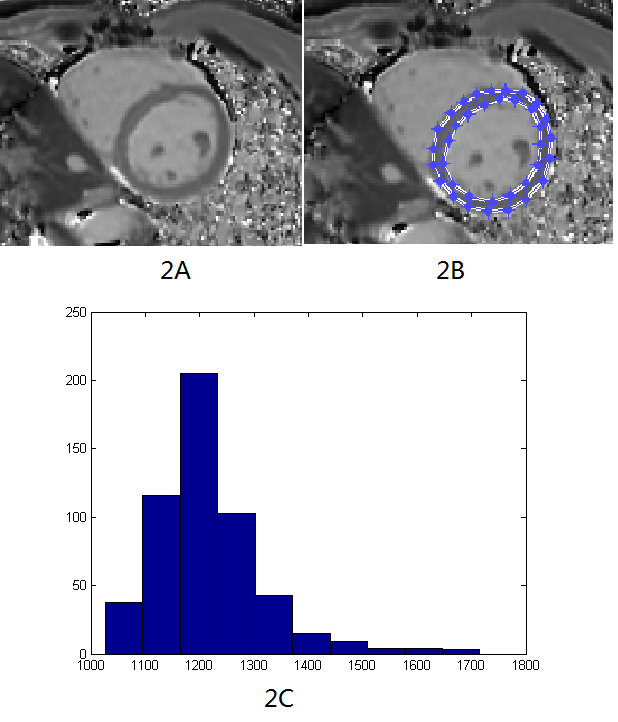
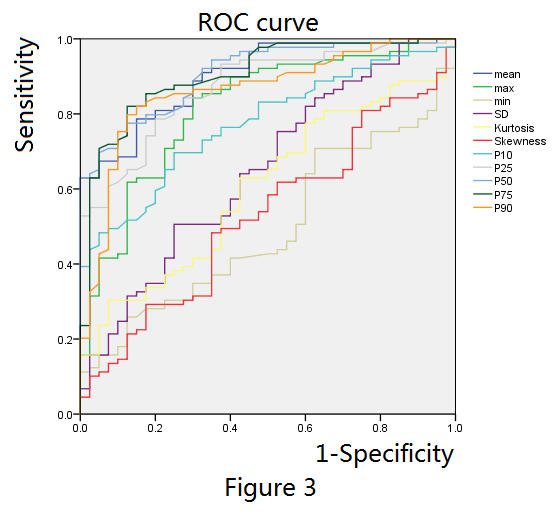
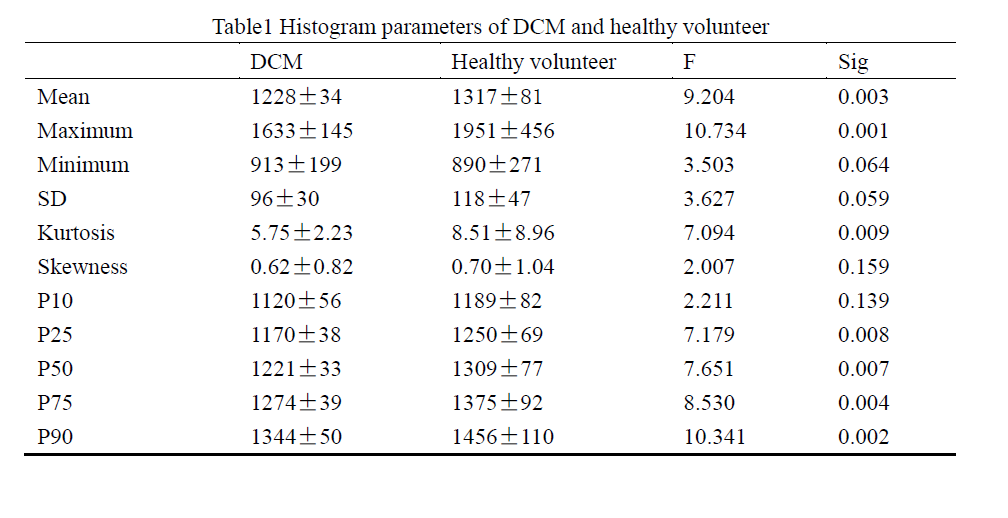
Region of interest and its histogram for DCM and volunteers are shown on figure1 and figure2 separately. Table1 is the statistical results of the value of histogram parameters. Seven histogram parameters, including mean, maximum, kurtosis, 25 percentile, 50 percentile, 75 percentile and 90 percentile, were significant higher in DCM patients than that of volunteers. Other four parameters, including minimum, SD, 10 percentile and skewness showed no significant difference. ROC curve of those histogram parameters are shown on figure3. In addition, AUC for mean, maximum, minimum, SD, kurtosis, skewness and ten to ninety percentiles are 0.901, 0.817, 0.495, 0.649, 0.604, 0.527, 0.773, 0.870, 0.908, 0.903 and 0.862 respectively.Discussion
Histology examination shows that diffuse myocardial fibrosis is frequently observed in patients with DCM. Diffuse myocardial fibrosis leads to the increase of T1 relaxation time before injection of contrast medium [5]. We found that T1 relaxation time is obviously higher in DCM group than that of healthy volunteers. Mean, maximum and 25, 50, 75, 90 percentile are significantly higher in DCM than that of volunteers. Nevertheless, there was also normal myocardial which determine the minimum value of T1 relaxation time in DCM patients. Therefore there were no difference in minimum and 10 percentile between DCM and healthy volunteers. Kurtosis indicates the peak and flatness of the distribution of values and high kurtosis means acute and high peak. As the T1 relaxation time increase in DCM group, the peak of T1 distribution got higher, so kurtosis is companied by an increase. Skewness described the asymmetry of the distribution of values. Even the T1 relaxation time increased in DCM group, the distribution was still uniform. So the skewness showed no significantly difference. SD got larger in DCM but not significant. AUC for mean, maximum and five percentiles are higher than 0.7 which means that those parameters have potential to distinguish DCM from healthy. The diagnosis value of SD, kurtosis and skewness are lower. Minimum which reflect the T1 relaxation time of normal myocardium has no diagnosis value at all.Conclusion
Texture analysis of native T1 mapping provides a new way of image parameters extraction and may be helpful for the diagnosis of dilated cardiomyopathy. Further studies are needed to effectively translate these findings into preclinical use.Acknowledgements
No acknowledgement found.References
[1]Lehrke S, Lossnitzer D, Schob M, et al. Use of cardiovascular magnetic resonance for risk stratification in chronic heart failure: prognostic value of late gadolinium enhancement in patients with non-ischaemic dilated cardiomyopathy. Heart 2010;97(9):727–732.
[2]Fabian aus dem Siepen, Sebastian J. Buss, Daniel Messroghli, et al. T1 mapping in dilated cardiomyopathy with cardiac magnetic resonance: quantification of diffuse myocardial fibrosis and comparison with endomyocardial biopsy[J].European Heart Journal-Cardiovascular Imaging,2014;16(2):210-216
[3]Kassner A. and Thornhill R.E. Texture analysis: A review of neurologic MR imaging applications [J]. American Journal of Neuroradiology, 2010; 31(5):809-816.
[4]Chaddad, A. and Tanougast. C. Extracted Magnetic Resonance Texture Features Discriminate between Phenotypes and Are Associated with Overall Survival in Glioblastoma Multiforme Patients[J]. Med Biol Eng Comput, 2016;54(11): 1707-1718.
[5]Puntmann VO, Voigt T, Chen Z, et al. Native T1 Mapping in Differentiation of Normal Myocardium From Diffuse Disease in Hypertrophic and Dilated Cardiomyopathy[J]. Jacc Cardiovascular Imaging 2013; 6(4):475-484.
Figures