4766
An MRI based High-Resolution Geometrical Framework to Quantify Left Ventricular Remodeling in Murine Model of Myocardial Infarction1Johns Hopkins University, Baltimore, MD, United States, 2Johns Hopkins Medical Institutions, Baltimore, MD, United States
Synopsis
Computational models of left ventricular (LV) geometry and function that characterize regional cardiac response to injury can provide valuable diagnostic and predictive information. We have developed a mathematical tool to non-rigidly match a high-resolution surface mesh of the LV geometry to a set of LV epi and endocardial contours that are extracted from cardiac MR. We have applied our algorithm on murine model of myocardial infarction to quantify cardiac remodeling process. This approach enables us to perform statistical analysis of LV 3D geometry and function using only sparse sets of 2D plane contours, therefore facilitating cross-subject examination of shape variation.
Purpose
To construct a 4D high-resolution geometric model describing quantitative changes in left ventricle (LV) shape and contractile function following myocardial infarction (MI) in murine model using a computational framework applied on sparse cardiac MRI cross-sections.Methods
The procedure were reviewed and approved by our Institutional Animal Care and Use Committee. To perform quantitative analysis of post-MI ventricular geometry and function, we acquired cardiac MRI images of 5 wild type sham and 5 infarcted adult male mice (using permanent ligation of anterior descending artery) at two different time points: days 1 and 28 post-MI/sham surgery using an 11.7/T Bruker CSI MRI/MRS scanner. The MRI protocol included multi-slice FLASH cine MRI (15 frames, echo time = 1.8 ms, repetition time = 7 ms, and slice thickness = 1 mm, flip angle = 30°) at 6-8 LV short axis slices. Computational method used here is called large deformation diffeomorphic metric (LDDMM) surface-to-curve matching algorithm1 that is based on our recent work in humans allowing matching a high resolution triangulated surface mesh to a set of LV short axis contours (epicardial and endocardial) . First, we constructed an average surface geometry from set of LV contours extracted from all animals. By taking the gradients of deformation field generated by LDDMM mapping, at the each node of surface mesh, we computed geometric strain tensors at the ED cardiac phase at days 1 and 28 post-MI/sham surgery. Three Strain tensors define: 1) regional wall thinning (along ventricular surface radial direction), 2) regional myocardial elongation, and 3) regional circumferential expansion of infarcted LV. In addition to regional shape analysis at one particular cardiac phase, we examined motion related deformation of ventricular geometry during contraction (systolic) and relaxation (diastolic) phases, separately. Analysis was conducted by estimating regional thickening/thinning along the LV surface radial direction, shortening/elongation along the LV longitudinal direction, and shrinkage/expansion along the circumferential direction during systolic/diastolic phase. This was achieved by mapping the high-resolution triangulated mesh to the cardiac contours extracted from the entire cardiac cycle (15 phases). All deformations were calculated from a baseline point (ED). The statistical analysis was conducted using non-parametric regression linear model for systolic and diastolic phases separately.Results
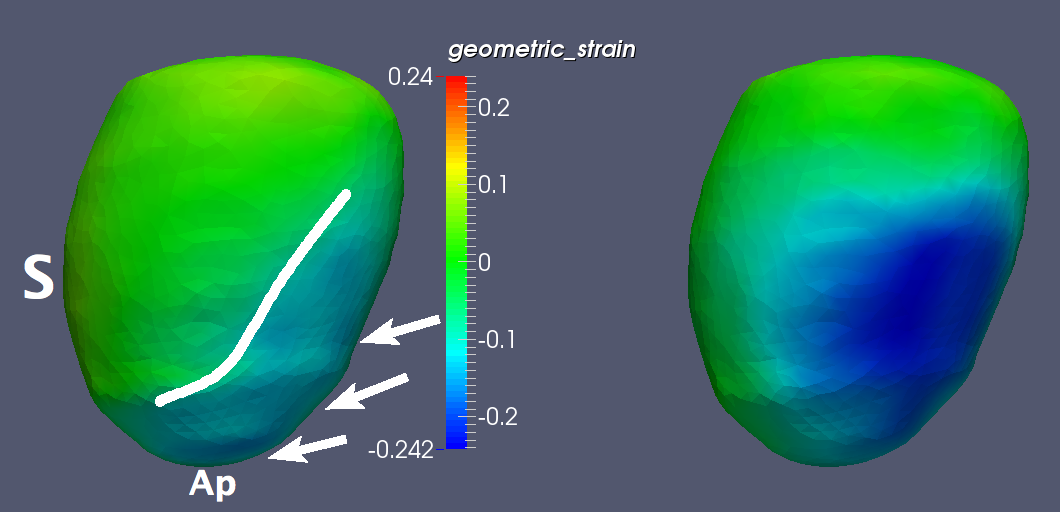
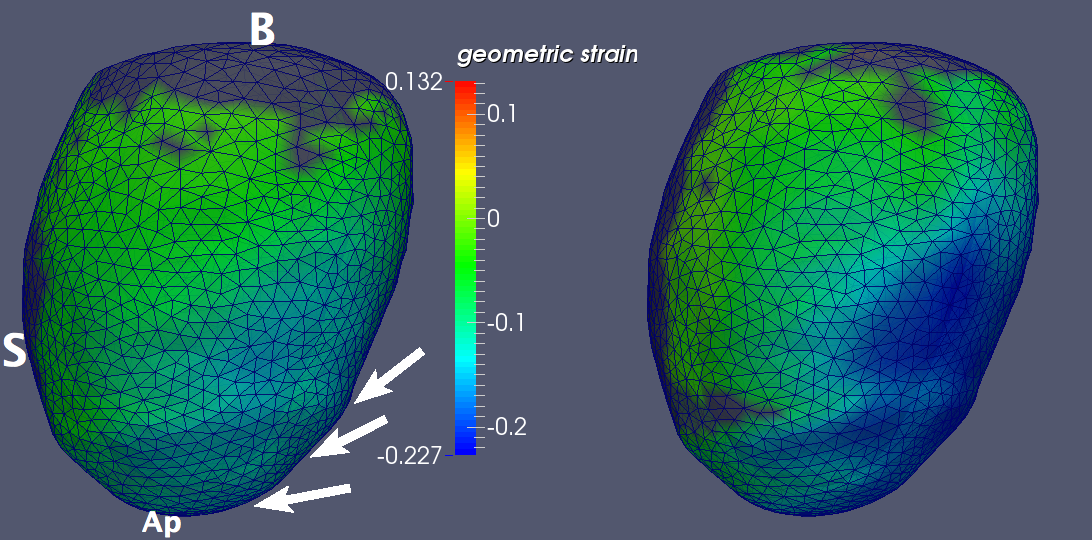
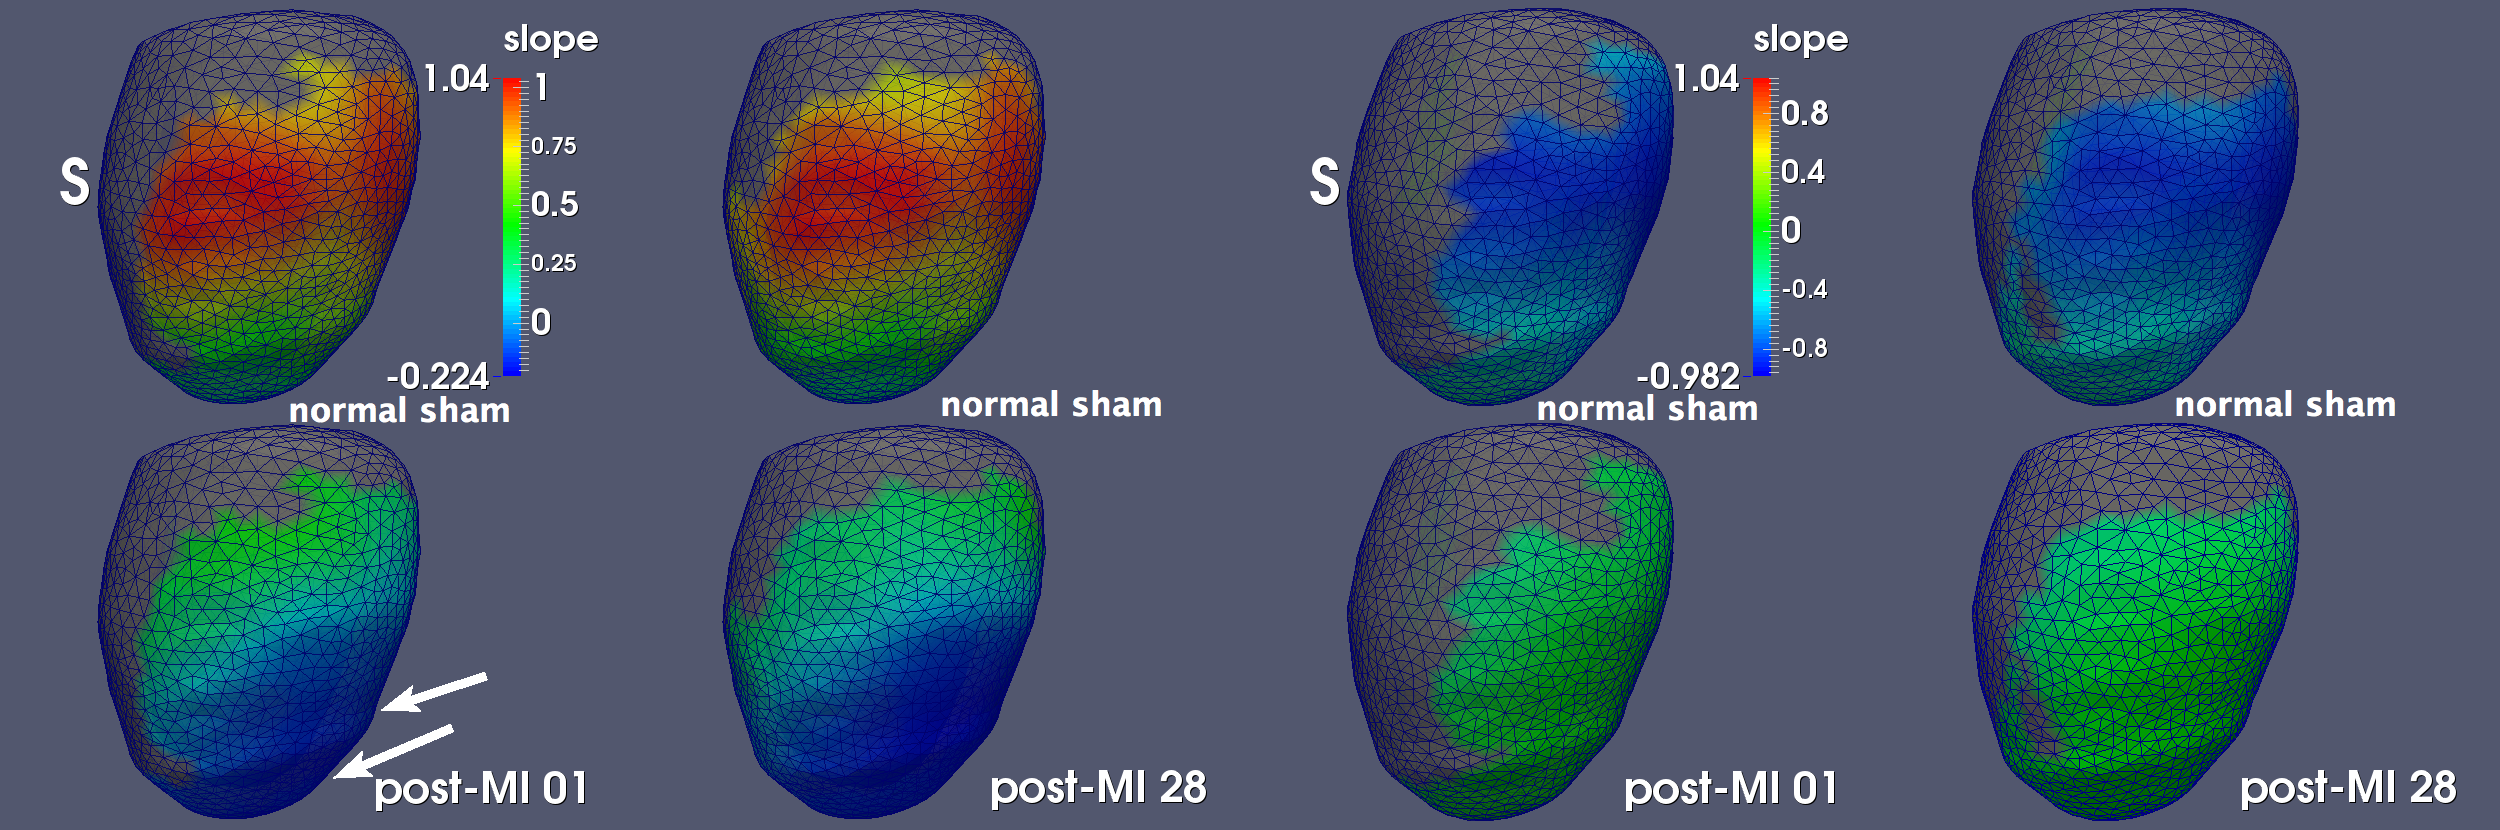
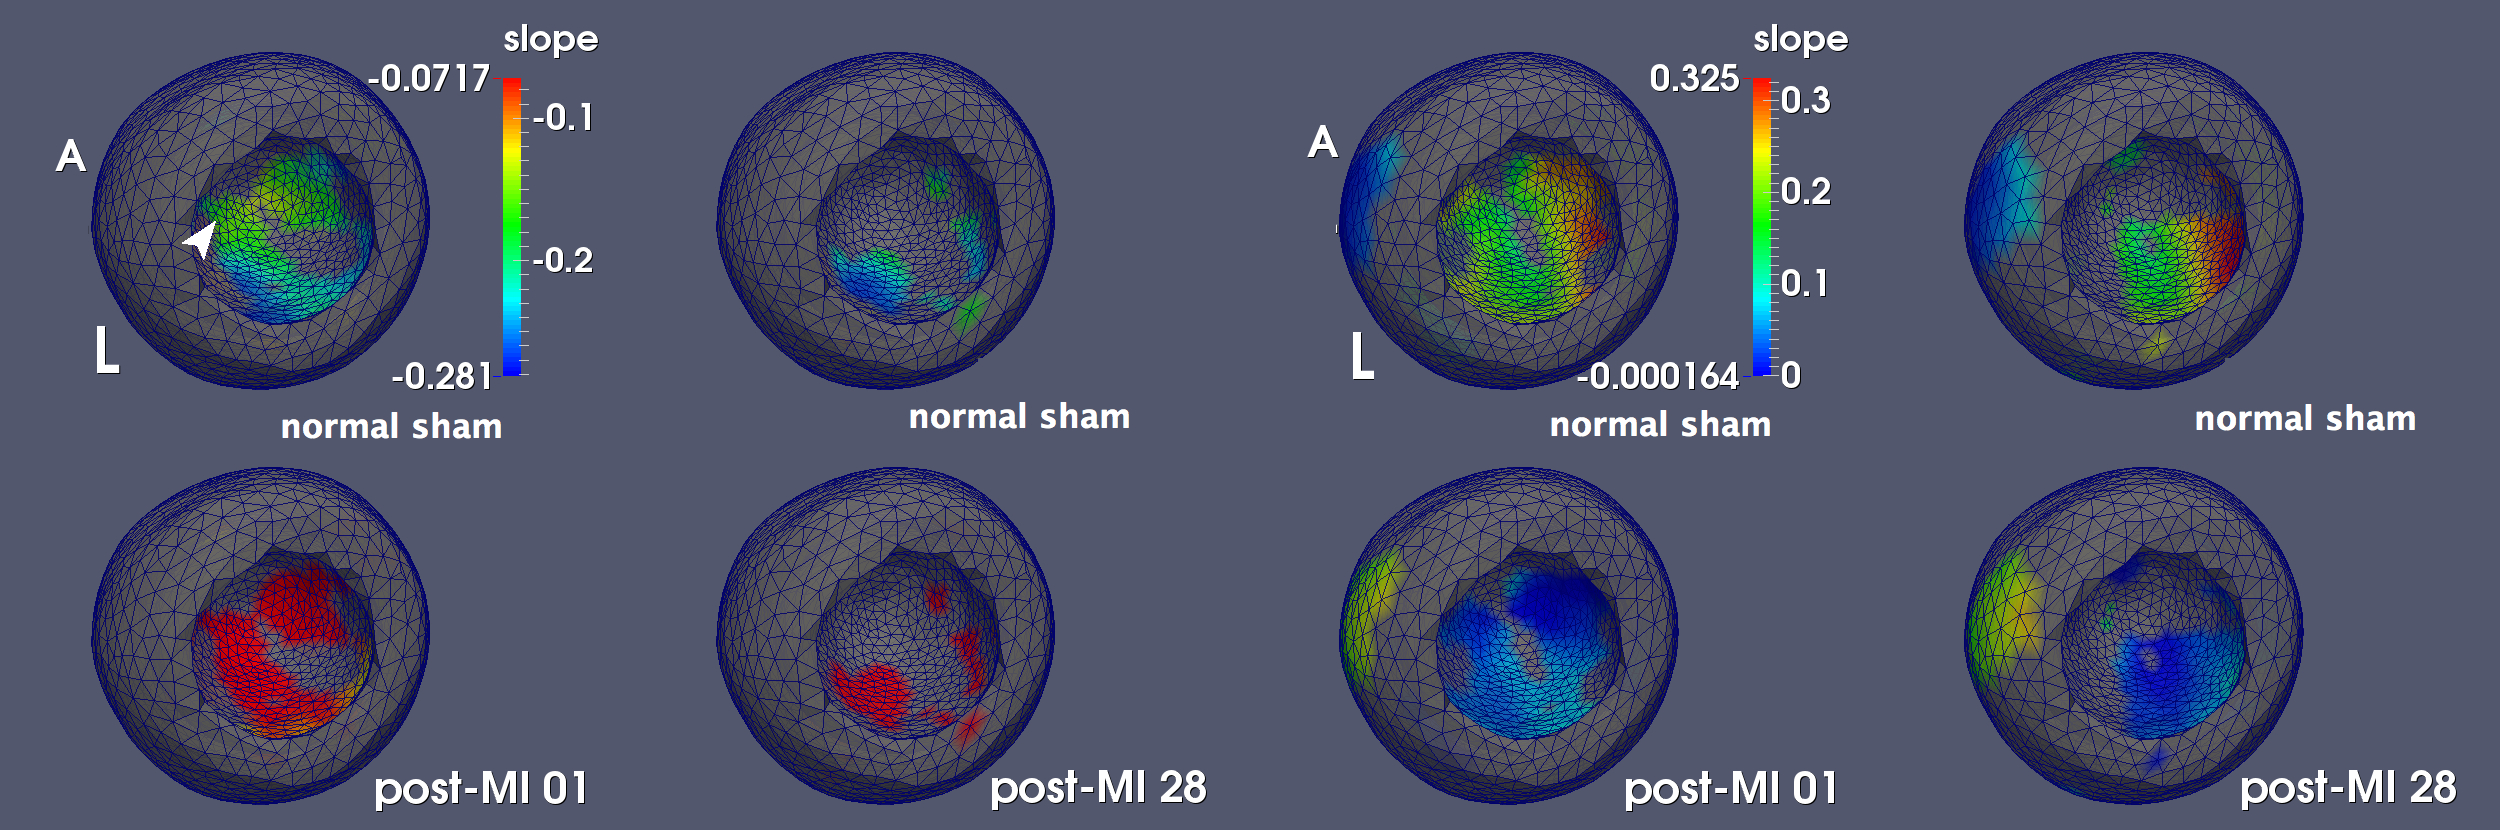
Figure 1 illustrates radial wall thinning in one particular animal at days 1 and 28 following infarction. Note the expansion of wall thinning towards septum. A similar pattern was identified at the group level, which was confirmed by conducting a node-based non-parametric permutation statistical analysis for radial thinning between normal sham and either of post-MI day 1 and day 28 animals, separately (Fig 2). We also identified statistically significant regional myocardial elongation (p = 0.029) and circumferential expansion (p = 0.002) between normal sham group and post MI group at day 28. All statistics were corrected for multiple comparisons test using false discovery rate (FDR) method2. Results of motion-related (dynamic) shape analysis indicate widespread differences between normal sham and post-MI groups for both systolic and diastolic phases. Figure 3 indicates that both post-MI groups (day 1 and 28) demonstrate significant wall thinning at the infarction zone (anterior apical and mid-wall region). Moreover at the anterior basilar region (adjacent to infarct area), we observe significantly less systolic radial wall thickening. During diastolic phase, we observe significantly less radial wall thinning in post-MI groups (Fig. 3) that may indicates smaller change in radial diameter of myocardium due to the lack of contractile tissue in infarct zone. Statistical analysis of circumferential wall shrinkage/expansion during systole/diastole phases indicates less endocardial surface shrinkage (at apex and posterior wall - remote area) during contraction phase and almost no circumferential expansion during relaxation phase at the similar location for post-MI groups (Figs. 4).Discussion
We present an application of a novel computational model to characterize LV geometry changes using MRI. Prior works indicate that shape metrics beyond simple measures of mass and volume can provide predictive value in cardiac disease3. The LV remodeling is complex and involves heterogeneous changes of the myocardium resulting in 3D alterations of LV shape and function. Cardiac shape matching is a crucial step for comparison of LV geometry/function across populations and over multiple diseases time periods. While cardiac MRI can generate intrinsically three-dimensional (3D) images, due to low out-of-plane resolution of MR images, a 3D reconstruction of the geometry usually requires surface-fitting to LV contours using some predefined geometry4, which could potentially introduce an unnecessary geometric constraint and consequently mask subtle geometric alterations. This approach can be used in pre-clinical and clinical settings to quantify correlation between cardiac tissue damage and regional alteration in LV geometry and function.Acknowledgements
Authors would like to thank Mrs. Michelle Leppo for her assistance with animal preparation. This work was partially supported by funding from the National Institute of Health: R21HL109968, R24HL085343, R01HL063030, and R01HL130292.References
1. Ardekani S, Jain S, Sanzi A, Corona-Villalobos CP, Abraham TP, Abraham MR, Zimmerman SL, Wu KC, Winslow RL, Miller MI, Younes L. Shape analysis of hypertrophic and hypertensive heart disease using MRI-based 3D surface models of left ventricular geometry. Med Image Anal. 2016 Apr;29:12-23.
2. Pounds SB. Estimation and control of multiple testing error rates for microarray studies. Brief Bioinform. 2006 Mar 1;7(1):25–36. PMID: 16761362
3. Gjesdal O, Bluemke DA, Lima JA. Cardiac remodeling at the population level--risk factors, screening, and outcomes. Nat Rev Cardiol. 2011 Oct 25;8(12):673-85. doi: 10.1038/nrcardio.2011.154.
4. Wang VY, Lam HI, Ennis DB, et al. Modelling passive diastolic mechanics with quantitative MRI of cardiac structure and function. Med Image Anal. 2009 Oct;13(5):773–784.
Figures