4763
Automatic detection of corrupted frames in cardiac DTI with machine learning1Cardiovascular BRU, Royal Brompton Hospital, London, United Kingdom, 2NHLBI, National Institutes of Health, MD, United States
Synopsis
In vivo cardiac DTI is capable of probing the microstructure of the myocardium and its dynamics throughout the cardiac cycle. The typical cardiac DTI scan data will contain corrupted frames due to cardiac and respiratory motion. Currently an experienced observer identifies corrupted frames by means of a visual assessment and manually removes them. In this work we show that machine learning can be used to accurately assess DTI corrupted frames, reducing the user input, accelerating analysis and removing human subjectivity.
Purpose
The objective of this work is to accelerate the post-processing of cardiac diffusion tensor imaging (DTI) by automating the removal of corrupted frames with machine learning.Background
In vivo cardiac DTI is capable of probing the microstructure of the myocardium and its dynamics throughout the cardiac cycle. A typical DTI study of one mid-ventricular slice scanned at two stages of the cardiac cycle will typically contain more than 180 frames, with approximately 14% of them corrupted by signal loss due to cardiac and respiratory motion. Currently an experienced observer identifies corrupted frames by means of a visual assessment and manually removes them, before the diffusion tensor is calculated. This can take up to 5 minutes per subject.Methods
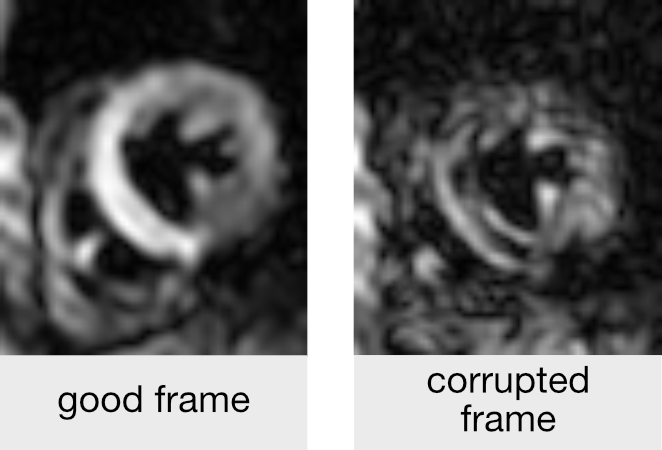
Data from a total of 51 subjects (19 healthy, 32 patients) scanned at systole and diastole were used to assess the accuracy of machine learning (ML). A visual assessment by two experienced users identified 1407 corrupted frames (figure 1) out of a total of 9651 frames (8% in healthy, 18% in disease). Half of the subjects in both cohorts were randomly selected for machine training. The remaining data were used to determine the accuracy of the algorithm.
A ML algorithm was used, where images are converted to a vector quantization of affine invariant descriptors1 before using a quadratic support vector machine classifier (MATLAB, Mathworks, Massachusetts, USA). The accuracy of corrupt frame identification by machine learning was compared to the best intrasubject image similarity algorithm we tested, a Pearson correlation coefficient (PCC) test (with the optimum threshold for this data).
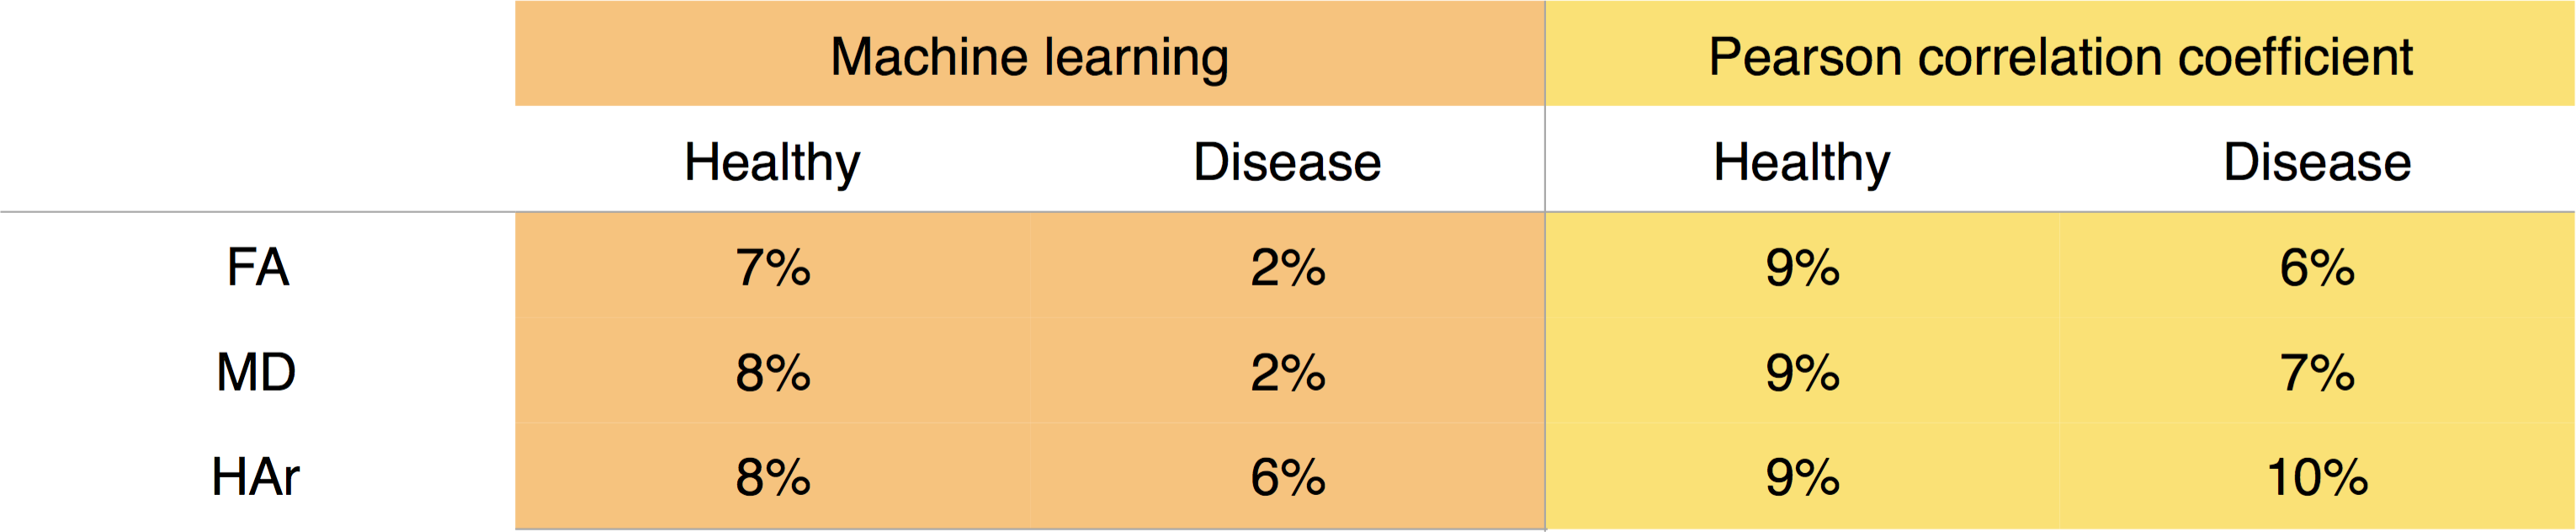
Three common cardiac DTI parameters: Fractional Anisotropy (FA), Mean Diffusivity (MD), and Helix-angle range (HAr); were compared for the same test cohorts when processing the data with the corrupted frames removed by the initial visual assessment, and by the two automated methods: ML and PCC.
Results
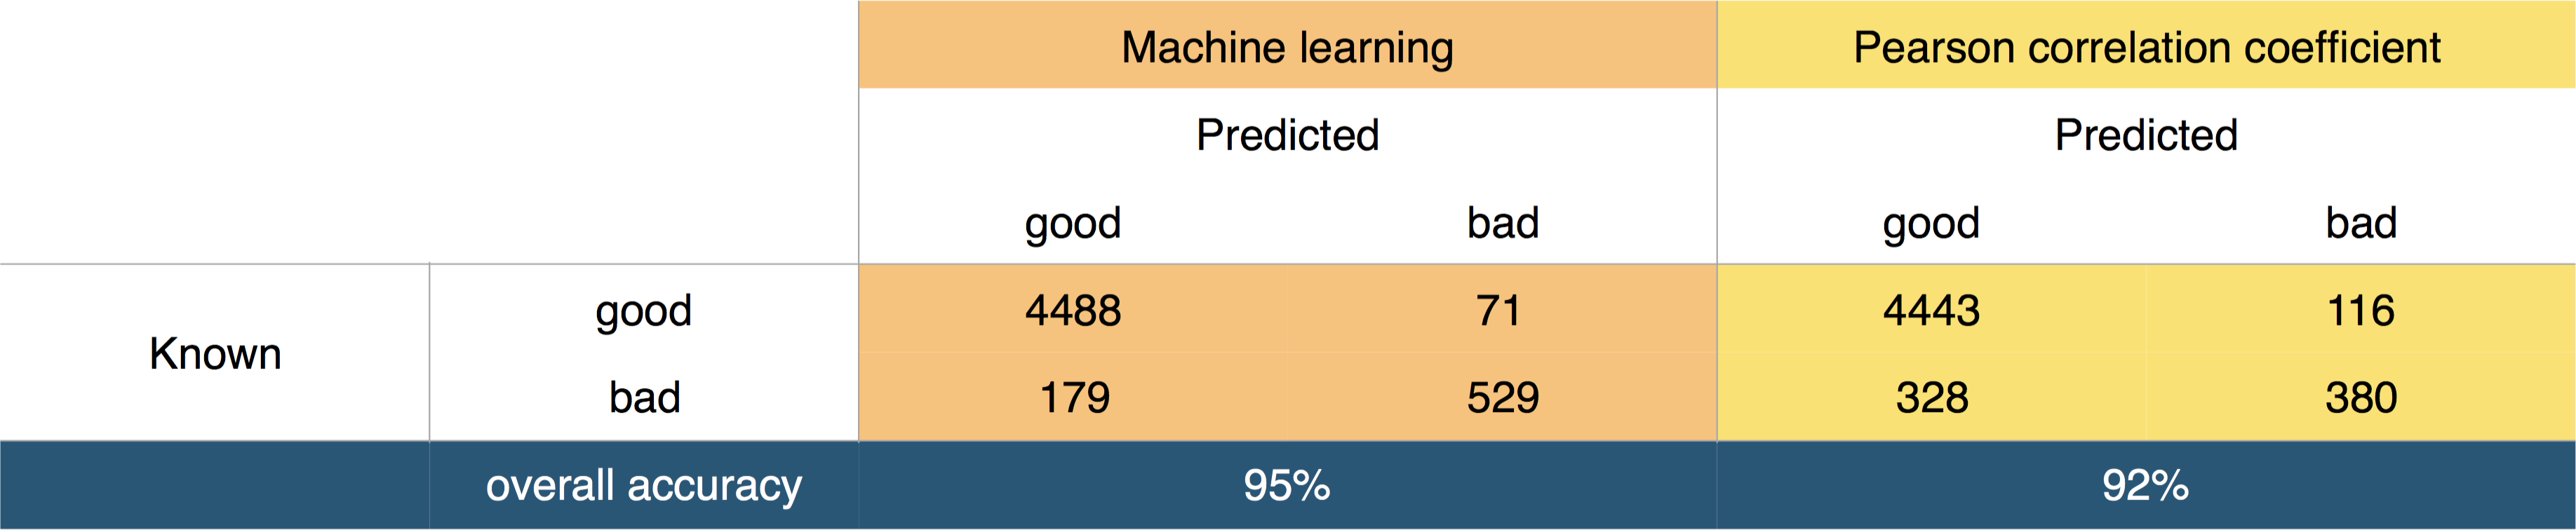
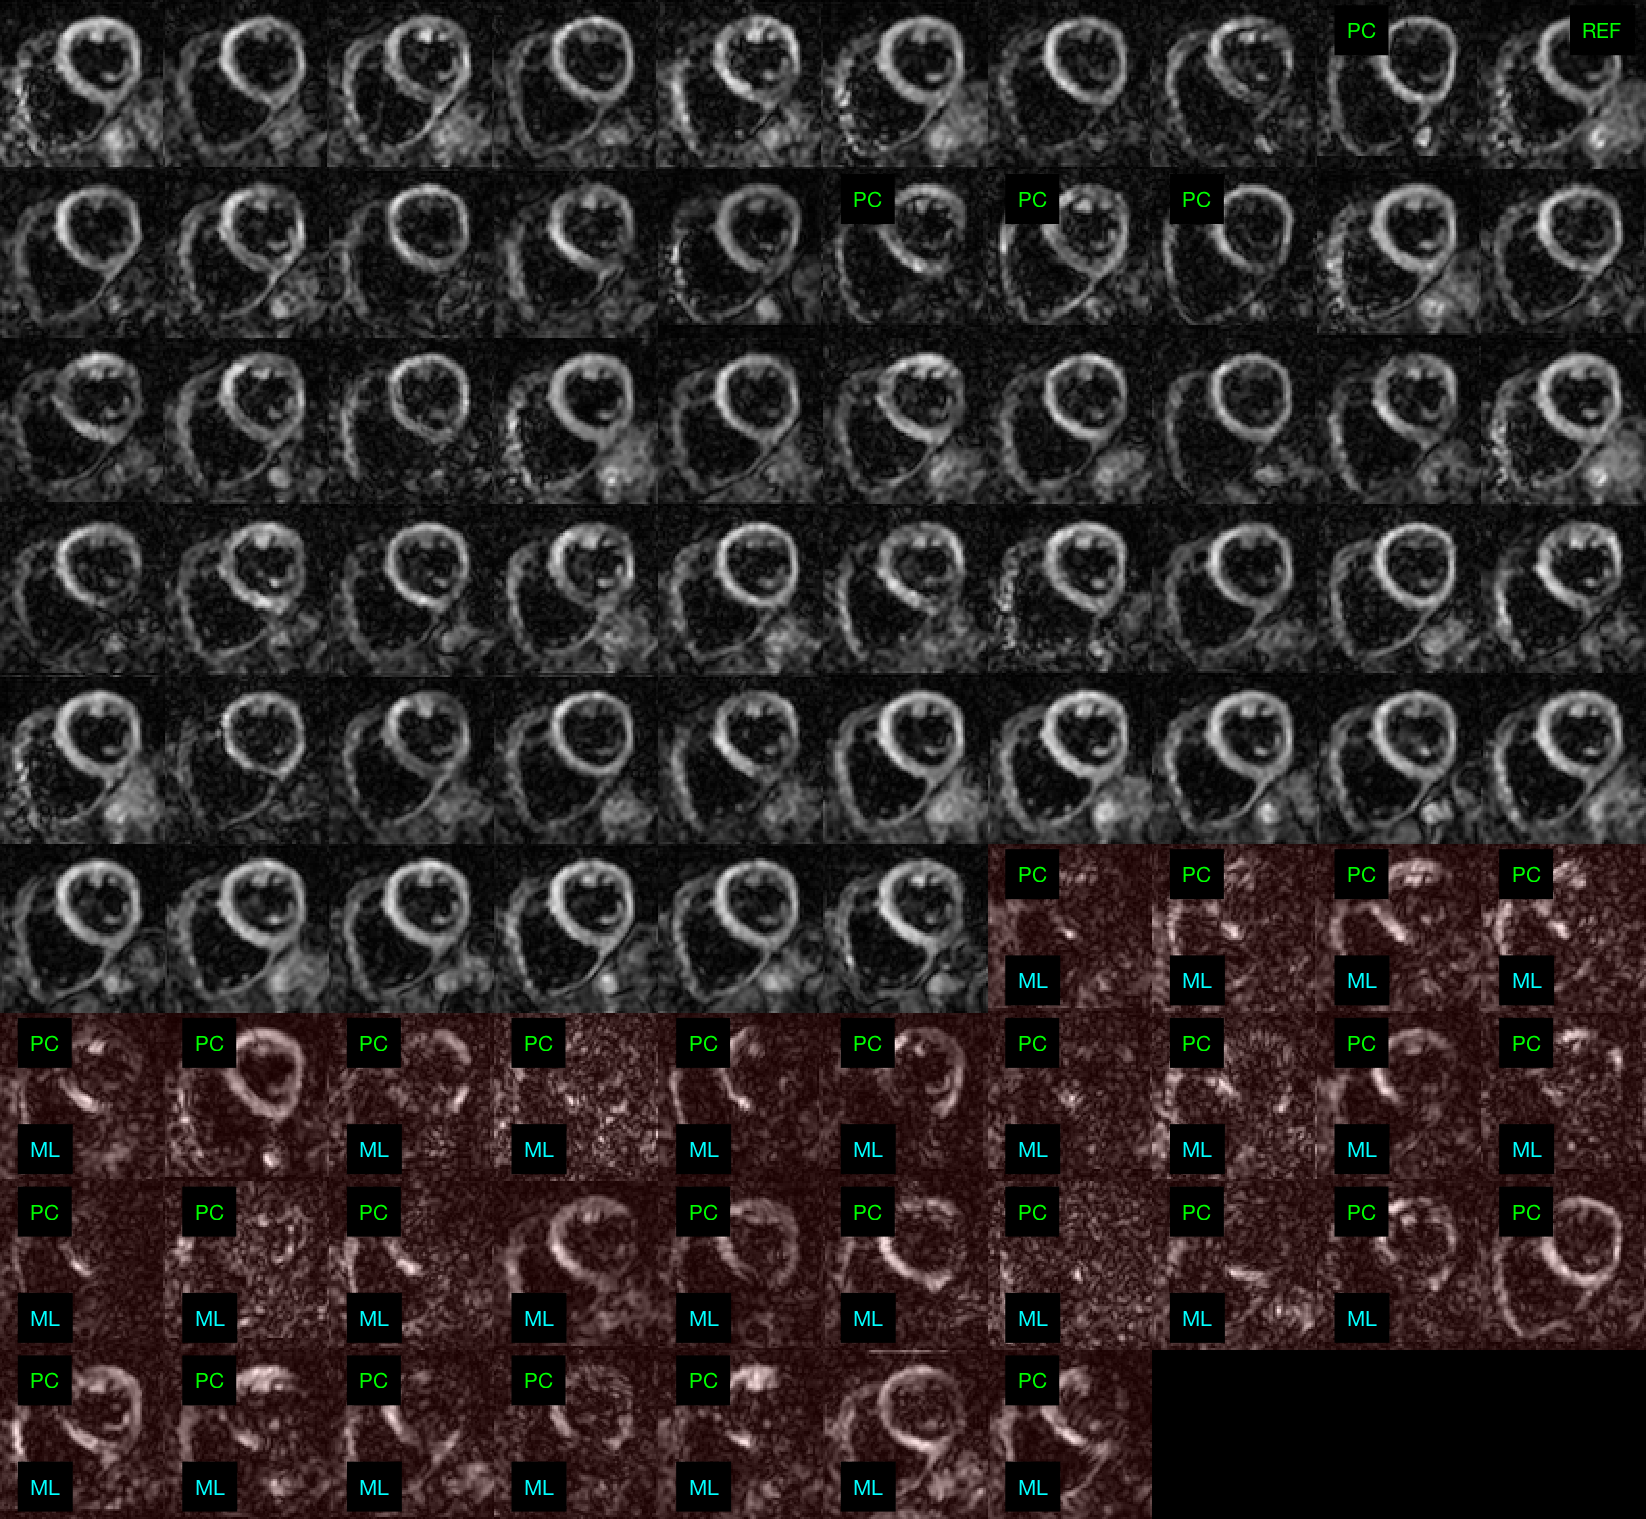
The accuracy of corrupt frame identification with ML was statistically significantly higher than that of the PCC tests (p = 0.002, Wilcoxon signed rank). The overall confusion matrices are shown in figure 2. An intersubject mean+/-SD accuracy of 95+/-5% was achieved with ML, above the mean 92+/-11% accuracy of PCC. Machine learning yielded significantly lower false negatives (figure 3) and a lower inter-subject accuracy variance.
An overall average mean difference to the visual assessment of 6% and 8% are observed for ML and PCC respectively when combining all DTI parameters (figure 4). The ML algorithm takes approximately 25 seconds to assess the entire database of 51 subjects.
Discussion & Conclusions
ML can be used to accurately assess DTI corrupted frames with better efficiency than image similarity measures. Therefore, ML is capable of reducing the user input, accelerating analysis and removing human subjectivity. As the DTI patient database grows, more data will be available for training, potentially improving accuracy further.
Acknowledgements
This project was supported by the NIHR cardiovascular Biomedical Research Unit at the Royal Brompton and Harefield NHS Foundation Trust and by the Wellcome Trust [WHCC NCP142].References
1 – Csurka, G., Dance, C., Fan, L., et al. Visual categorization with bags of keypoints. (2004): 1--2.Figures