4762
Fully automatic myocardial ECV mapping: deformable image registration, LV segmentation and a cloud computing pipeline1Department of Electrical Engineering, National Taiwan University of Science and Technology, Taipei, Taiwan, 2Deptartment of Radiology, Kao-Hsiung Veterans General Hospital, Kao-Hsiung, Taiwan
Synopsis
In this study, we developed an automatic pipeline and segmentations of left ventricle walls for mapping myocardial extracellular volume fraction (ECV) and calculating global ECV values. The system combined with user-friendly web-based user interface was packaged into a software container. We used this system to analyze myocardial T1 images obtained from subjects with tetralogy of Fallot (TOF). The ECV values of the TOF data sets were significantly higher than those of the normal subjects. This automatic pipeline could be a practical tool for clinical evaluations of myocardial fibrosis with MR MOLLI T1 images.
Purpose
Quantitative estimation of extracellular volume fraction (ECV) allows evaluations of myocardial fibrosis1. Myocardial ECV mapping relies on pixel-by-pixel comparisons of myocardial T1 constants obtained before and after contrast administration. Therefore, deformable registration and ROI selection methods are crucial for producing reliable ECV results. In this study, we implemented a fully automatic pipeline to produce ECV maps and global ECV values of left ventricular (LV) walls and used the system to analyze ECV values of subjects with tetralogy of Fallot (TOF).Materials and Methods
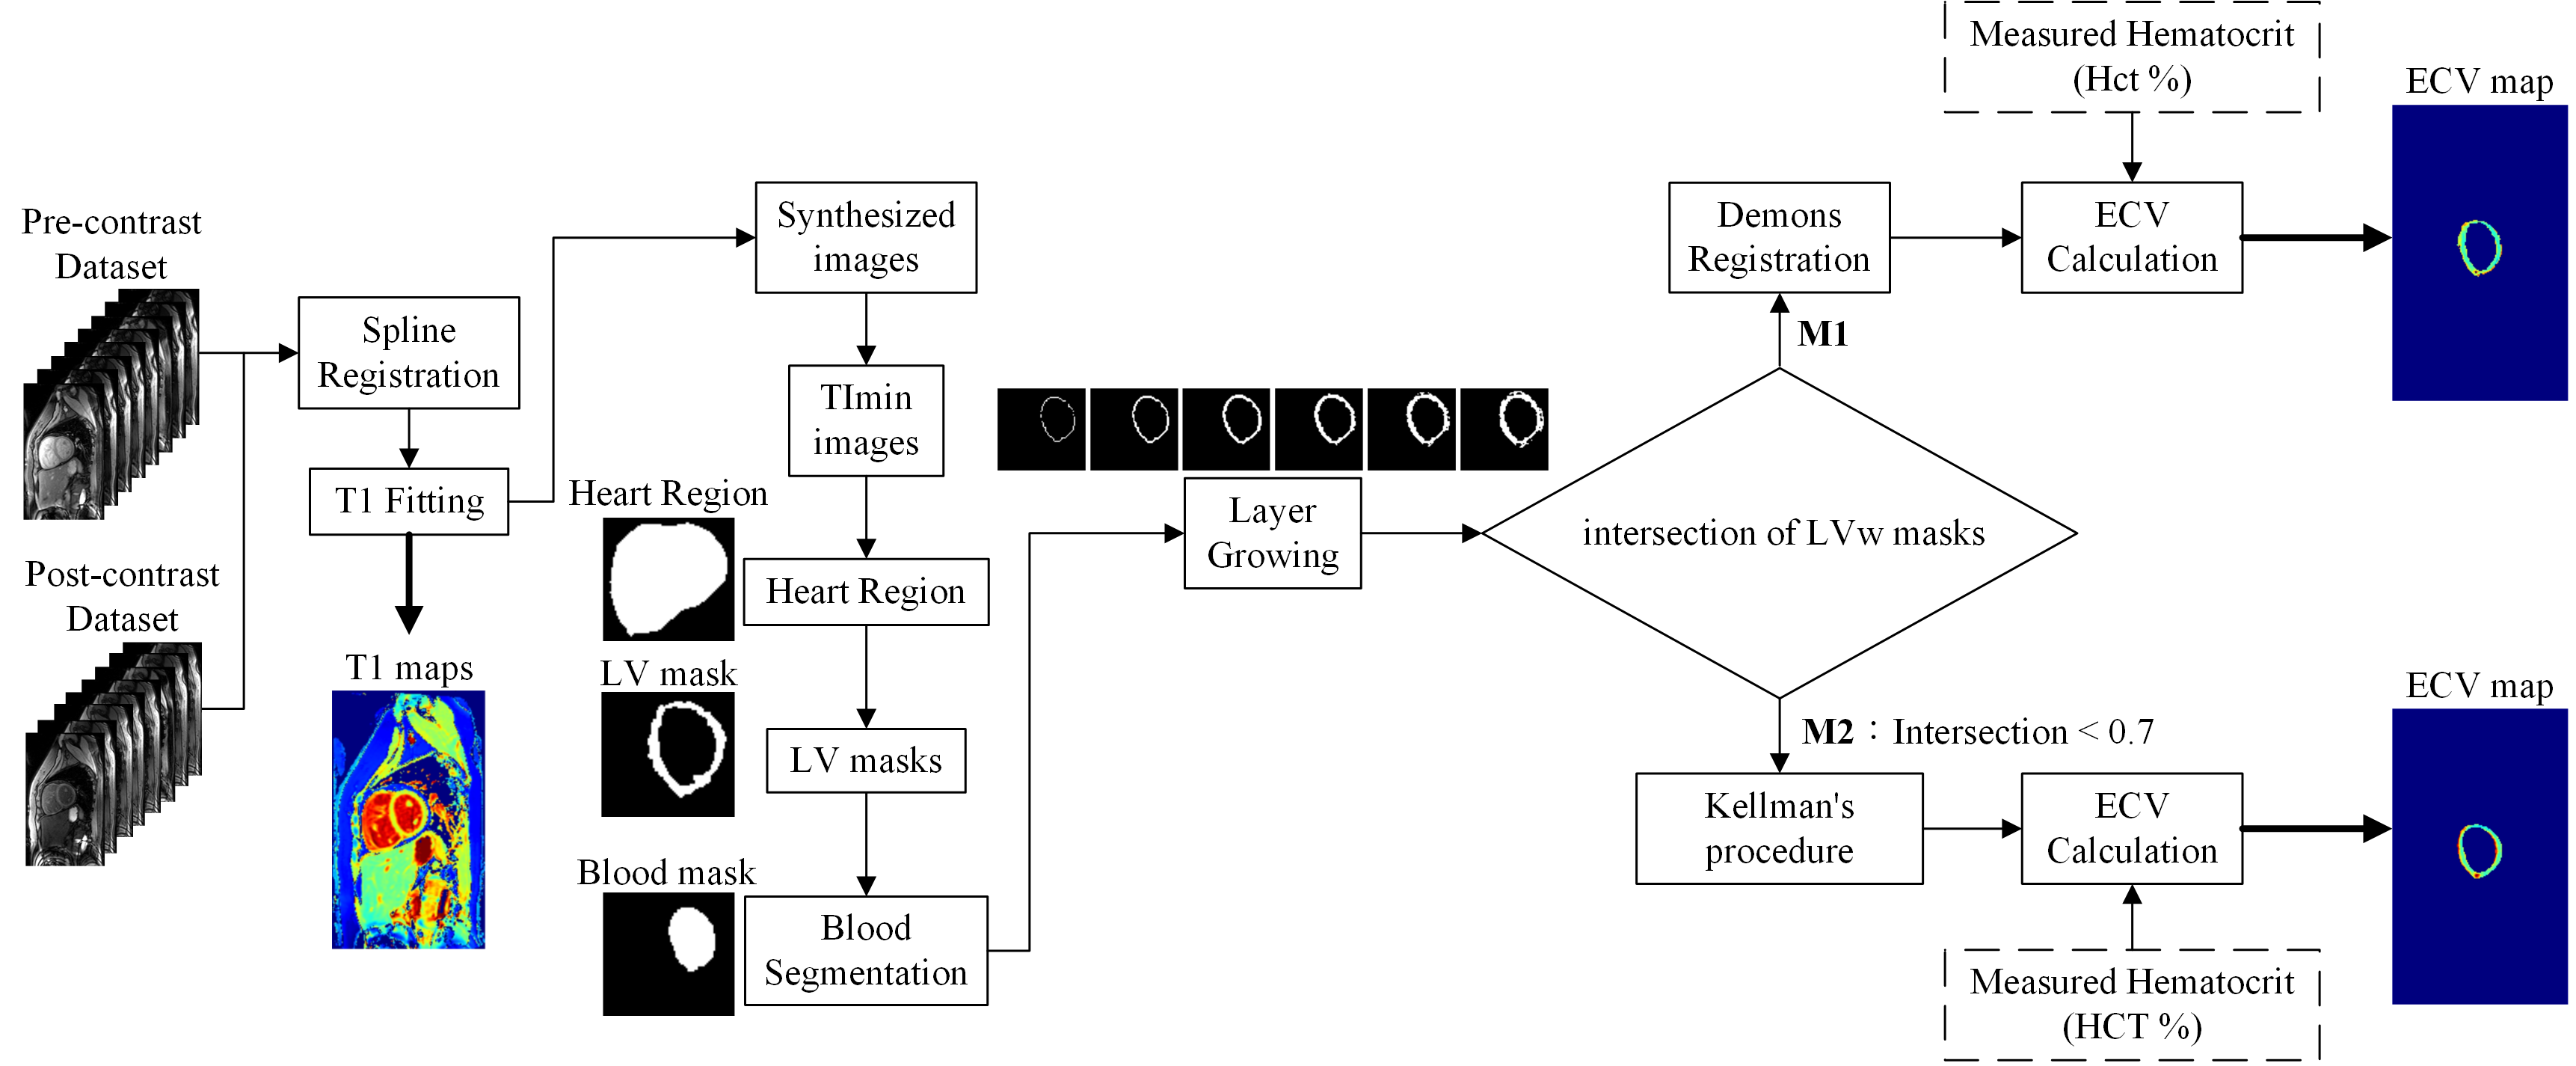
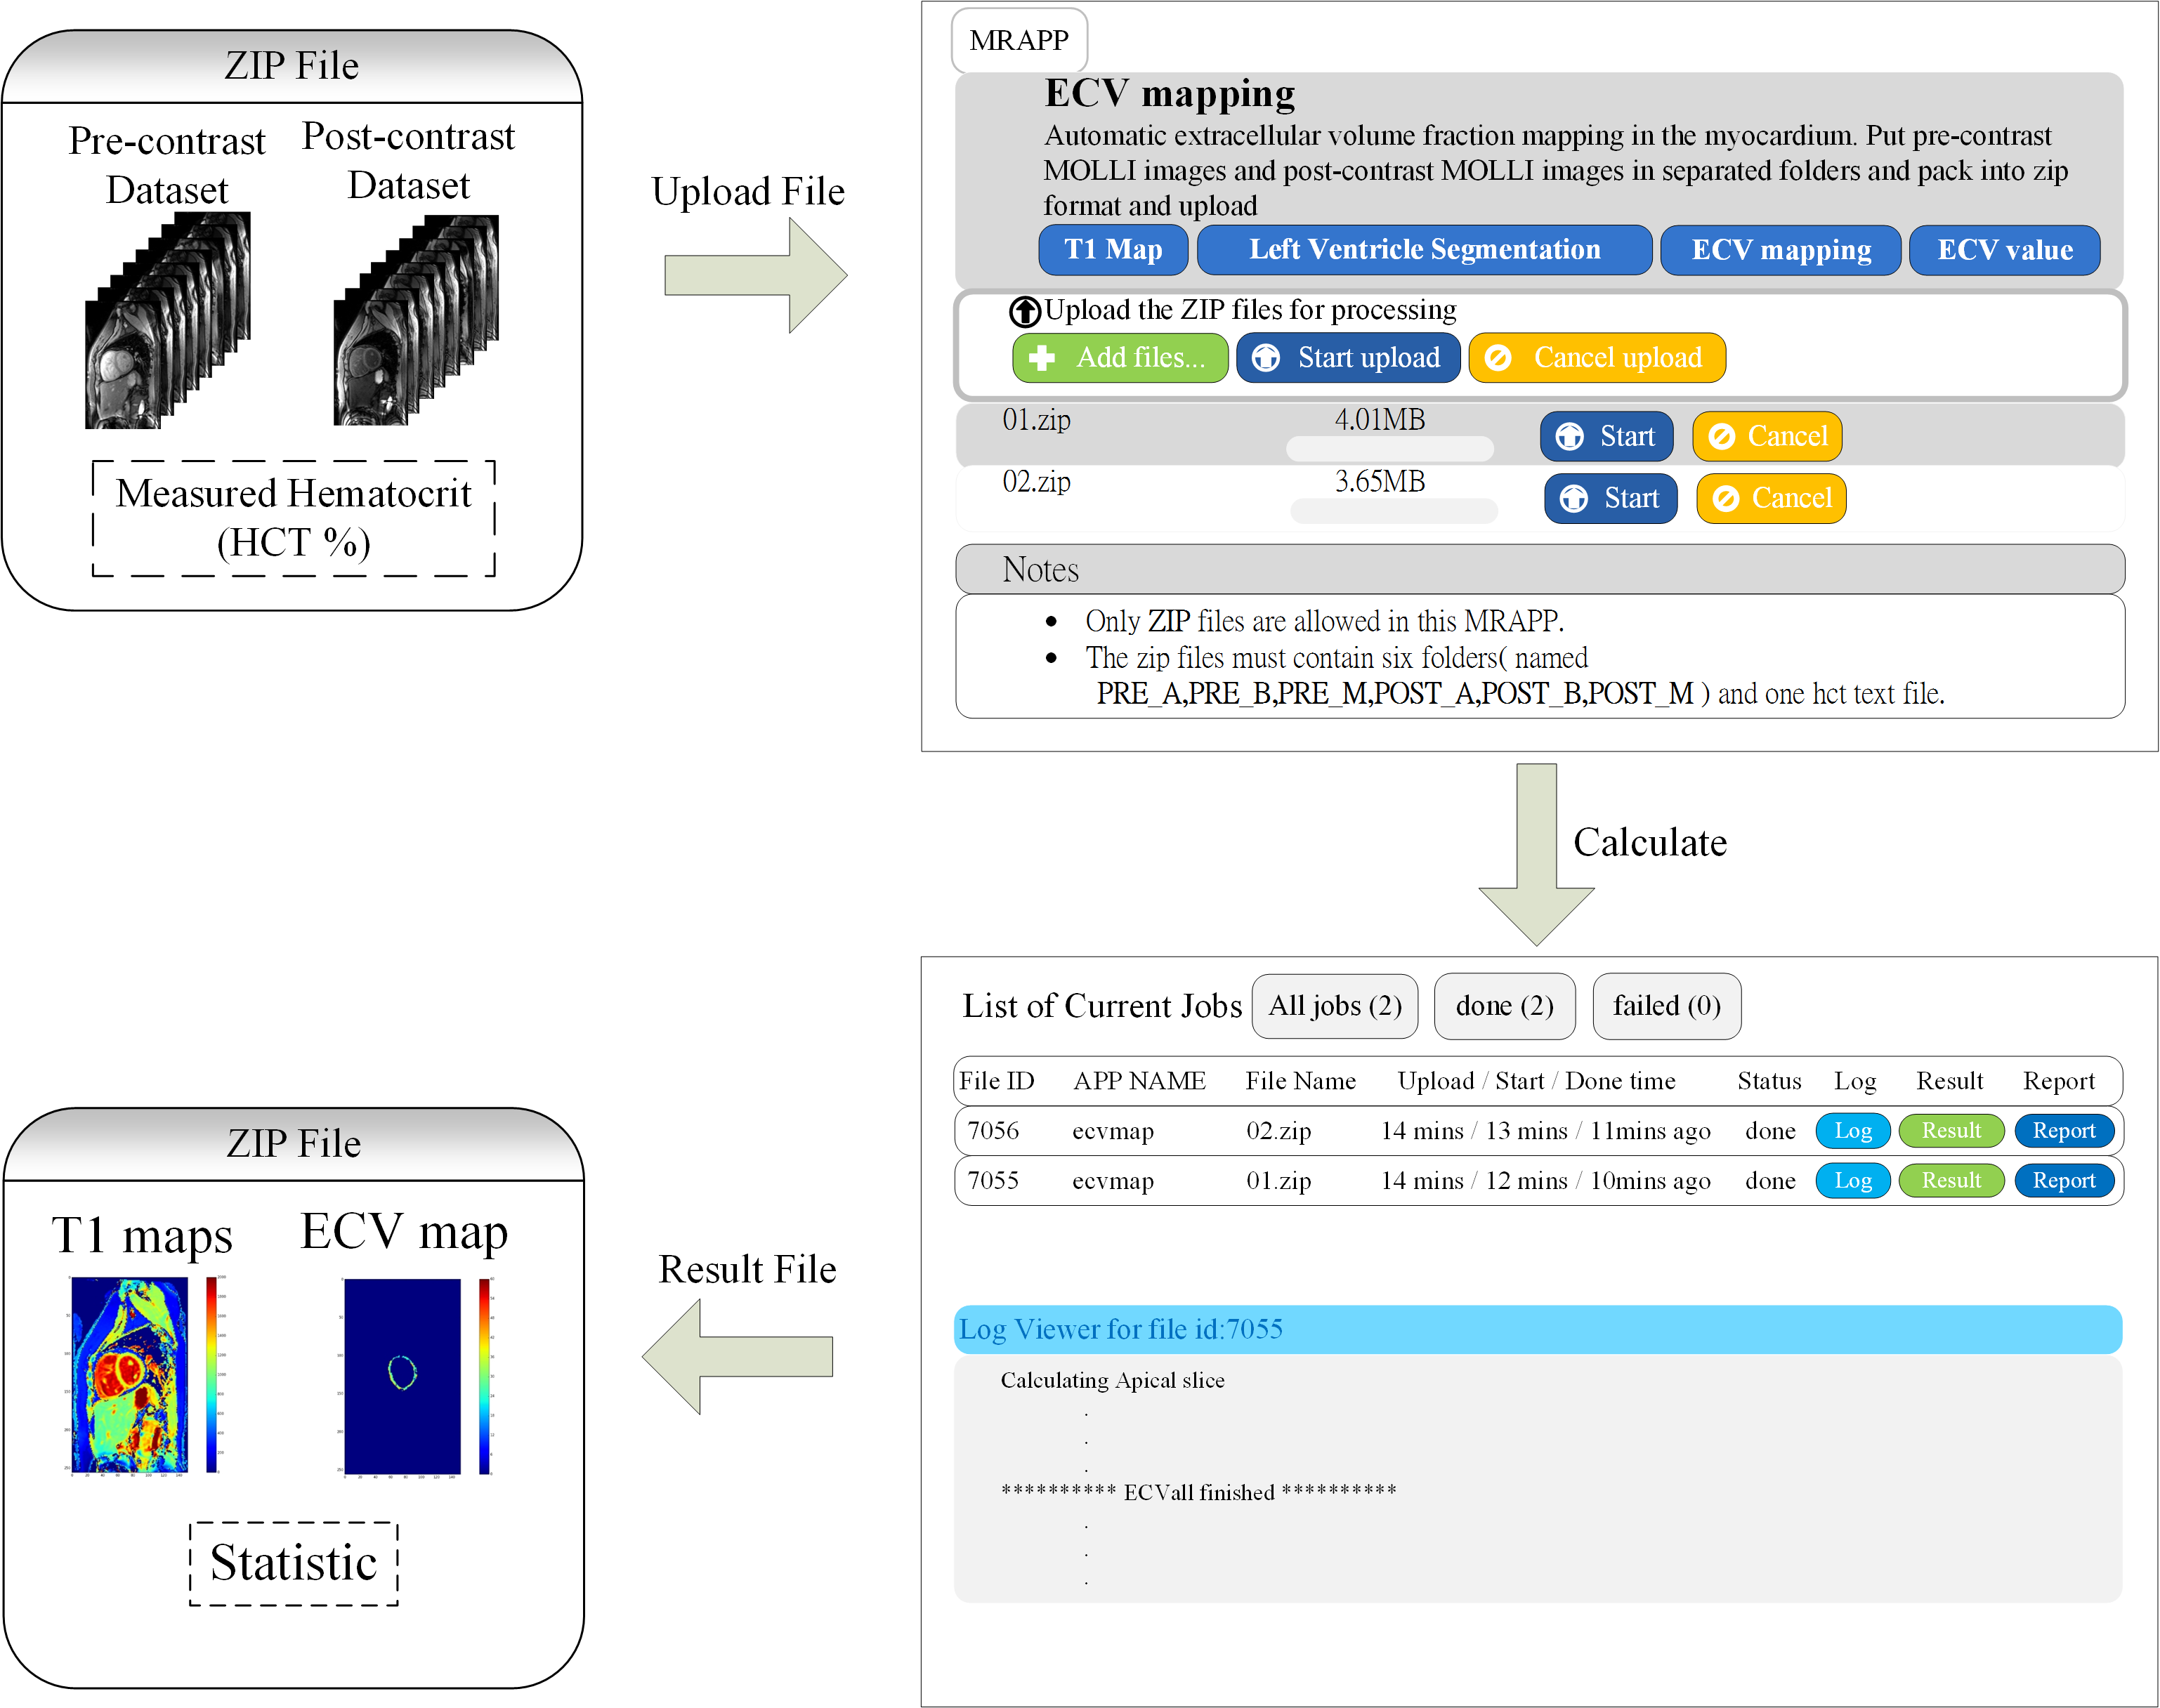
A total of 42 subjects (28 males and 14 females; age: 22.13 ± 3.3 years; TOF: 19, control: 23) participated in the study approved by the institution’s review board after providing informed consents. The study was performed on 3.0T MRI system (Skyra, Siemens). We acquired two sets of modified Look-Locker inversion recovery2 (MOLLI) T1 images before and after contrast administrations using the parameters (slices: basal, mid-cavity and apical, MOLLI acquisition scheme: 5-3 or 4-3-2, TR/TE: 295.26/1.12ms, matrix: 256×152). The hematocrit (Hct) was measured using a blood sample. The program was processed in the Python environment. Figure 1 shows the block diagram of the procedures calculating ECV map. It consisted of four major functions (1) deformable registration between pre- and postcontrast MOLLI datasets (2) automatic segmentation of left ventricle (LV) walls with layer-growing, (3) quality check of the segmentation result of LV walls (LVw) (4) additional demons registration. The function (1) and (2) was detailed in our previous study3,4, which showed that the demons registration method in cooperated with the automatic LVw segmentation significantly improved the ECV mapping. The procedure was termed M1 in this report. However, the automatic LVw segmentation method did not work well on part of the postcontrast images due to relatively low contrasts between the blood pool region and the myocardium. As a quality assurance, the analysis pipeline checked the intersection of the obtained pre- and postcontrast LVw masks. If the intersection of the two areas was less than 70%, we than skipped the additional demons registration and used the pre-contrast LV-walls mask for ECV computation. The later method was termed M2, which was close to the analysis procedure presented by Kellman1. Finally, we used the registered T1 maps and the masks of LV walls to produce ECV maps [ECV = (1−Hct) × (ΔR1myocardium/ΔR1blood)]. We implemented a web-based user interface and packaged the whole computing pipeline in a software container. The web-based computing environment is illustrated in Fig.2.Result
We compressed the MOLLI data sets of each subject into a file and uploaded all the subject files at the same time. The cloud computing system the produced the ECV maps and the global ECV values of each slice of each data set. Amount all the slices of data sets, the distributions of the computation procedures were M1: 81.5% and M2: 18.5%. Table 1 lists the averaged global ECV values of the subjects. The ECV values of TOF subjects were significantly higher than those of the normal subjects (p < 0.05, Mann-Whitney U test). The ECV values obtained from the female subjects were significantly higher than those of the male subjects (p < 0.01, Mann-Whitney U test).Discussion and Conclusions
In this study, we presented (1) the fully automatic LVw segmentation and improved deformable registration, (2) the M1 and M2 procedures to deal with different conditions of LVw segmentations, and (3) the whole computation system encapsulated into a web-based software container. All the efforts made the entire analysis procedure (e.g., computation algorithms, the software version and the operating system) consistent throughout the analysis of all data sets. They contributed to reliable results for the assessment of ECV values. We used this system to analyze the TOF data sets and found significant higher ECV values in TOF data sets. This finding is consistent to the previous studies5. The results support that the presented system could be useful for the assessment of myocardial fibrosis diffuse myocardial fibrosis in patients with TOF. The LVw masks may be further parcellated into AHA 17 segments for local ECV assessments. It merits further investigations. We aim to release the presented system as an open source package in the future. In conclusion, we developed a computation system for ECV mapping and applied it on TOF data sets. This automatic pipeline produces reliable and consistent results and thus could be a practical tool for clinical evaluations of myocardial fibrosis with MR MOLLI T1 imaging.Acknowledgements
Supported by the Ministry of Science and Technology under grants 104-2314-B-011-001-MY3References
[1] Kellman, P et al. Extracellular volume fraction mapping in the myocardium, part 1: evaluation of an automated method. Journal of Cardiovascular Magnetic Resonance 2012, 14:63
[2] Messroghli, DR et al. Modified Look-Locker inversion recovery (MOLLI) for high-resolution T1 mapping of the heart. Magn Reson Med. 2004 Jul;52(1):141-6.
[3] Chen, CN. Automatic extracellular volume fraction mapping in the myocardium: deformable image registration combined with short-axis Left Ventricle segmentation. National Taiwan University of Science and Technology, Master Thesis, 2016.
[4] Chen, CN et al. Automatic extracellular volume fraction mapping in the myocardium: multiple initial T1 values and deformable image registration combined with LV segmentation. ISMRM, 2015.
[5] Broberg, CS et al. Diffuse LV Myocardial Fibrosis and its Clinical Associations in Adults With Repaired Tetralogy of Fallot. JACC: Cardiovascular imaging. 2016;9(1) :1-10.
Figures