4761
Fully automatic bullseye analysis on short-axis MOLLI mapping: LV segmentation and AHA 17 parcellation1Department of Electrical Engineering, National Taiwan University of Science and Technology, Taipei, Taiwan
Synopsis
The free-breathing MOLLI (FB-MOLLI) presented in our previous study allowed T1 mapping in vivo without breath-hold. In this study, we attempted to implement unsupervised reconstruction for FB-MOLLI data sets and used a deformable method for image registration to improve the reliability of free-breathing T1 mapping. The results supported that the method improved the image alignments of the FB-MOLLI data sets and thus increased the quality of the T1 map. The variations of the repeated T1 measurements were significantly reduced in the anterolateral of the LV walls.
Purpose
Researchers widely utilized an AHA segment model1 to study the regional differences of myocardial tissue characteristics of left ventricle (LV). In this study, we present a segmentation method for short-axis MOLLI2 T1 images. The method automatically generates regions of interest of the LV walls, the LV blood pool region, and the AHA segment model to facilitate analysis of myocardial T1 maps.Material and Methods
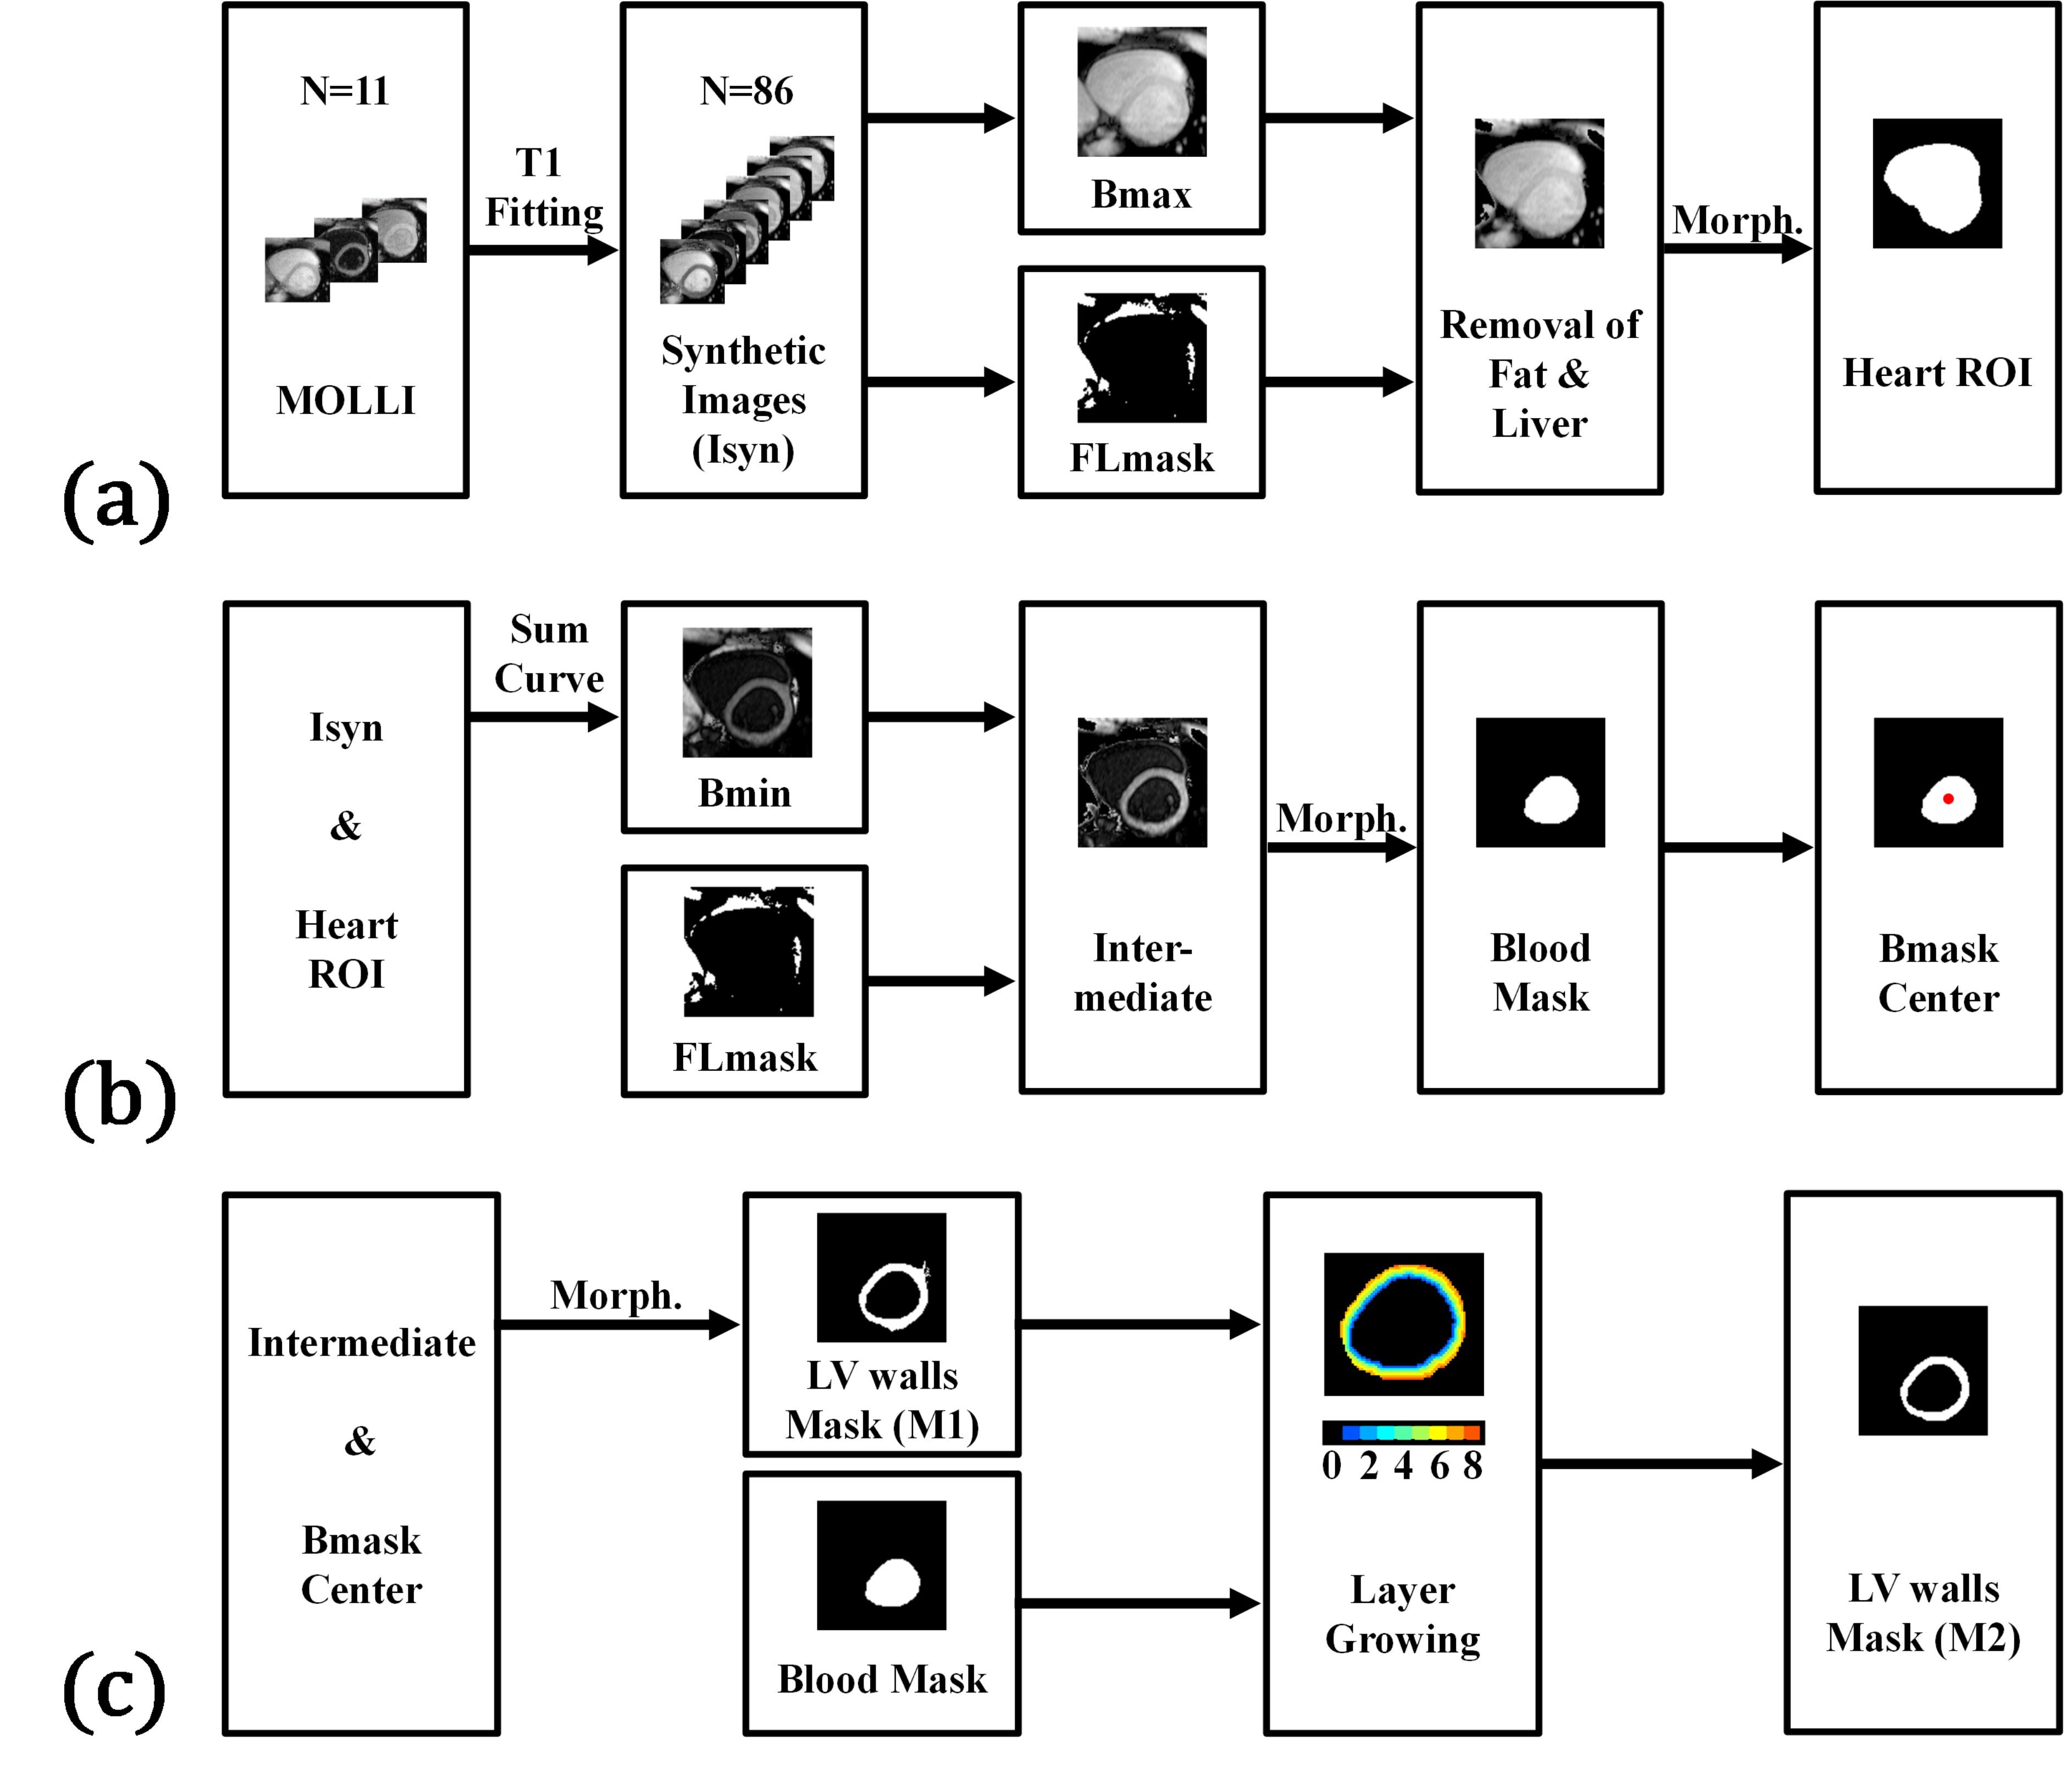
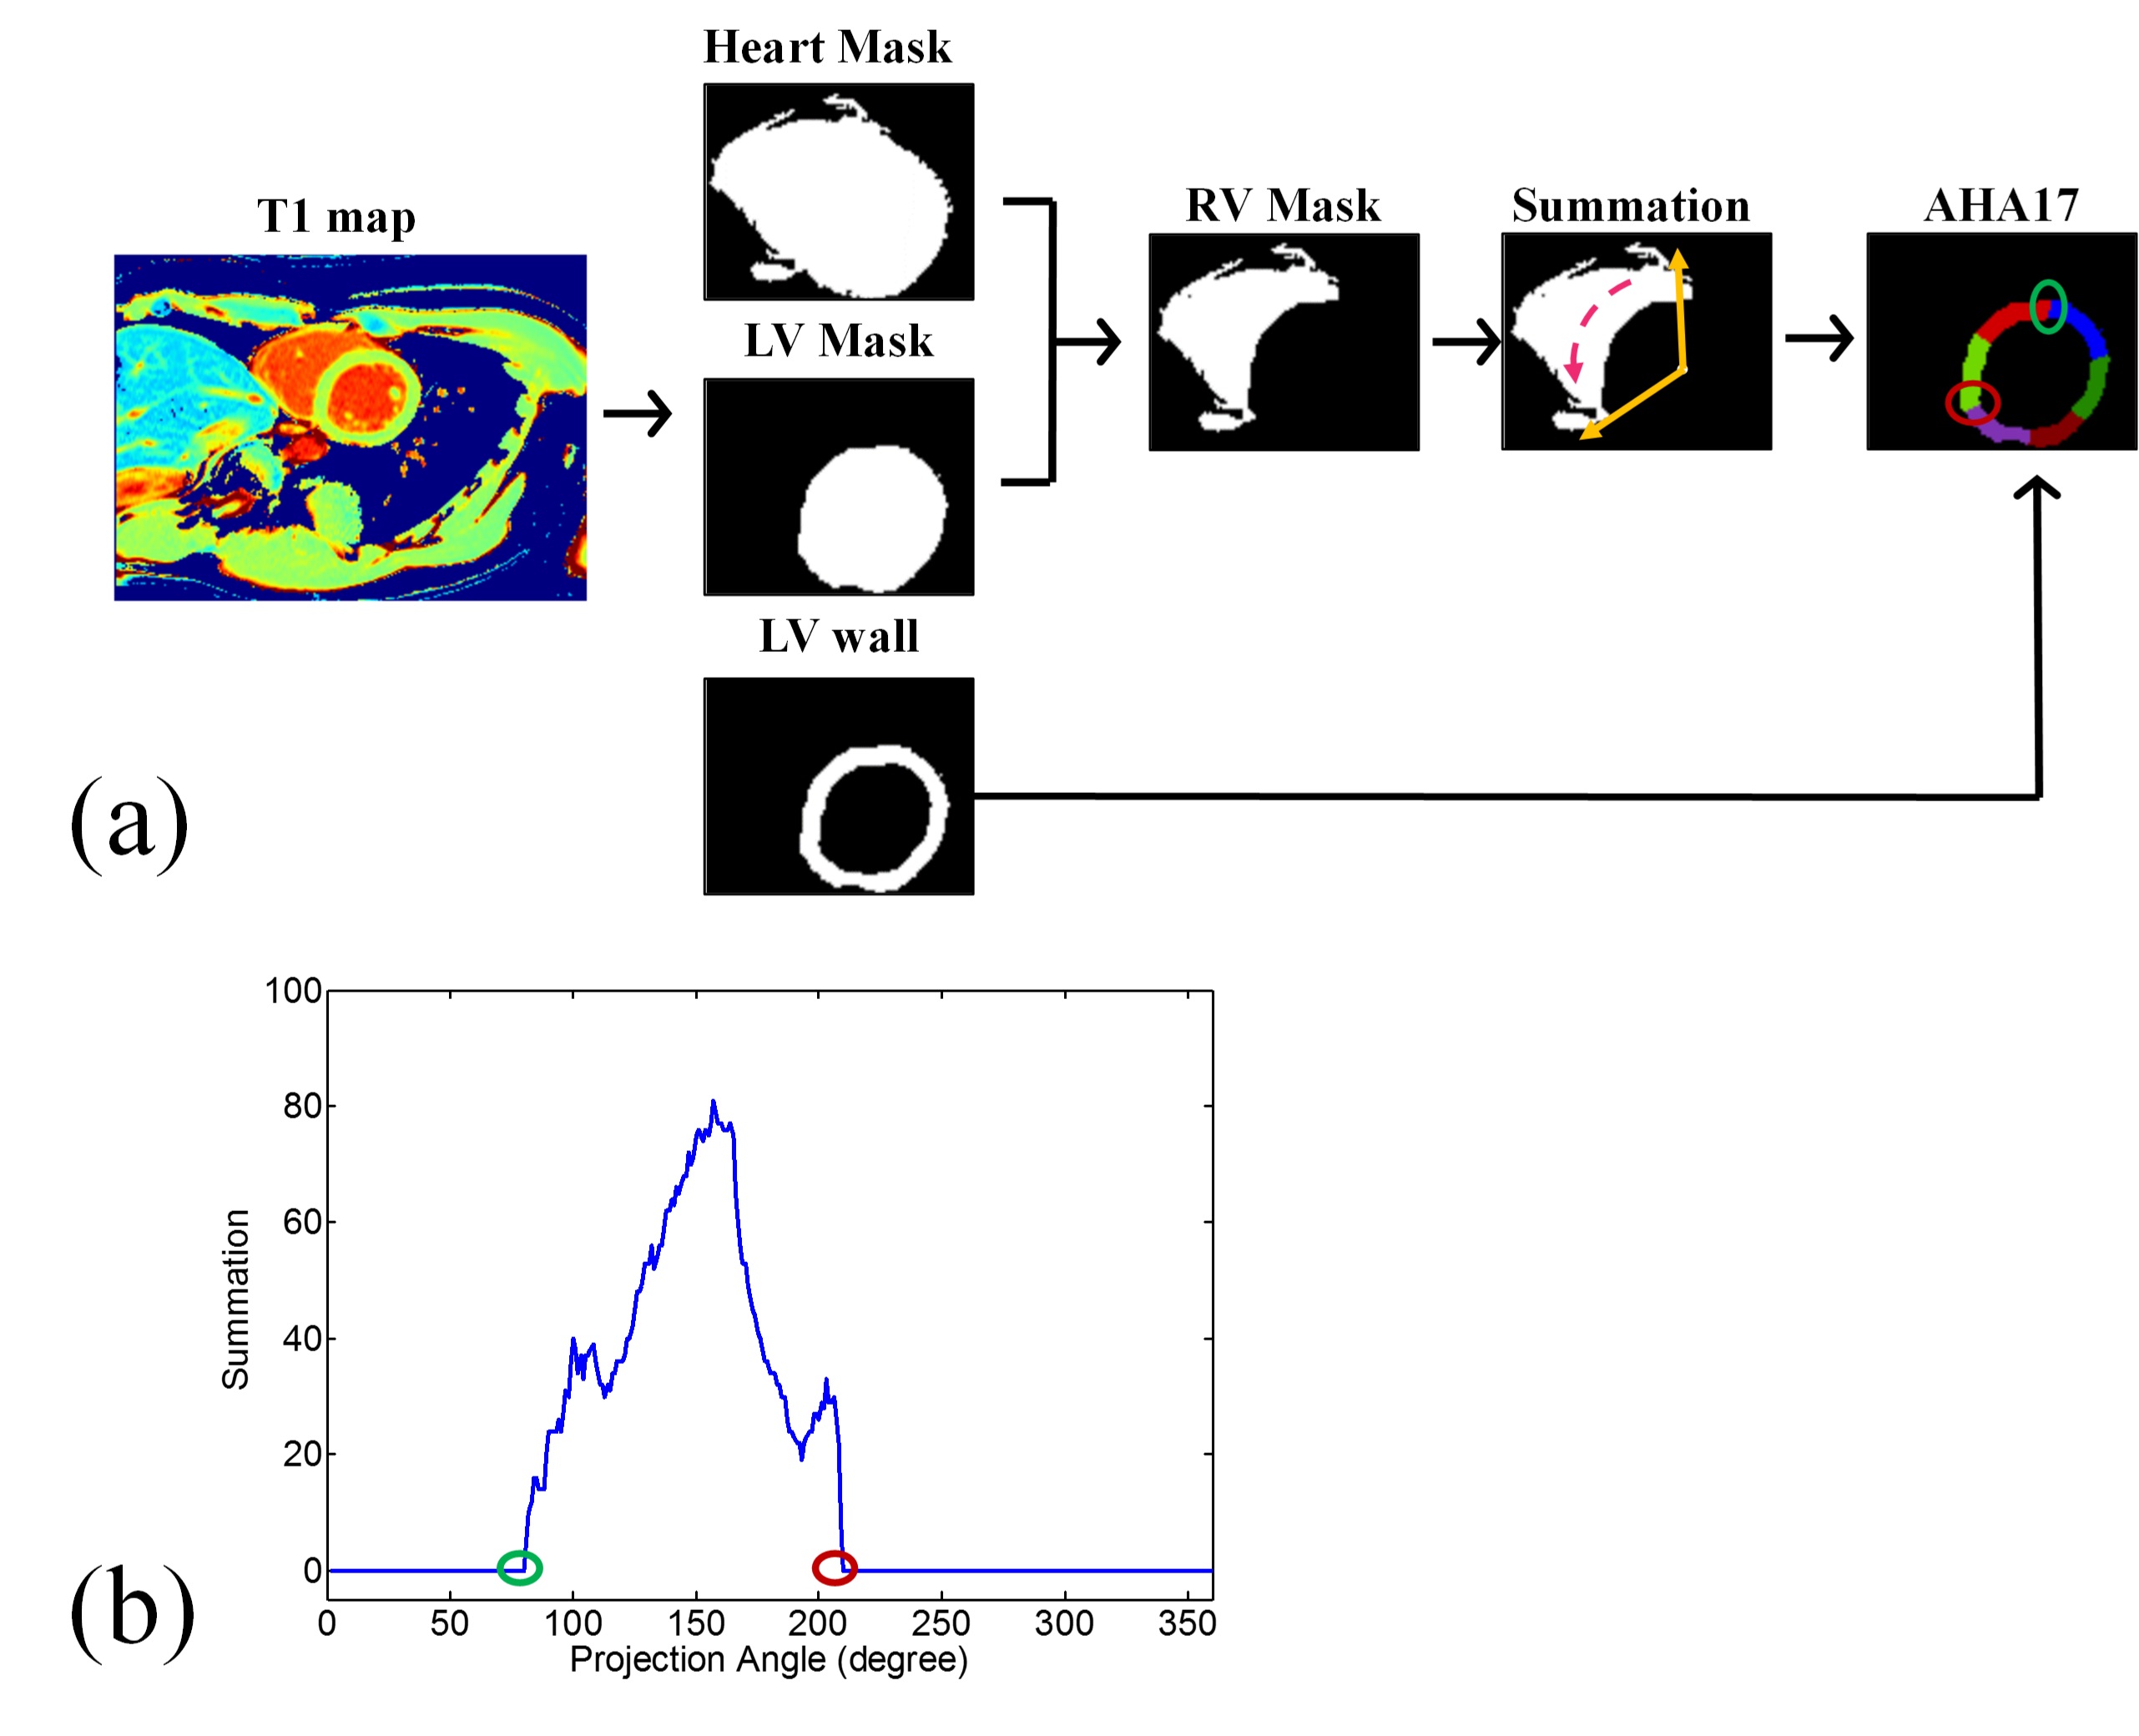
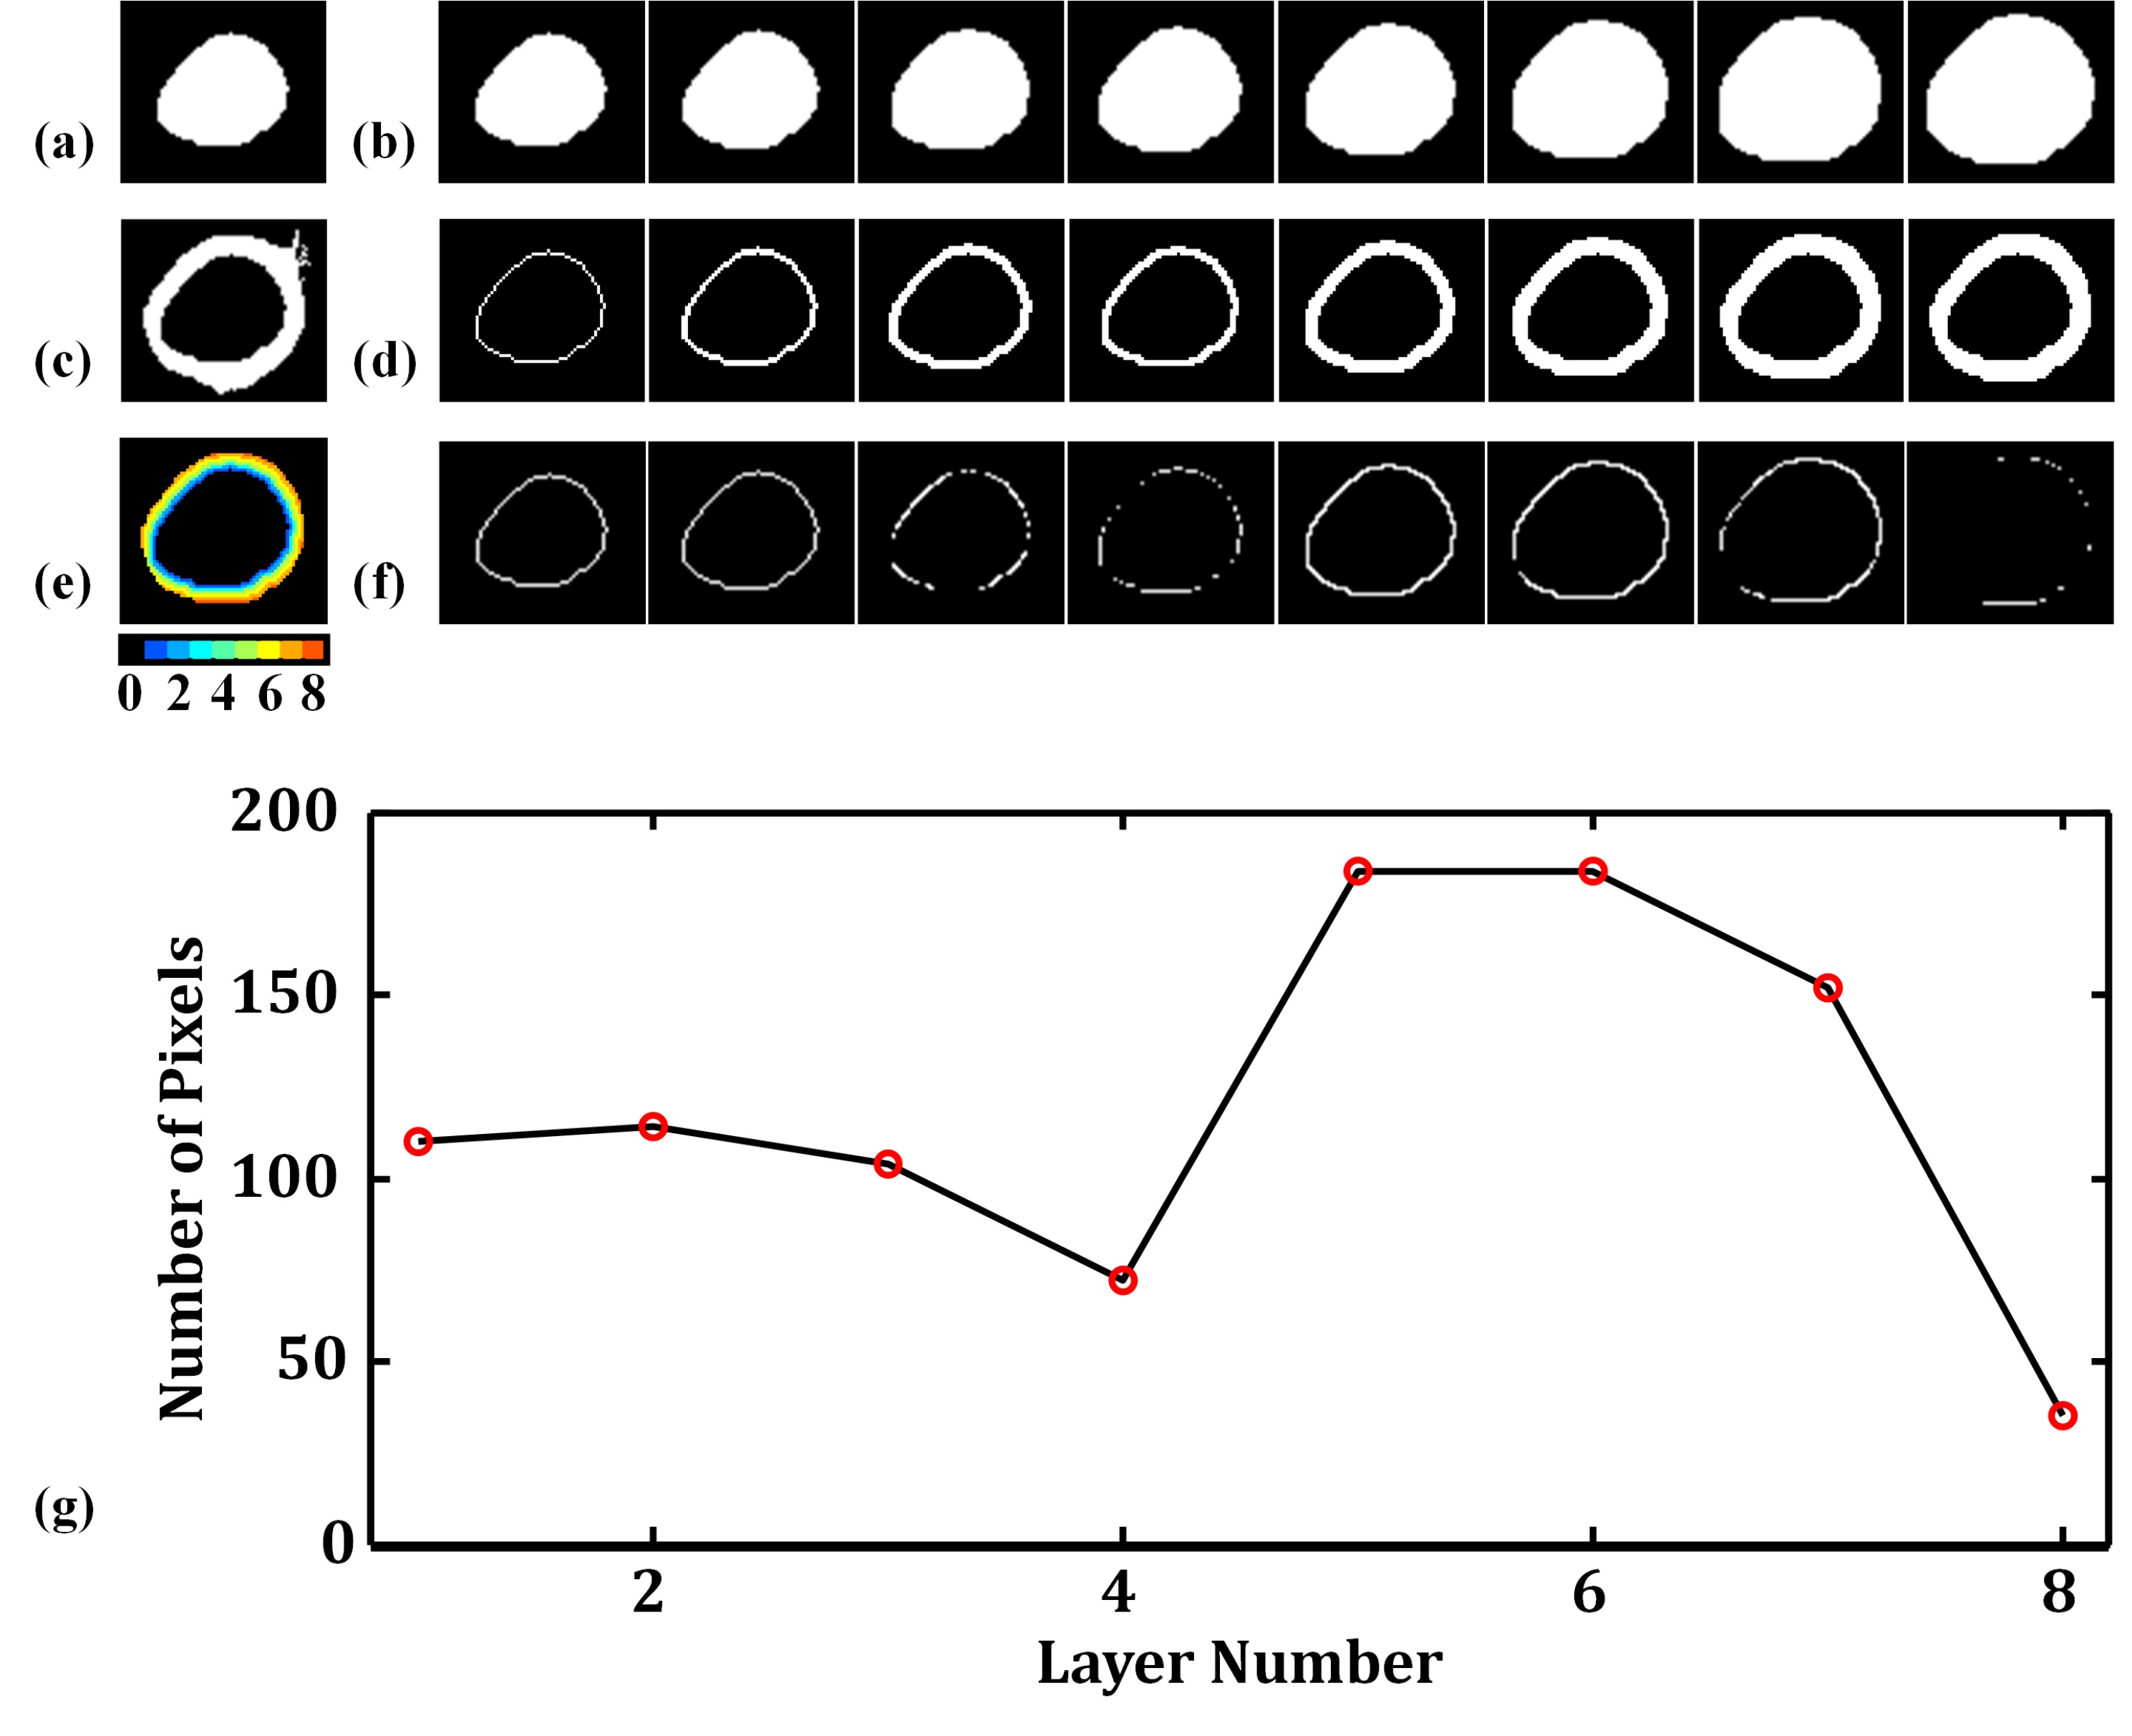
Ten healthy subjects underwent the study with a 3.0 Tesla scanner (Siemens, Tim Trio) after providing informed consent. Three short-axis slices (basal, mid-cavity and apical) were acquired by using a MOLLI protocol3,4 with parameters: TR/TE: 2.72/1.3 ms, matrix size: 256 × 208, slice thickness: 8 mm. For the LV segmentation, we applied pixel-by-pixel fitting on the MOLLI images to estimate the T1 model and then synthesized images corresponding to 86 inversion-recovery times (0:50:4250 ms)5. For each pixel, we obtained the null point of the T1 recovery curve and created a fat-liver mask (null point < 0.7 s). The procedure removed the pixels of fat and liver tissues from the 86th image and used the Otsu algorithm plus morphological processing to identify a heart ROI (Fig. 1a). The procedure then identified a synthesized image with minimum signal intensities of the blood pool region, removed fat and liver pixels and applied Otsu thresholding plus morphological processing (Fig. 1b) to generate an LV blood-pool mask (LVb) and an LV-walls mask (LVw-M1). We employed dilations on LVb and calculated the interaction of the dilated mask and LVw-M1 to create layers of myocardium. An LVw-M2 mask was obtained by repeating the layer-growing procedure (Fig. 1c). Finally, we used the heart ROI, LVb, and LVw masks to generate a right ventricle (RV) mask. The next step is the myocardial segmentation which distributes LVw into AHA segments according to radial lines projected from the centroid of LVb (Fig. 2). The major task is to find the upper and lower boundary of septal walls. The corresponding projection angles were termed U-angle and L-angle, respectively. We generated 360 radial lines and calculated the number of pixels on the path of each line to plot a projection profile. The U-angle and the L-angle were obtained by identifying the edges of the projection profile (Fig. 2b). We used the angles to obtain all the radial lines for the AHA segment model. To evaluate the performance of the LV segmentation method, we manually selected LVw on the MOLLI image as a reference standard and calculated overlap rates of the obtained LVw masks. For the accuracy of angles, we calculated the differences between the visually and automatically selected results.Results
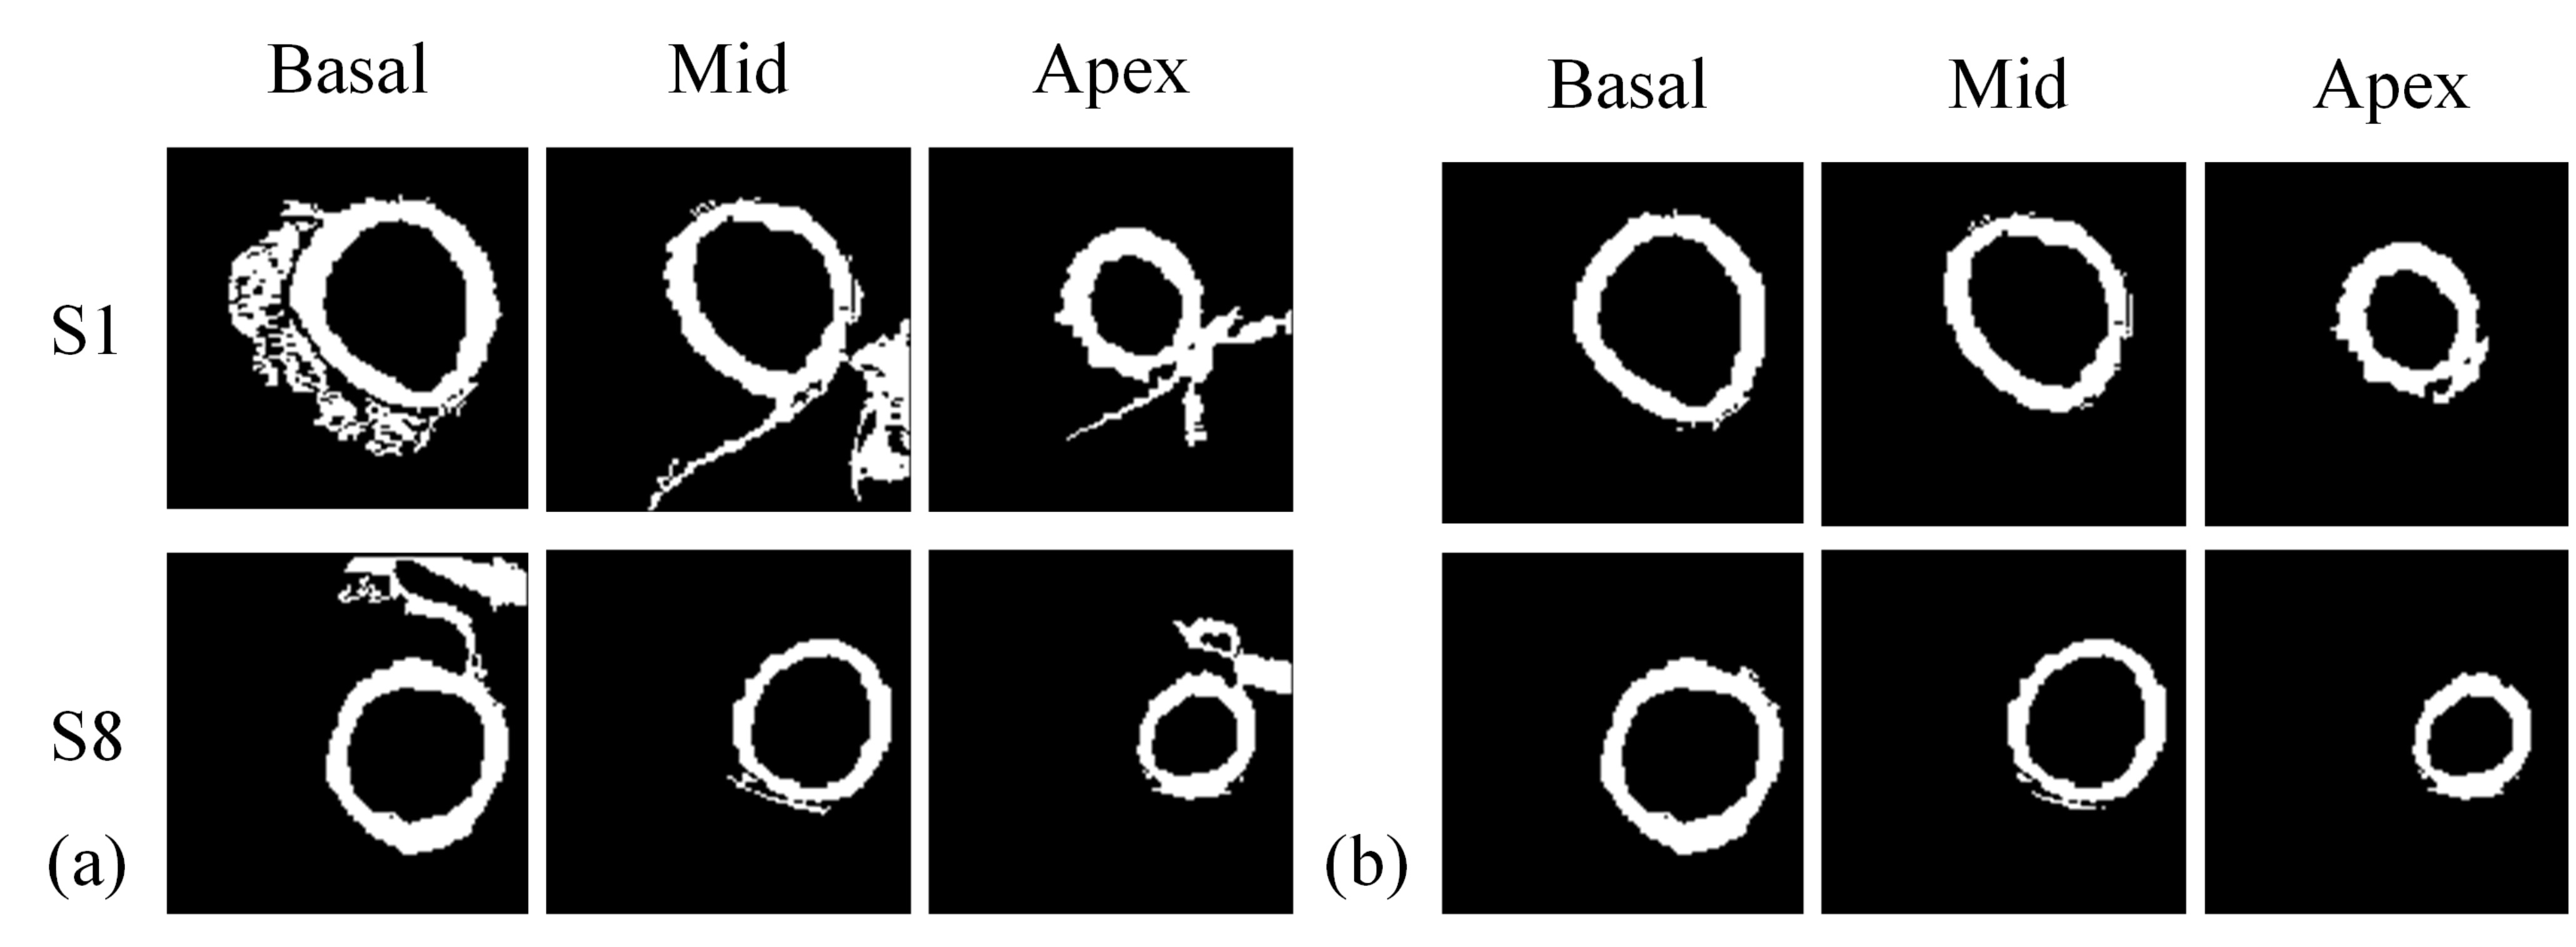
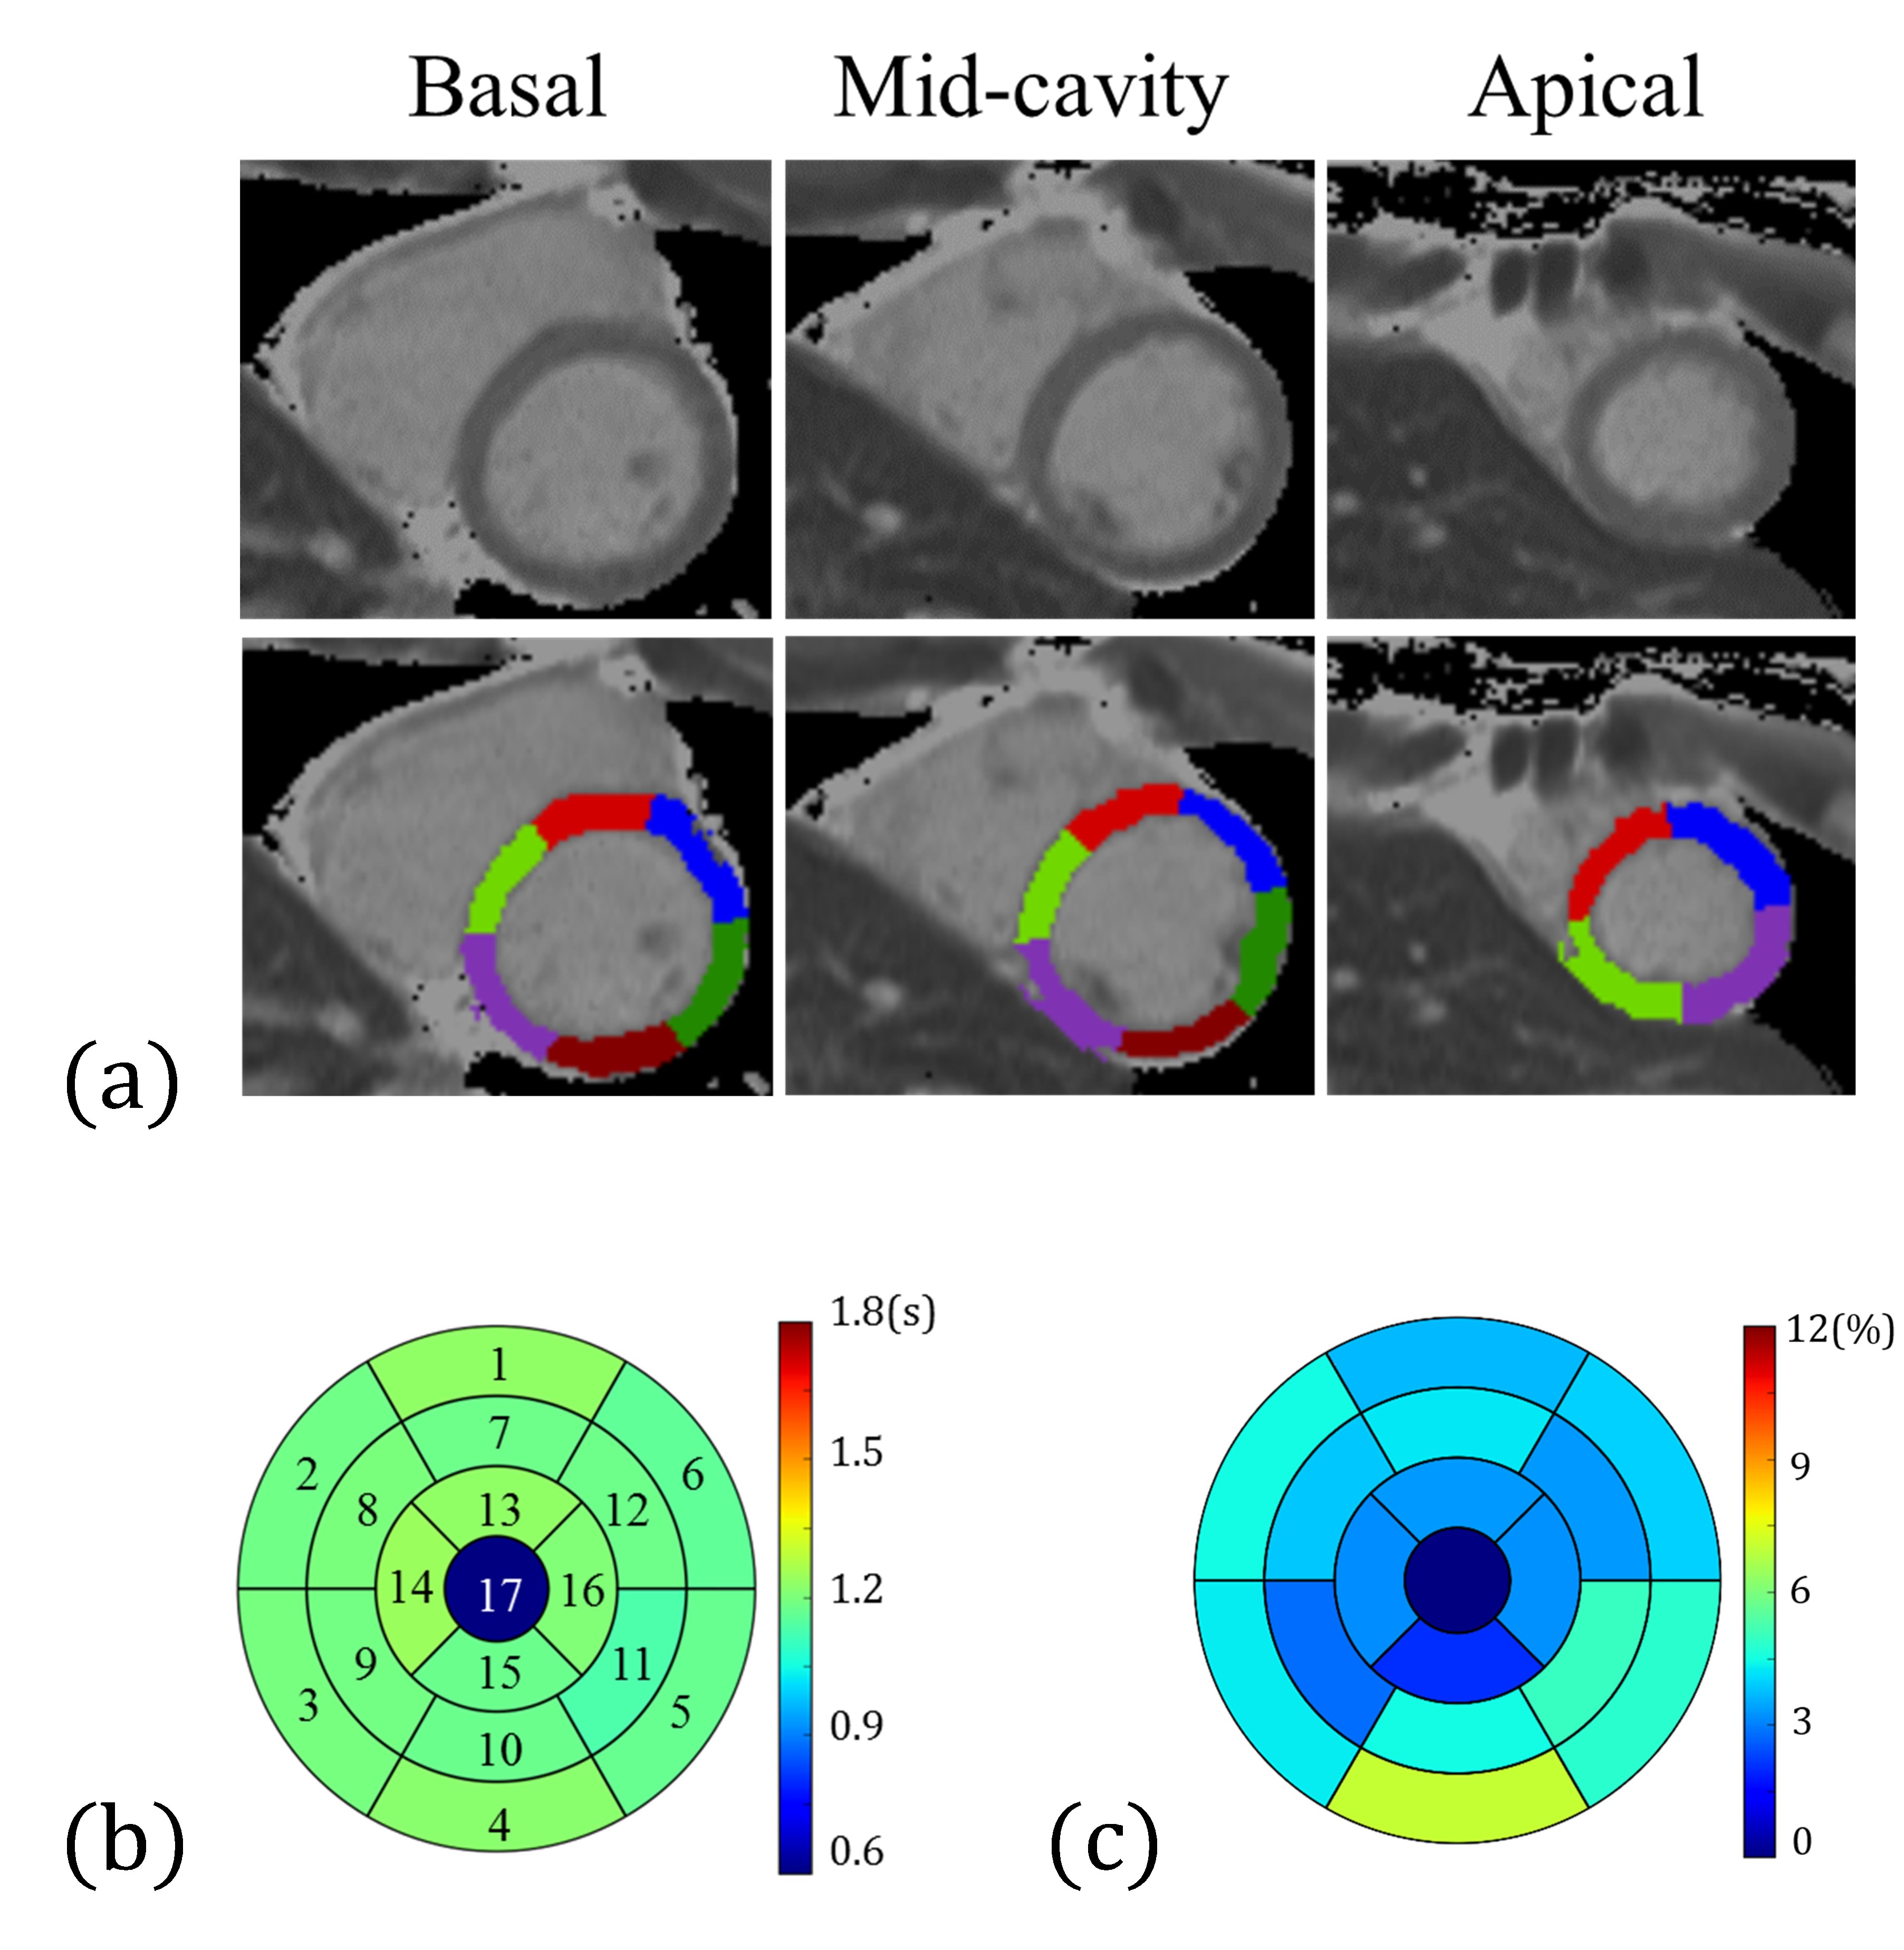
We demonstrated the results of the layer-growing method in Figure 3. Figure 4 displays examples of LVw-M1 and LVw-M2. Notice that the layer-growing method applied for LVw-M2 prominently remove the unwanted pixels from LVw-M1. Group analysis reveals that the overlap rates of LVw-M2 (basal: 73±9%, mid: 73±5%, apical: 71±3%) are higher (basal: p = 0.06, mid: p < 0.05, apical: p < 0.05, N = 10, paired t test) than those of the LVw-M1 (basal: 68±11%, mid: 65±9%, apical: 57±13%). Figures 5 (a,b) shows an example of the obtained 16 AHA segments (Fig. 5a) and the generated bullseye diagram (Fig. 5b). In comparison to manually selected angles, the average errors of the automatically identified angles are (U-angle; basal: 5.5±4.6, mid: 4.7±5.3, apical: 8.1±4.4 degrees, L-angle; basal: 5.8±4.7, mid: 7.0±6.9, mid: 8.5±4.9 degrees). Figure 5c shows the average T1 differences between the manually and automatically calculated bullseye diagrams (N =10). Considering the T1 values obtained using manually ROI selections as reference standards, the average T1 error of the calculated segments is 4.22±1.2% (N = 16 segments × 10 subjects = 160).
Discussion and Conclusions
The image contrasts of the LV boundaries play a major role for LV segmentations. We used the image synthesis method and the layer-growing method to achieve considerably higher overlap rates of LVw ROIs. We further used RV and the LVb centroid to radially parcellate LVw into AHA segments. The whole procedure allowed fully automatic analysis of three-slice short-axis MOLLI data sets. This method is potentially useful to investigate a large-scale image database. The limitation of this study is that images were all acquired from normal volunteers. Appling this method on the MOLLI images acquired from patients merits further investigations. In conclusion, we developed the automatic segmentations of the LV walls and AHA regions that could greatly facilitate quantitative and regional analysis of myocardium.Acknowledgements
Supported by the Ministry of Science and Technology under grants 101-2320-B-011-003-MY3 and 104-2314-B-011-001-MY3References
[1] Manuel D. Cerqueira et al. Standardized Myocardial Segmentation and Nomenclature for Tomographic Imaging of the Heart, Circulation.2002; 105: 539-542 doi: 10.1161/hc0402.102975
[2] Messroghli, DR et al. Modified Look-Locker inversion recovery (MOLLI) for high-resolution T1 mapping of the heart. Magn Reson Med. 2004 Jul;52(1):141-6.
[3] Tsai, JM et al. Free-breathing MOLLI: application to myocardial T(1) mapping. Med Phys. 2012 Dec;39(12):7291-302. doi: 10.1118/1.4764915.
[4] Huang, HH, Automatic Short-Axis Left Ventricle Segmentation: Application to MOLLI Myocardium T1 Mapping, 2015, Master Thesis, National Taiwan University of Science and Technology
[5] Huang, CY, Fully automatic AHA-17 parcellation for myocardial T1 mapping in short-axis slices, , 2016, Master Thesis, National Taiwan University of Science and Technology
Figures