4759
MRI vessel slice tool visualization with an interactive 3-D displayCarson Anthony Hoffman1, Eric Schrauben1, and Oliver Wieben1,2
1Medical Physics, University of Wisconsin Madison, Madison, WI, United States, 2Radiology, University of Wisconsin Madison, Madison, WI, United States
Synopsis
The comprehensive information on vessel anatomy and hemodynamics presented by 4D Flow MRI can be difficult to visualize. We introduce a new viewing mode using a ‘slice tool’. The use of this display algorithm can provide benefits for scalar visualization by preserving spatial location and avoiding ambiguities in cases of overlapping vessels. This novel approach can thus offer an improved understanding of complex hemodynamics within the body when used in conjunction with previously existing visualization methods eg. MIP images, pathline, and streamline visualizations.
Purpose
4D Flow MRI can provide comprehensive information on vessel anatomy and hemodynamics. However, the visualization of time-resolved hemodynamics (velocity vector fields and scalars) over a large imaging volume in an intuitive and clinically useful form on a 2D display is challenging. The visualization of scalar properties, such as velocity magnitude, pressure difference, or kinetic energy have unique challenges. Often, algorithms such as maximum intensity projection (MIP) images are used to highlight the peak values (‘hot spots’) of such scalar quantities. However, the distribution of the scalar inside the vessels is lost with such a display and ambiguities can occur in the presence of vessel crossings in projections. Here we introduce a novel approach designed to visualize scalar properties within the vessels along each vessel path. The visualization scheme automatically ‘slices’ vessels open through a center line and displays the scalar parameter of interest. This allows for scalar parameters to be displayed inside vessels while maintaining the correct localization and distribution.Methods
Fig1. Summarizes the processing steps for the generation of ‘slice views’. 3D grayscale data are converted into a binary vessel data set through simple thresholding, leaving the anatomical vessel section of interest identified. The binary image set is used to create a 3D skeleton via 3D medial surface axis thinning algorithms. In the centerline method used, Euler characteristics and connectivity are preserved to guarantee the invariance of number of connected objects, cavities, and holes in the original shape.1 The spurs on the resulting 3D skeleton are removed until there is a single centerline present for each path. 2 For each point along the centerline, a tangent vector and the associated normal basis plane is calculated. Viewing vectors created from centerline points to the current camera location are projected onto the associated normal basis planes. Projected vectors are normalized and rotated along the basis plane by 90 degrees. Centerline points are shifted in the direction of the rotated projected vectors creating a single line for each centerline point. The resulting lines are connected to create a smooth plane located in the center of the vessel. The resulting 3D image scene can be interactively displayed (zoom, pan, rotate) with scalar information on the sliced vessel. This method was applied with in vivo cranial, cardiac, and hepatic scans with IRB approval and subject consent. All algorithm development, and visualization was completed using commercial software (MatLab R2015a).Results
Comparisons between MIP images and slice views are shown for a cranial case (Fig2). The zoomed MIP image in Fig2 presents vessel overlap errors (black arrow) and misleading velocity distributions (red arrow). The slice views 1 and,2 in Fig2 clearly show the existence of multiple vessels and correctly display the velocity distributions within them. Two viewing modes for the slice tool are shown in Fig3: in one mode, the displayed slice is calculated once and the visible section of that slice depends on the viewing angle. In a second mode, the orientation and contents of the sliced view is recalculated for each viewing angle. The application of the slice tool algorithm in different body locations including the cardiac, cranial, and hepatic vasculature can be seen in Fig4.Discussion
This new visualization method allows the viewer to explore scalar data profiles such as velocity, kinetic energy, or pressure gradients in the vasculature while preserving localization. Application of the slice tool throughout the body can be completed once vessel segmentation is accomplished. Fig2 show that the slice tool can omit MIP vessel overlap ambiguities which are common in complex vascular systems, e.g. cranial and hepatic vasculature. The ability to differentiate vessels in the slice view becomes more apparent when using an interactive 3D viewer. The slice view presents the ability to correctly display features such as asymmetric flow profiles within the cut plane while a MIP view is better suited to identify ‘hot spots’ in a volume, albeit with loss of spatial information in terms of depth.Conclusion
This work introduces a new visualization scheme for the display of scalars obtained from 4D velocity fields. We have shown that easy segmentation along with real time image updates for scalar data is achievable using this new visualization method. Future work will improve centerline connectivity to eliminate missing sections in areas of ambiguity. The application of this method could provide additional insight into 4D flow features when used with other visualization methods. We will investigate whether this additional visualization feature improves the diagnostic workflow and decision making of 4D Flow analysis in a clinical setting through GUI implementation.Acknowledgements
No acknowledgement found.References
1) T. C. Lee, et al CVGIP: Graphical Models and Image Processing 56.6 (1994): 462-478. 2) E. Schrauben, et al J Magn Reson Imaging. 2015 Nov;42(5):1458-64Figures
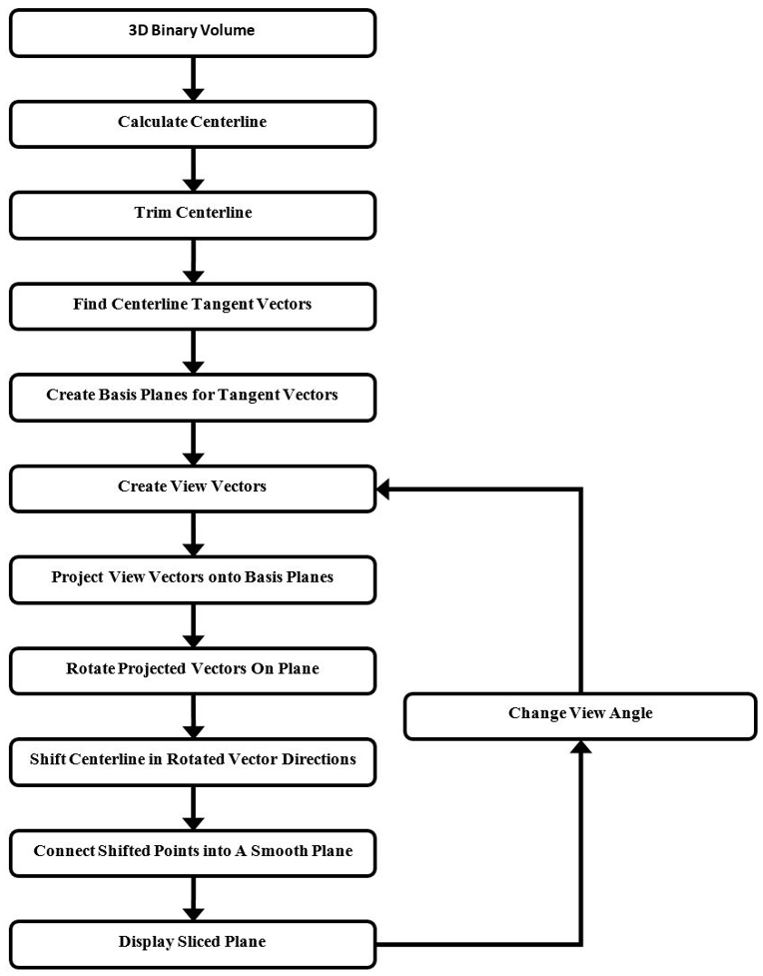
Figure 1: The Slice Tool algorithm starts with an input 3D binary
volume of vessels of interest obtained through simple thresholding. Once
centerline locations and basis normal planes are created an iterative slice
tool display can be utilized. The loop including the changed view angle is
initiated by the user.
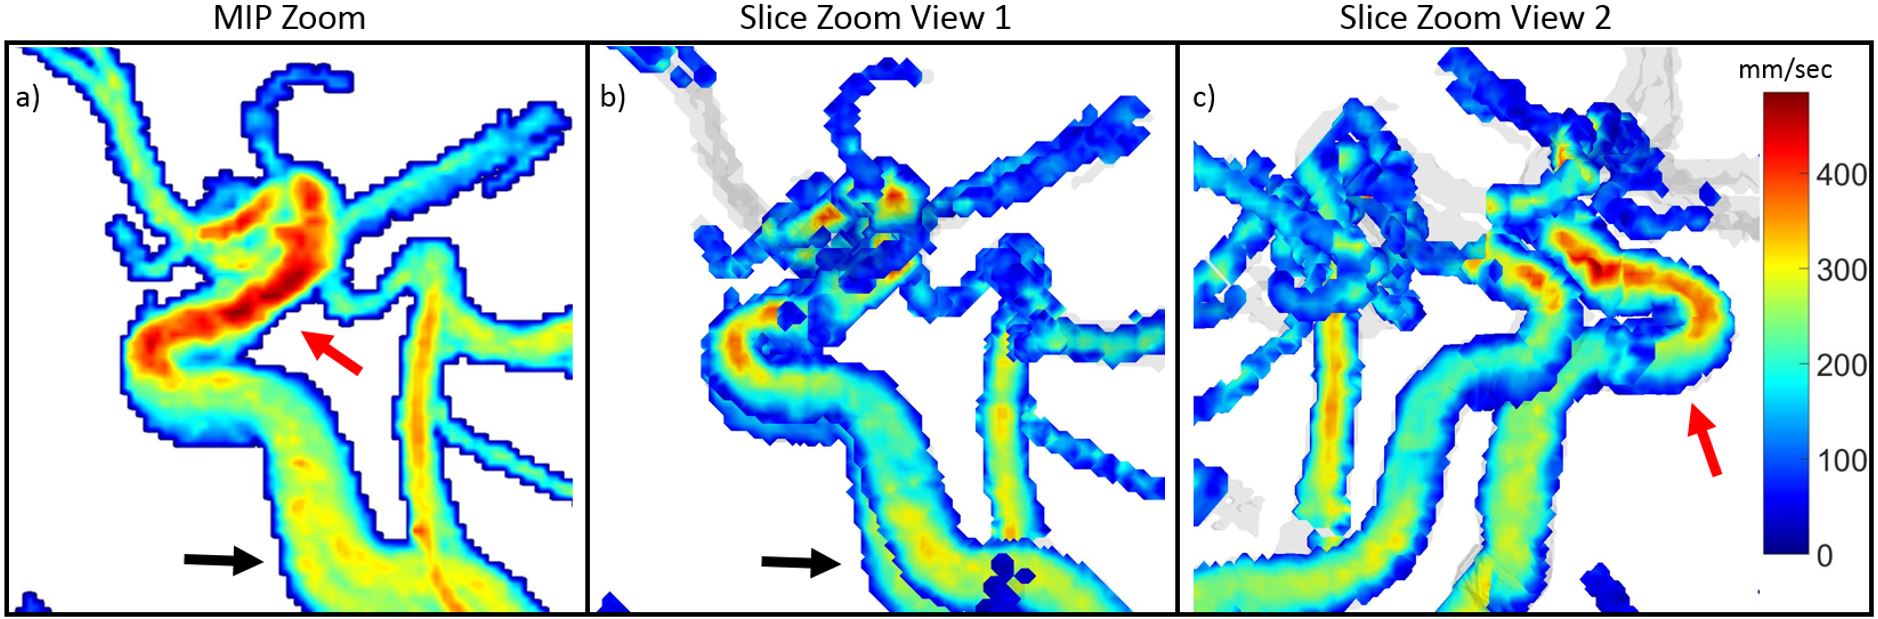
Figure 2: 4D Flow MRI scan of the carotid arteries: zoomed in
views of the velocity for identical viewing angles shown with traditional MIP
display (a) and the new slice tool (b). Notice the ambiguous display in (a)
where signal from overlapping vessels appears like on wider vessel (red + black
arrow). With the slice tool (b and c), the overlap regions are clearly
identified as such and the velocity distribution for the vessel at the cut
plane is displayed.
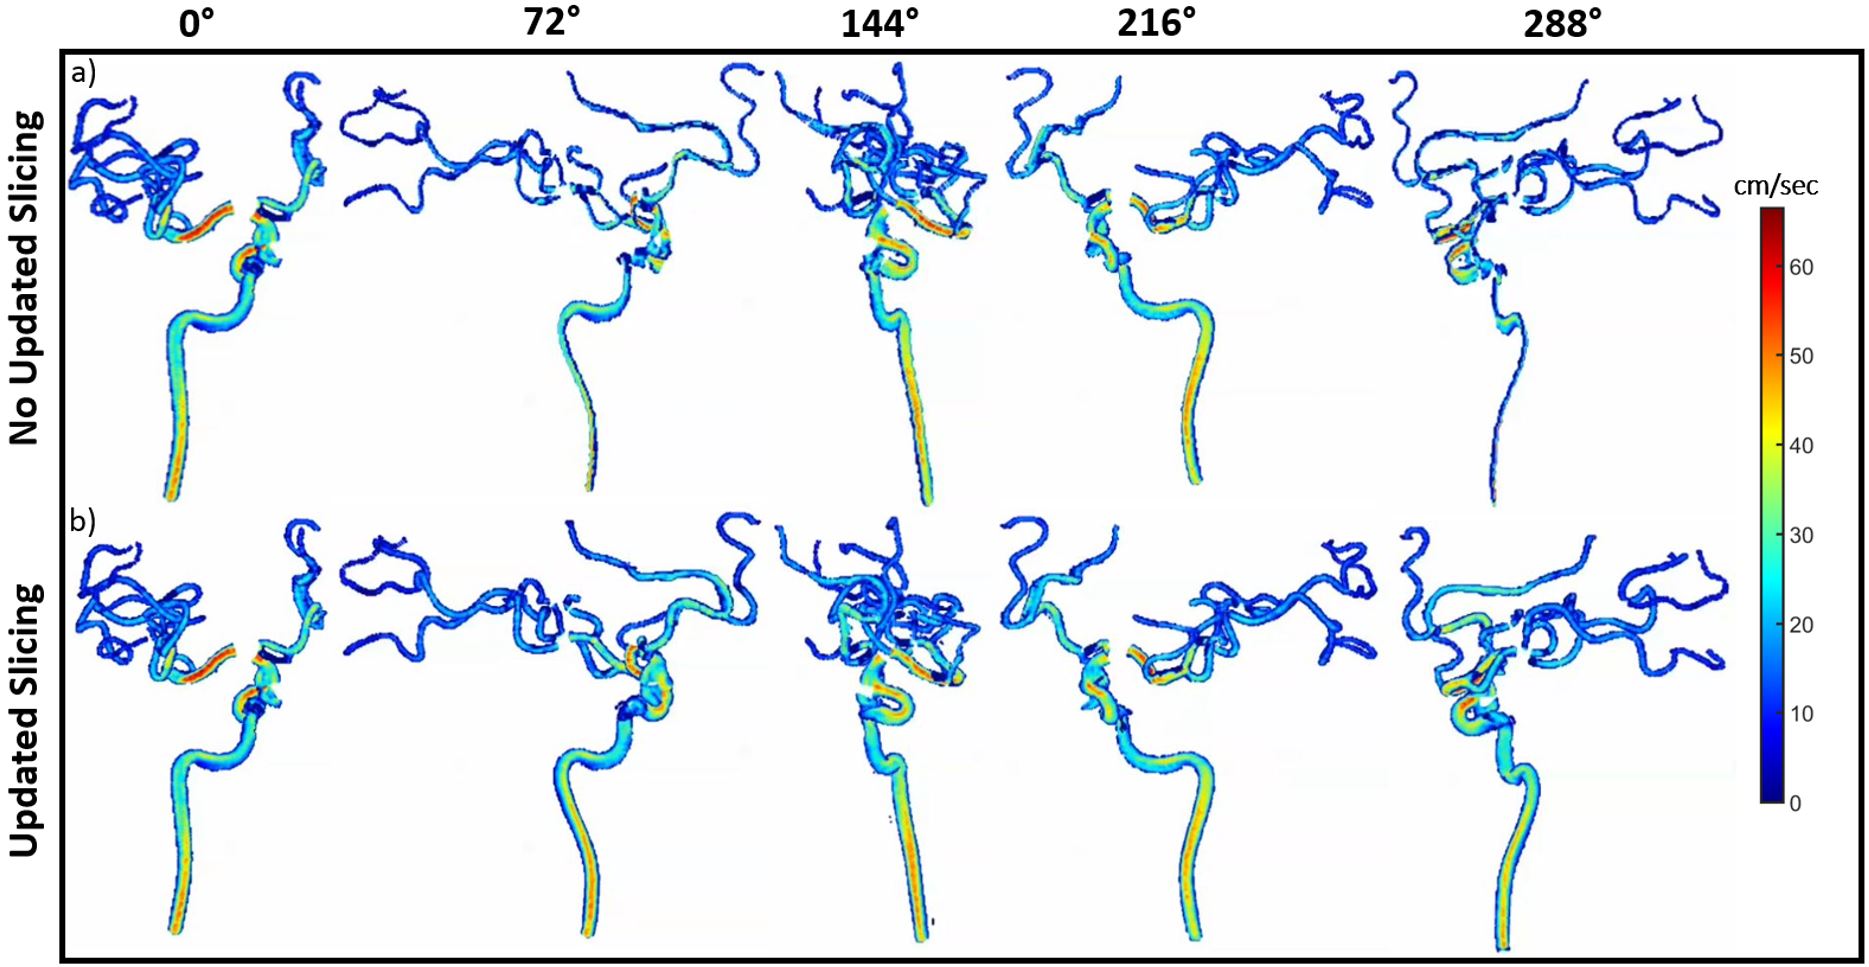
Figure 3: The slice tool applied to the right carotid arteries for
5 different view angles. The rotation is completed about the z axis. As the
rotation advances, the top row(a) shows a constant slicing angle, while the
bottom row (b) shows the updated slicing applied at each new view angle.
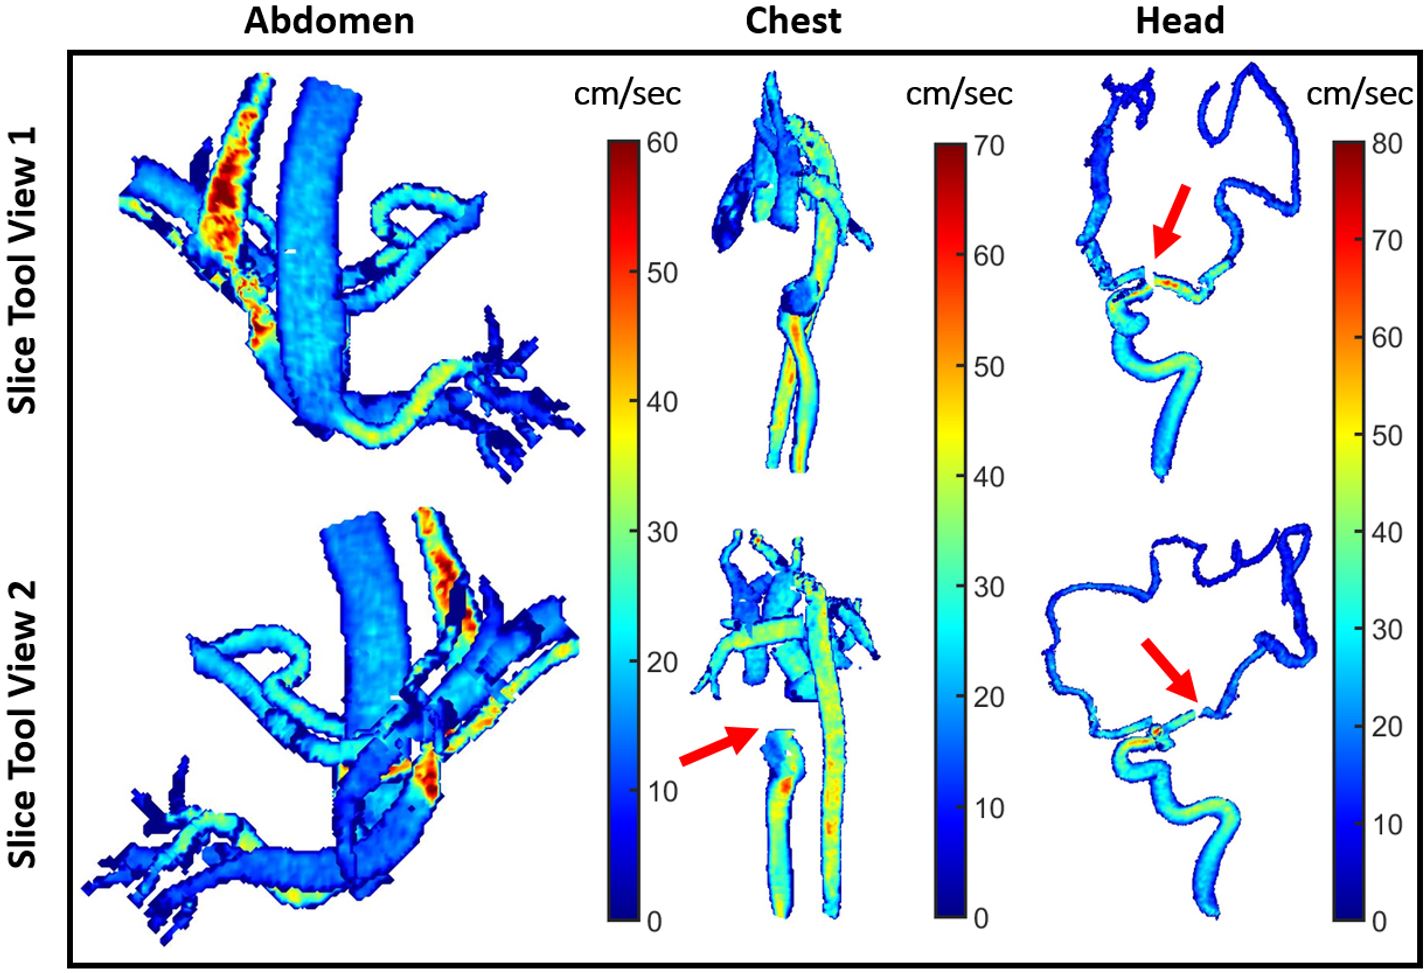
Figure 4: Application of the slice tool in different areas of the
body with complex vasculature. All scalar values presented in this figure are
from average velocity data sets. Some missing vessel sections (arrows) are due
to a current shortcoming in our centerline algorithm.