4757
Motion tracking in cardiac MRI: Cine Watermark tracking of myocardial strain1Department of Engineering Science, University of Oxford, Oxford, United Kingdom, 2Radiology and Imaging Sciences, National Institutes of Health, Bethesda, MD, United States, 3Sackler School of Graduate Biomedical Sciences, Tufts University School of Medicine, Boston, MA, United States, 4Auburn University MRI Research Center, Auburn University, Auburn, AL, United States
Synopsis
Quantification of regional cardiac function is of central importance in cardiology, but has yet to be adopted into clinical practice due to limitations of the current techniques. Here we present a method requiring minimal human intervention for tracking “cine watermark” images, in which features have been encoded into the phase image of a cardiac cine series. The method employs nonlinear least squares optimization, which allows the sum of squared wrapped phase differences between patches in successive frames to be minimized globally across all frames, while regularizing over physically-motivated metrics. Preliminary results in healthy human volunteers show robust tracking.
Purpose
Harmonic phase (HARP)1 analysis of tagged MR images is the standard of reference for regional cardiac functional analysis, but has not been adopted clinically due to the time consuming analysis. More recently, feature-tracking techniques have become available in commercial software packages.2 Although less arduous, feature tracking assesses only the endocardial and epicardial surfaces due to a lack of trackable features within the midwall, and have therefore been subject to the so-called “aperture problem.” Here, we present a feature tracking technique that overcomes the aperture problem by tracking midwall features encoded in phase images from a novel cardiac MRI sequence (Cine “Watermark” imaging), described separately.Methods
Image Acquisition:
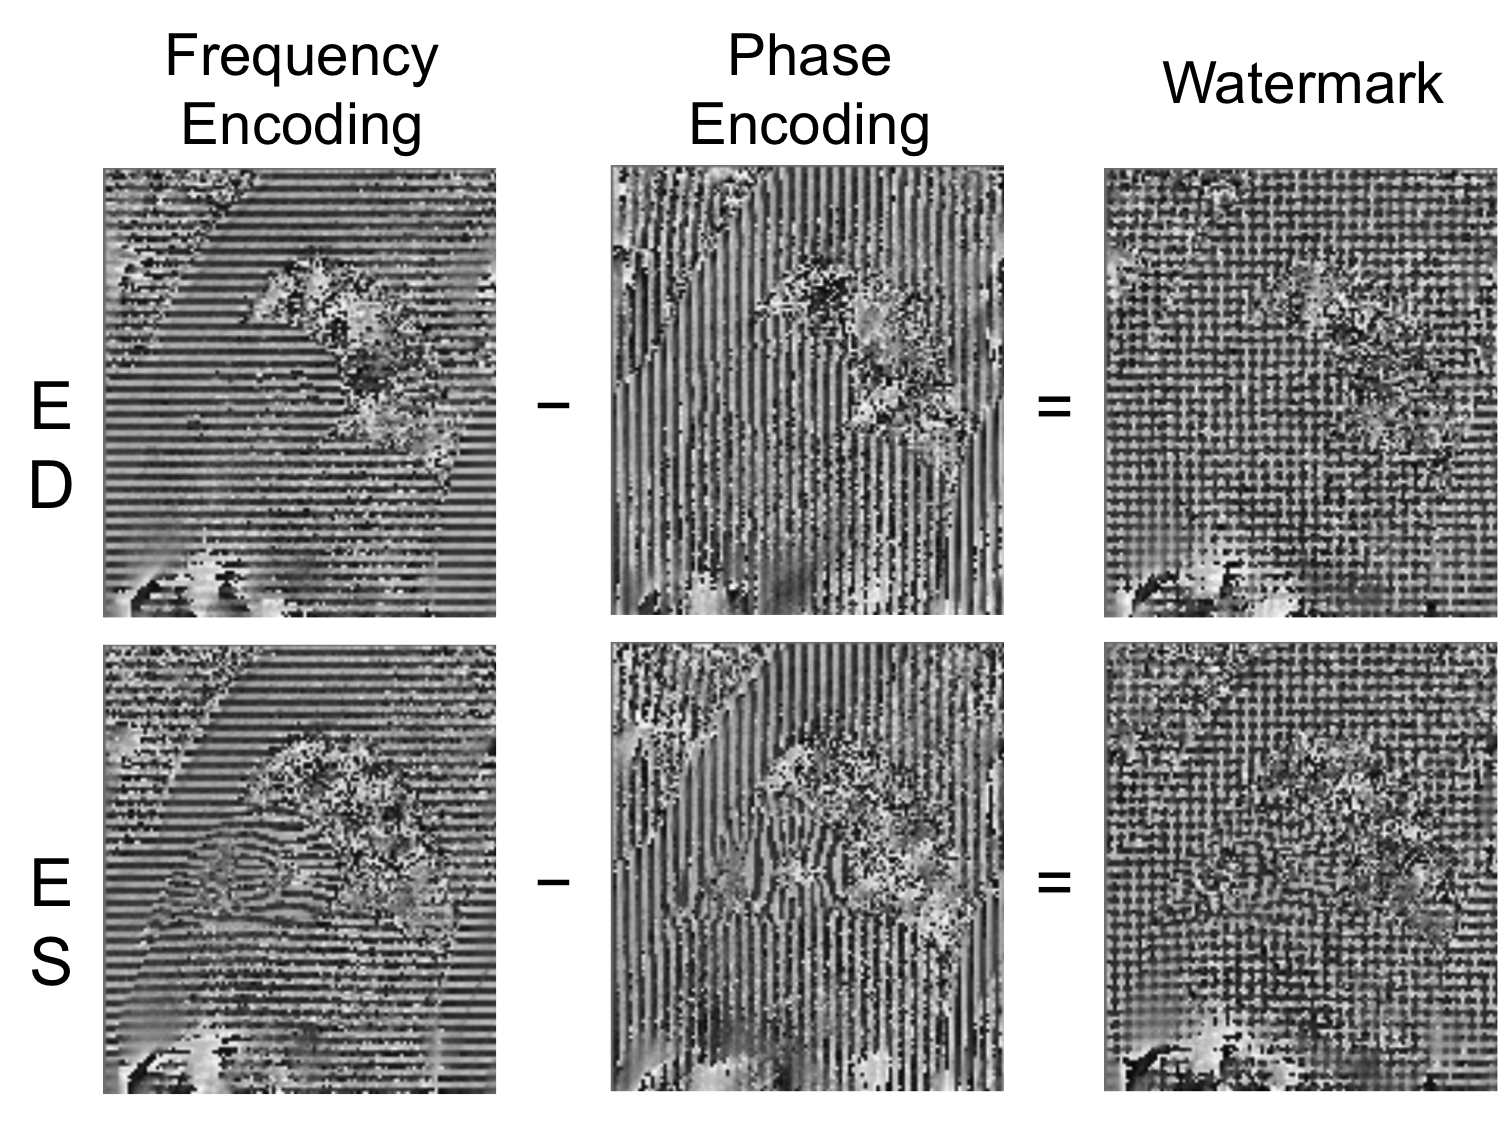
The acquisition of the phase images is described in detail in a separate submission. Briefly, complex-valued spatial modulation of magnetization (SPAMM)3 and complementary SPAMM (CSPAMM)4 images are acquired in the phase-encoding and frequency-encoding directions, along with a complex-valued gradient echo (GRE) reference image. Three contiguous short axis slices were acquired on a 3T Siemens Verio (Erlangen, Germany) with a 32-channel anterior/posterior cardiac coil (Invivo, Gainesville, FL) and GRAPPA5 acceleration (1.75mm in-plane resolution; 6mm slice thickness; 25 cine frames). The tagged images are first corrected by subtracting from the phase component that of the GRE image and shifting by π/2 to maximize SPAMM and CSPAMM phase contrast. Grid tags are then constructed in the phase image by subtracting each CSPAMM image from its corresponding SPAMM image, subtracting the frequency-encoding difference image from the phase-encoding difference image, and extracting the phase (Figure 1).
Endocardial Tracking:
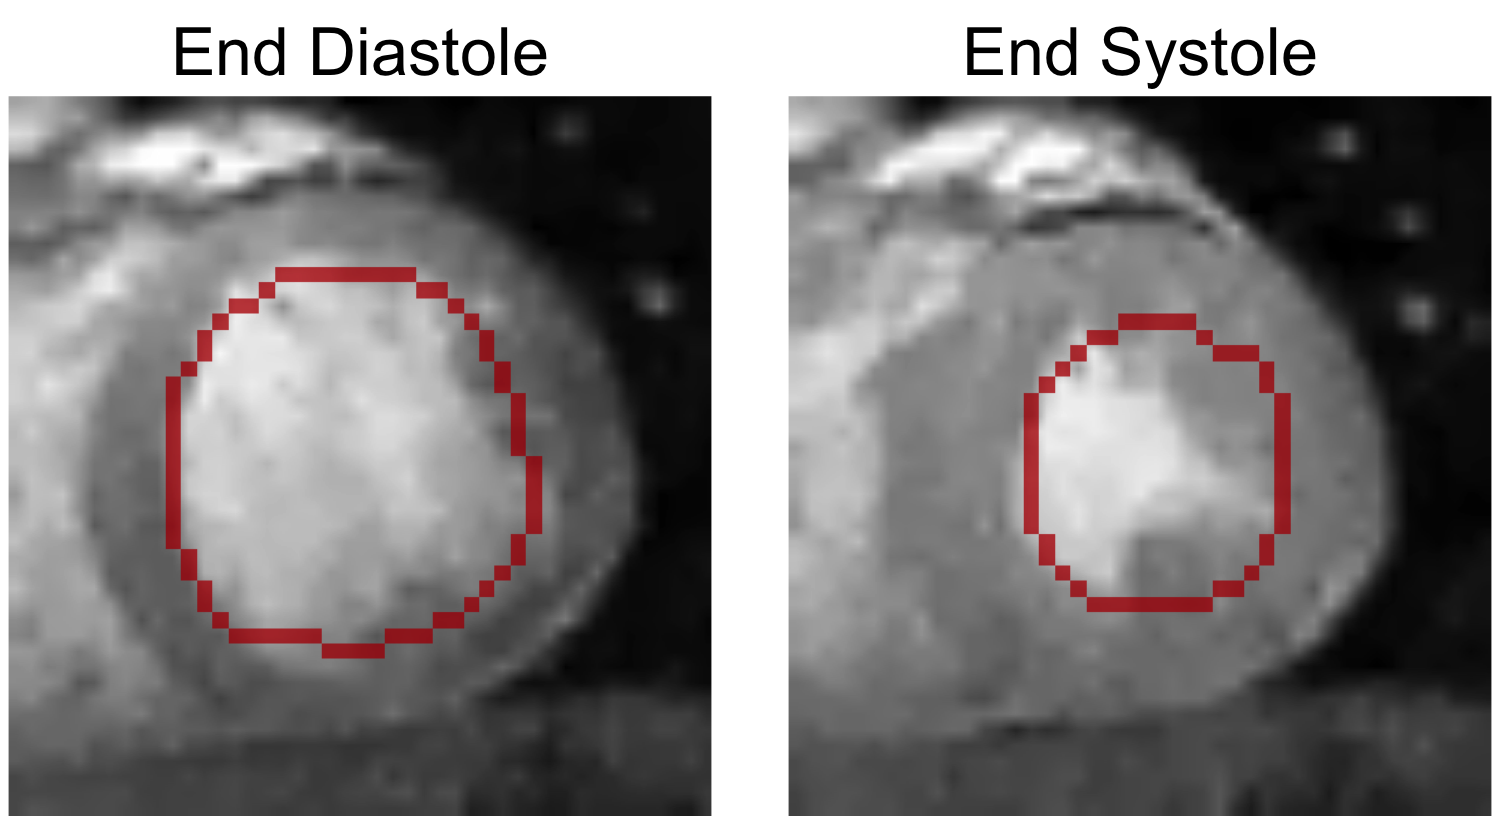
By taking the pixelwise maximum of the frequency-encoding and phase-encoding images, an image can be obtained with reasonable contrast between the myocardium and bloodpool. After masking the papillary muscles, the endocardium is detected by applying levelset segmentation to the stacked 2D+time volume (Figure 2). Non-linear least squares optimization using the Ceres Solver6 is then used to fit a quadratic basis-spline (b-spline) to the endocardium. The parameters to the optimization are the x- and y-positions of the b-spline control points. The primary cost function is the x- and y-distance components between points sampled on the b-spline contour and the nearest boundary candidate. Additionally, regularizers were added to penalize high spatial curvature and high temporal acceleration. The contour was displaced along the normal of the b-spline into the midwall of the myocardium to provide the initialization for tracking the phase data.
Midwall Tracking:
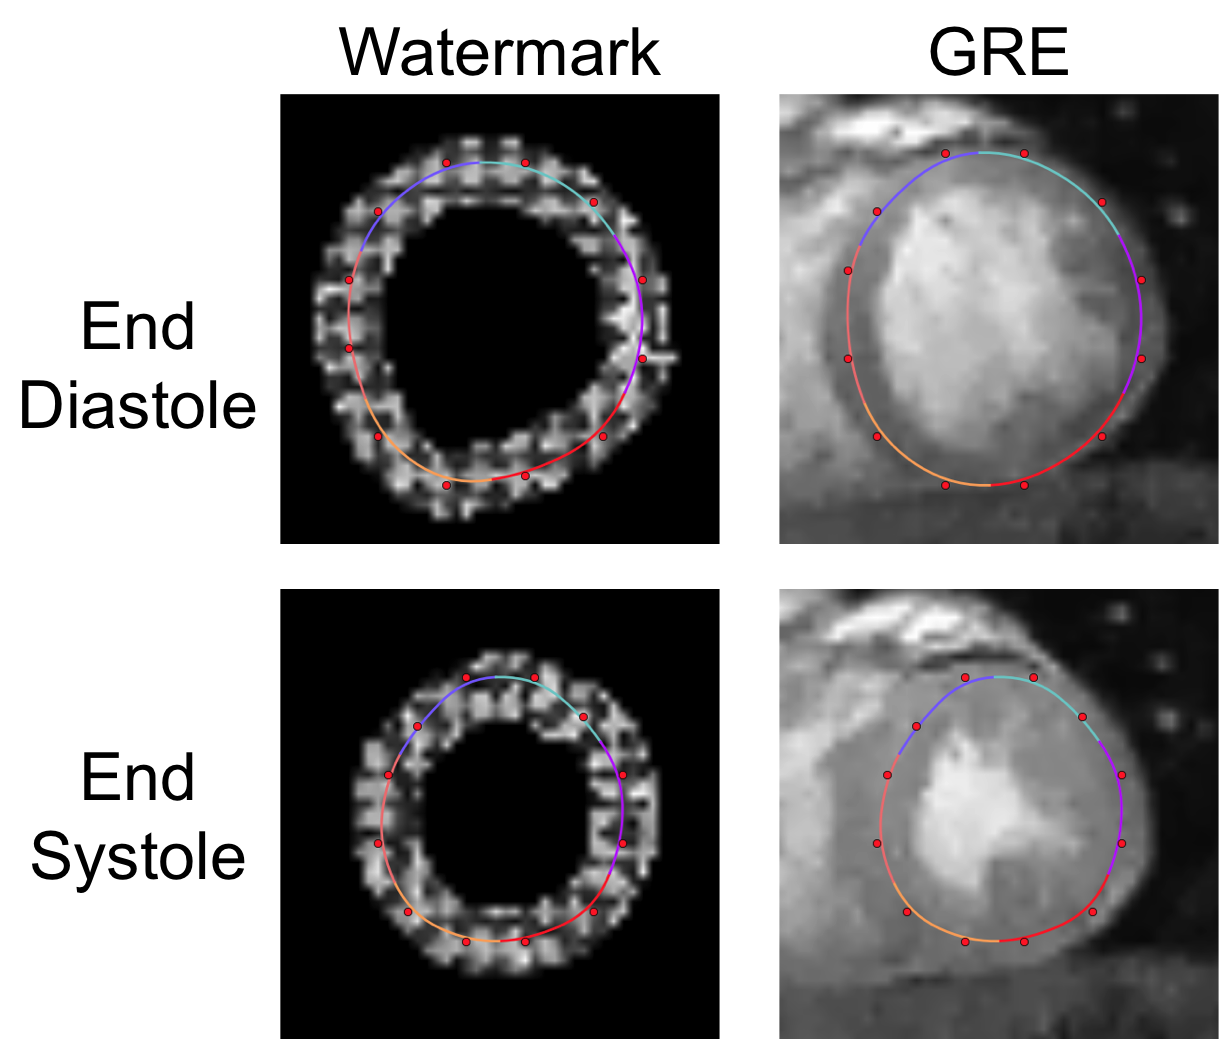
Having initialized the b-spline contour, non-linear least squares optimization was used to refine the placement based on the phase data (Figure 3). For each segment (defined by three adjacent control points), three square windows were centered on and oriented along the normal of the b-spline. Nine points (3x3) points were sampled from each window, and the wrapped phase difference between pairs of corresponding samples in adjacent frames was added to the optimization. As in the previous stage, high spatial curvature and temporal acceleration were penalized.
Results
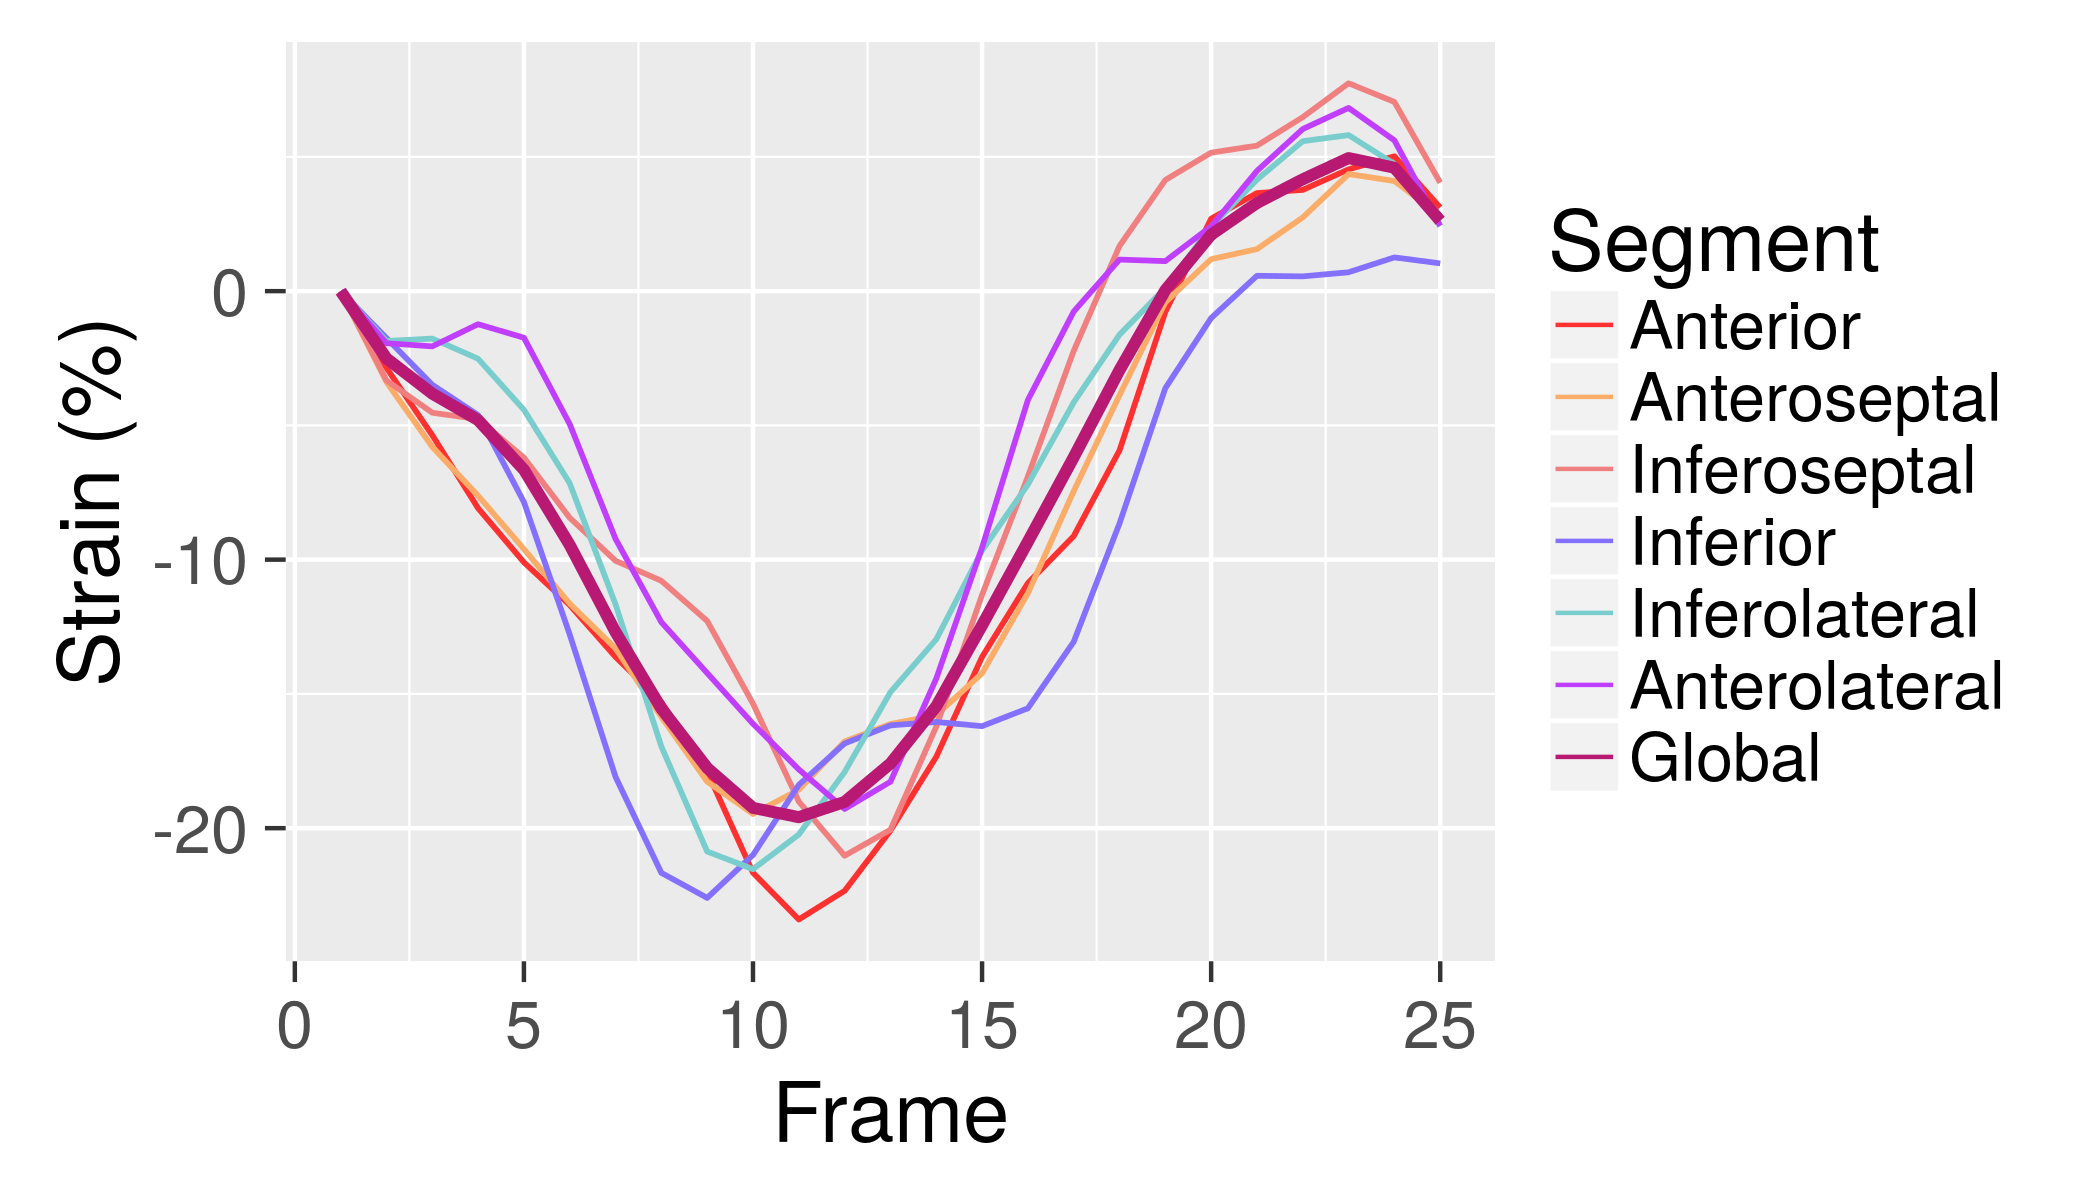
The image acquisition and analysis techniques were developed in parallel using simulation and phantom data, and then tested on three healthy human subjects (three slices per human subject, nine total). Aside from selecting the center of the heart and masking the papillary muscles, no user interaction was required. No manual adjustment of the contours was applied. Visually, both endocardial and midwall tracking were consistent and smooth. No major tracking errors were observed. Endocardial and midwall circumferential strain were calculated from the contours (Figure 4).Discussion
Despite nearly twenty years of research experience with cardiac tissue tagging, this technique has not been adopted clinically. Newer feature tracking techniques are subject to the aperture problem and cumulative track-to-last errors. The technique we describe here has a number of distinctive features. First, it makes heavy use of midwall features encoded in the phase image. Second, endocardial tracking is used to provide a robust initialization. Third, track-to-last errors are avoided by optimizing the problem globally over all cardiac phases at once. Finally, the flexible nature of nonlinear least-squares optimization allows for the problem to be regularized using physically-motivated measures such as spatial distortion and temporal acceleration.
We hypothesize that our results will improve both with higher spatial and temporal resolution. As these must be balanced with the constraints of scan time, the optimal balance between these two remains to be seen. Some limited work has been reported in the literature on balanced steady-state free precession (SSFP) contrast tagged images. In future work we hope to apply our technique to these images and measure improvement. Finally, our results must be validated against HARP in a larger dataset.
Acknowledgements
The first author would like to acknowledge funding and support from the NIH Oxford Scholars Program. The research received additional funding through the NIH Intramural Research Program.References
1. Osman, N. F., Kerwin, W. S., McVeigh, E. R. & Prince, J. L. Cardiac motion tracking using CINE harmonic phase (HARP) magnetic resonance imaging. Magn. Reson. Med. 42, 1048–60 (1999).
2. Pedrizzetti, G., Claus, P., Kilner, P. J. & Nagel, E. Principles of cardiovascular magnetic resonance feature tracking and echocardiographic speckle tracking for informed clinical use. J. Cardiovasc. Magn. Reson. 1–12 (2016). doi:10.1186/s12968-016-0269-7
3. Axel, L. & Dougherty, L. MR Imaging of Motion with Spatial Modulation of Magnetization. Radiology 171, 841–845 (1989).
4. Fischer, S. E., McKinnon, G. C., Maier, S. E. & Boesiger, P. Improved myocardial tagging contrast. Magn. Reson. Med. 30, 191–200 (1993).
5. Griswold, M. A. et al. Generalized Autocalibrating Partially Parallel Acquisitions (GRAPPA). Magn. Reson. Med. 47, 1202–1210 (2002).
6. Agarwal, S., Mierle, K. & Others. Ceres Solver.
Figures