4751
Accelerated Multi-UTE MRI for Direct Myelin Measurements at 7T1Department of Radiology and Biomedical Imaging, UCSF, San Francisco, CA, United States, 2Université Paris-Sud, France
Synopsis
Recent study demonstrated a multiple and ultrashort echo time (multi-UTE) MRI method for direct detection of methylene protons in myelin membranes on normal brains. However, such multi-UTE MRI requires prohibitively long scan time; therefore, acceleration method is needed. The objective of this study was to accelerate the multi-UTE imaging in order to reduce the scan time and enable such measurements routinely on our 7T human MRI.
Purpose
Myelin contains a sub-millisecond T2 component associated with methylene protons in myelin membranes 1,2 that can potentially provide direct imaging of myelin content for insights into the normal function of myelin as well as its pathological changes in white matter diseases. Current MRI techniques primarily detect protons in free water within and outside of axons. For example, myelin water MRI exploits the relatively short transverse relaxation (T2) of myelin water within the sheaths (10 ms < T2 < 50 ms 3). The sub-millisecond T2 component has a 3.4-ppm chemical shift from water and is only detectable using ultrashort echo time (UTE) techniques. Ex vivo studies showed that this myelin content had an ultrashort-T2 between 50 µs and 1 ms (4.7T). In vivo, several studies have observed an ultrashort-T2 component in white matter with T2* values of 600-900 µs (1.5T) 4 and 420 ± 80 µs (3T). 5 A recent study from our group demonstrated a multi-UTE method for direct imaging of this myelin component on normal brains in vivo. 6 A range of ultrashort echo times is necessary for quantifying the ultrashort-T2 myelin content as shown by the bi-exponential decay of the free induction decay (FID). 6 However, this multi-UTE method requires prohibitively long scan times; therefore, acceleration methods are needed. The objective of this study was to accelerate the multi-UTE MRI.Methods
Multi echo time UTE sequence and retrospective undersampling: A 3D UTE sequence with echo times from 24 to 3400 us was implemented for detecting sub-millisecond T2 components in myelin. An undersampled radial readout scheme, which randomly skipped projections in k-space as the undersampling strategy, was used for retrospective undersampling of multi-UTE acquisitions.
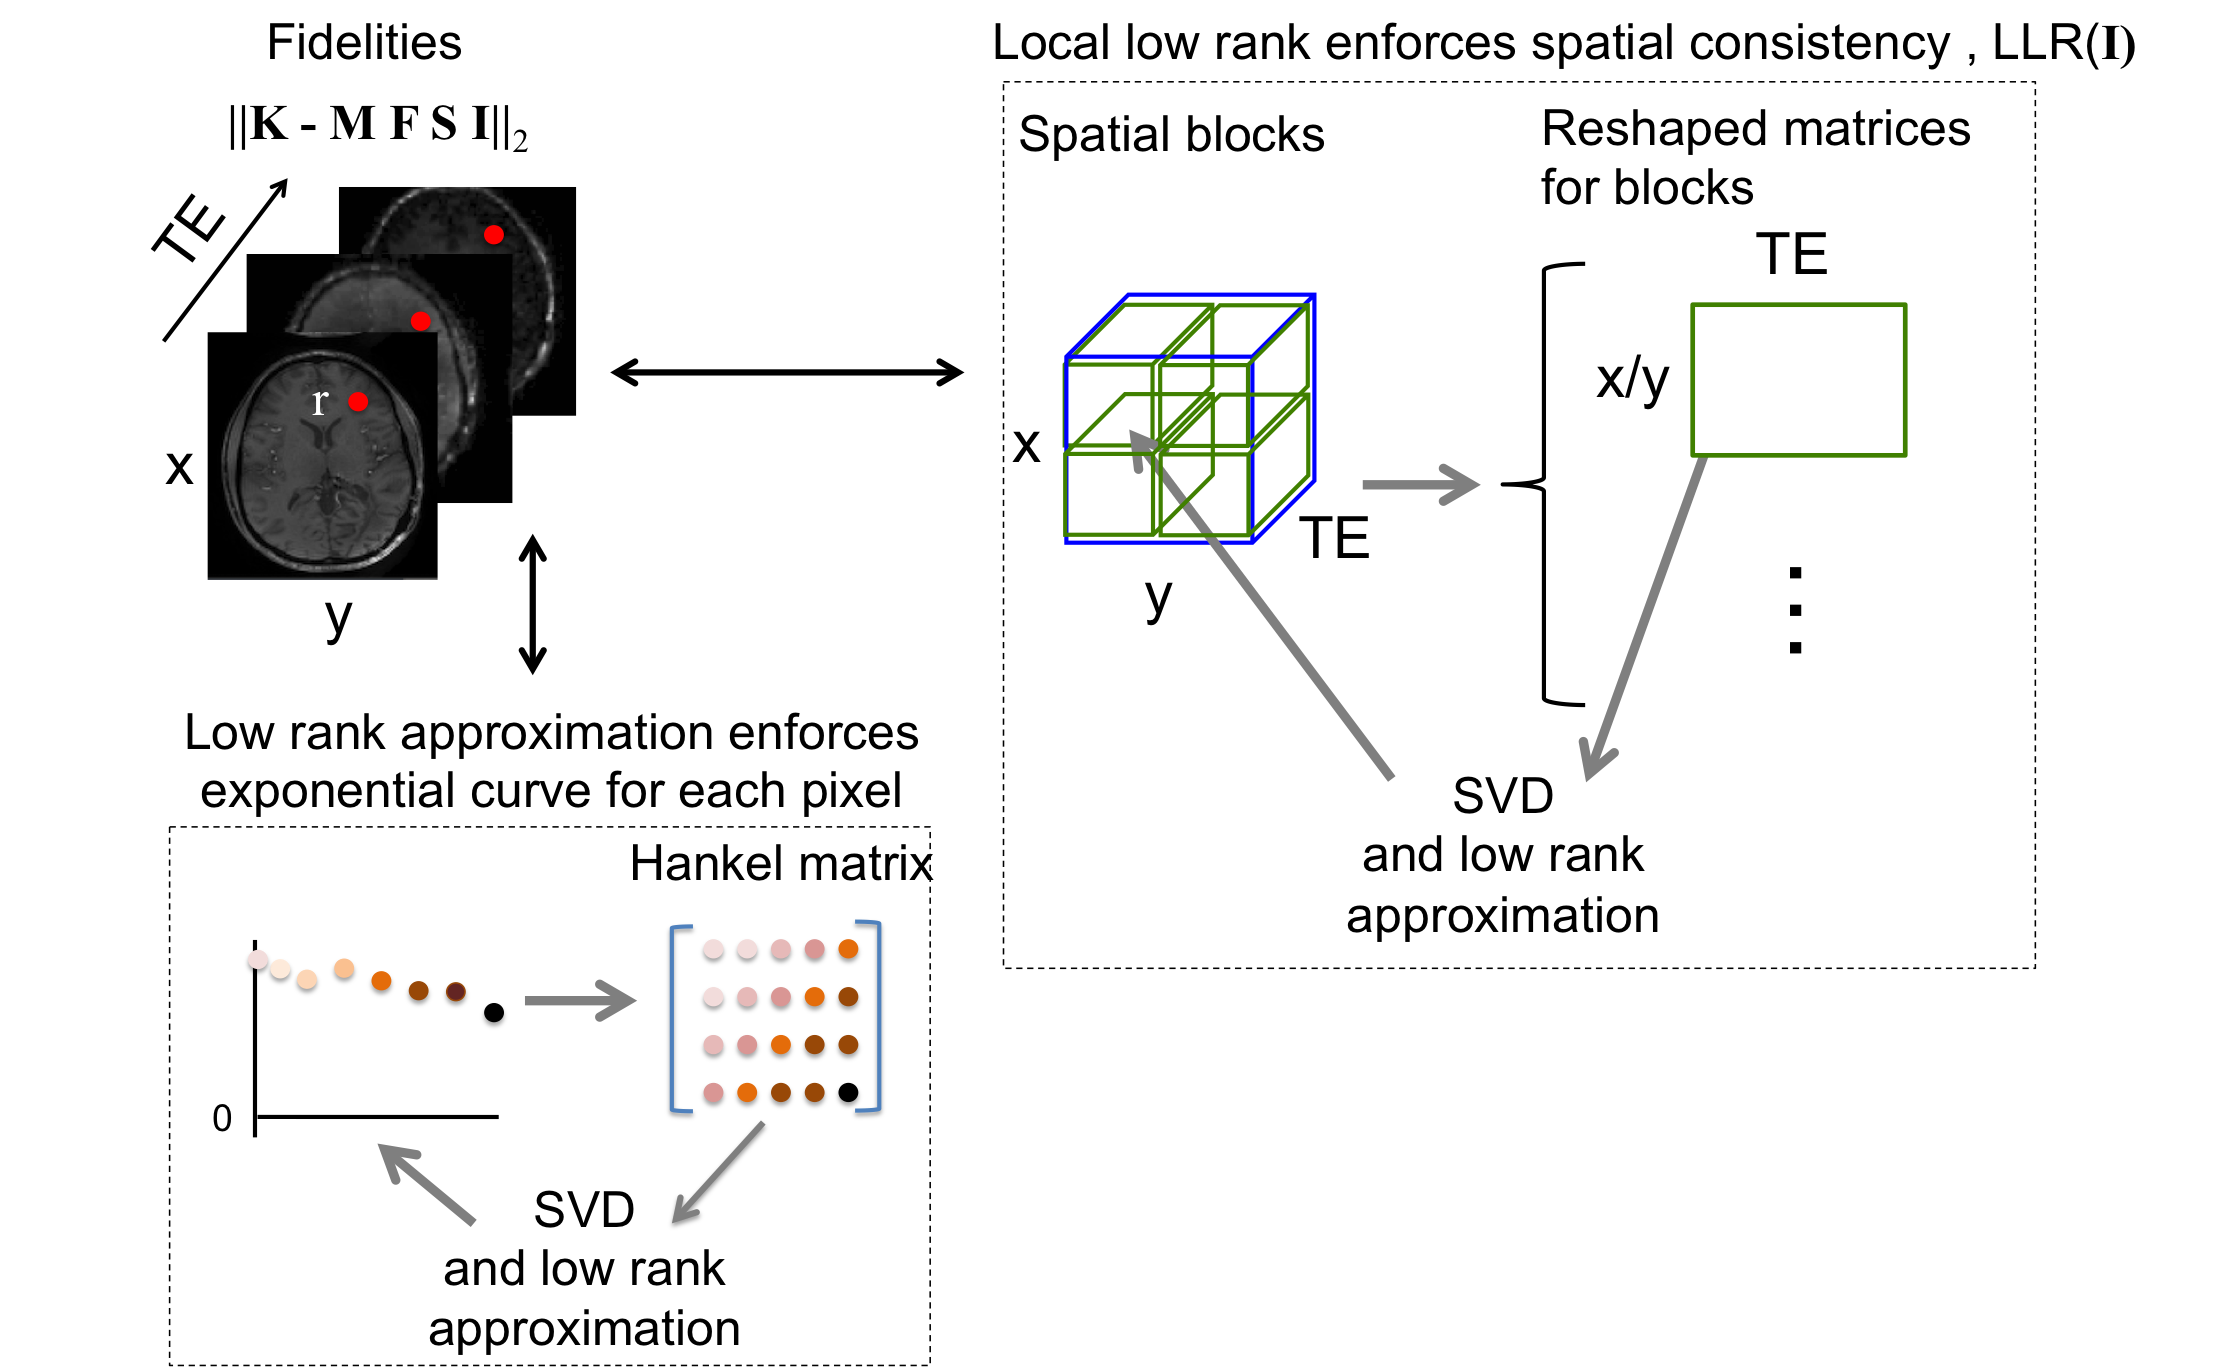
Pixel-wise low rank Hankel matrix reconstruction As illustrated in Figure 1, a Hankel matrix reconstruction for efficient exponential signal reconstruction was combined with compressed sensing and parallel imaging 7. The reconstruction problem in general can be written as $$\bf \min_{I}\parallel{MFSI-K}\parallel_2^2 +\lambda_1\sum_{r∈Ω}\parallel{H[I(r)]}\parallel_* + \lambda_2{LLR(I)} $$ Eq. 1
I and K are related by linear operators: sampling mask M, nonuniform Fourier transform operator F and coil sensitivity S. The cost function enforces the consistency/fidelity of the estimated image I with the acquired k-space K. λ1 and λ2 are regularization parameters, in association with the pixel-wise nuclear norm for the Hankel matrix, H[I(r)] (r∈Ω the set of all pixels) and local low rank LLR(I). 8,9 All the abovementioned regularizations were solved by the alternating direction method of multipliers algorithm, 10,11 using Berkeley MRI reconstruction toolbox (BART) software. 7
MRI protocol: Volunteer experiments were performed on a 7T whole-body MRI scanner (GE Healthcare, Waukesha, WI) with a 32-channel head coil (NOVA Medical). The fully sampled 3D UTE images were acquired with parameters: TEs from 0.024 to 3.4 ms, TR = 10 ms, bandwidth = 250 Hz, matrix size = 96×86×84, FOV = 210×189×185 mm3, 2.2 mm isotropic resolution, NEX = 1, FA = 10°, scan time = 52 minutes and baseline acceleration factor = 4.
Data analysis: The baseline image was reconstructed by the L2-ESPRIT. 7 FIDs from multi-UTE images were fitted to the following signal model to estimate the fractions S0,k, apparent transverse relaxation rates T2,1* and frequency shifts, Δfk:
$$S(TE)=∑_{k=1}^2 S_{0,k} exp{(\frac{-TE}{T_{2,k}^*}} ) exp({i2πΔf_k TE})$$ Eq. 2
We used a two compartment model based on our preliminary studies, including an ultrashort-T2 component, T2,1* < 0.5ms, with a 3.4 ppm shift and a long-T2 component, T2,2* > 5ms, with a negligible frequency shift representing myelin and free water.
Results
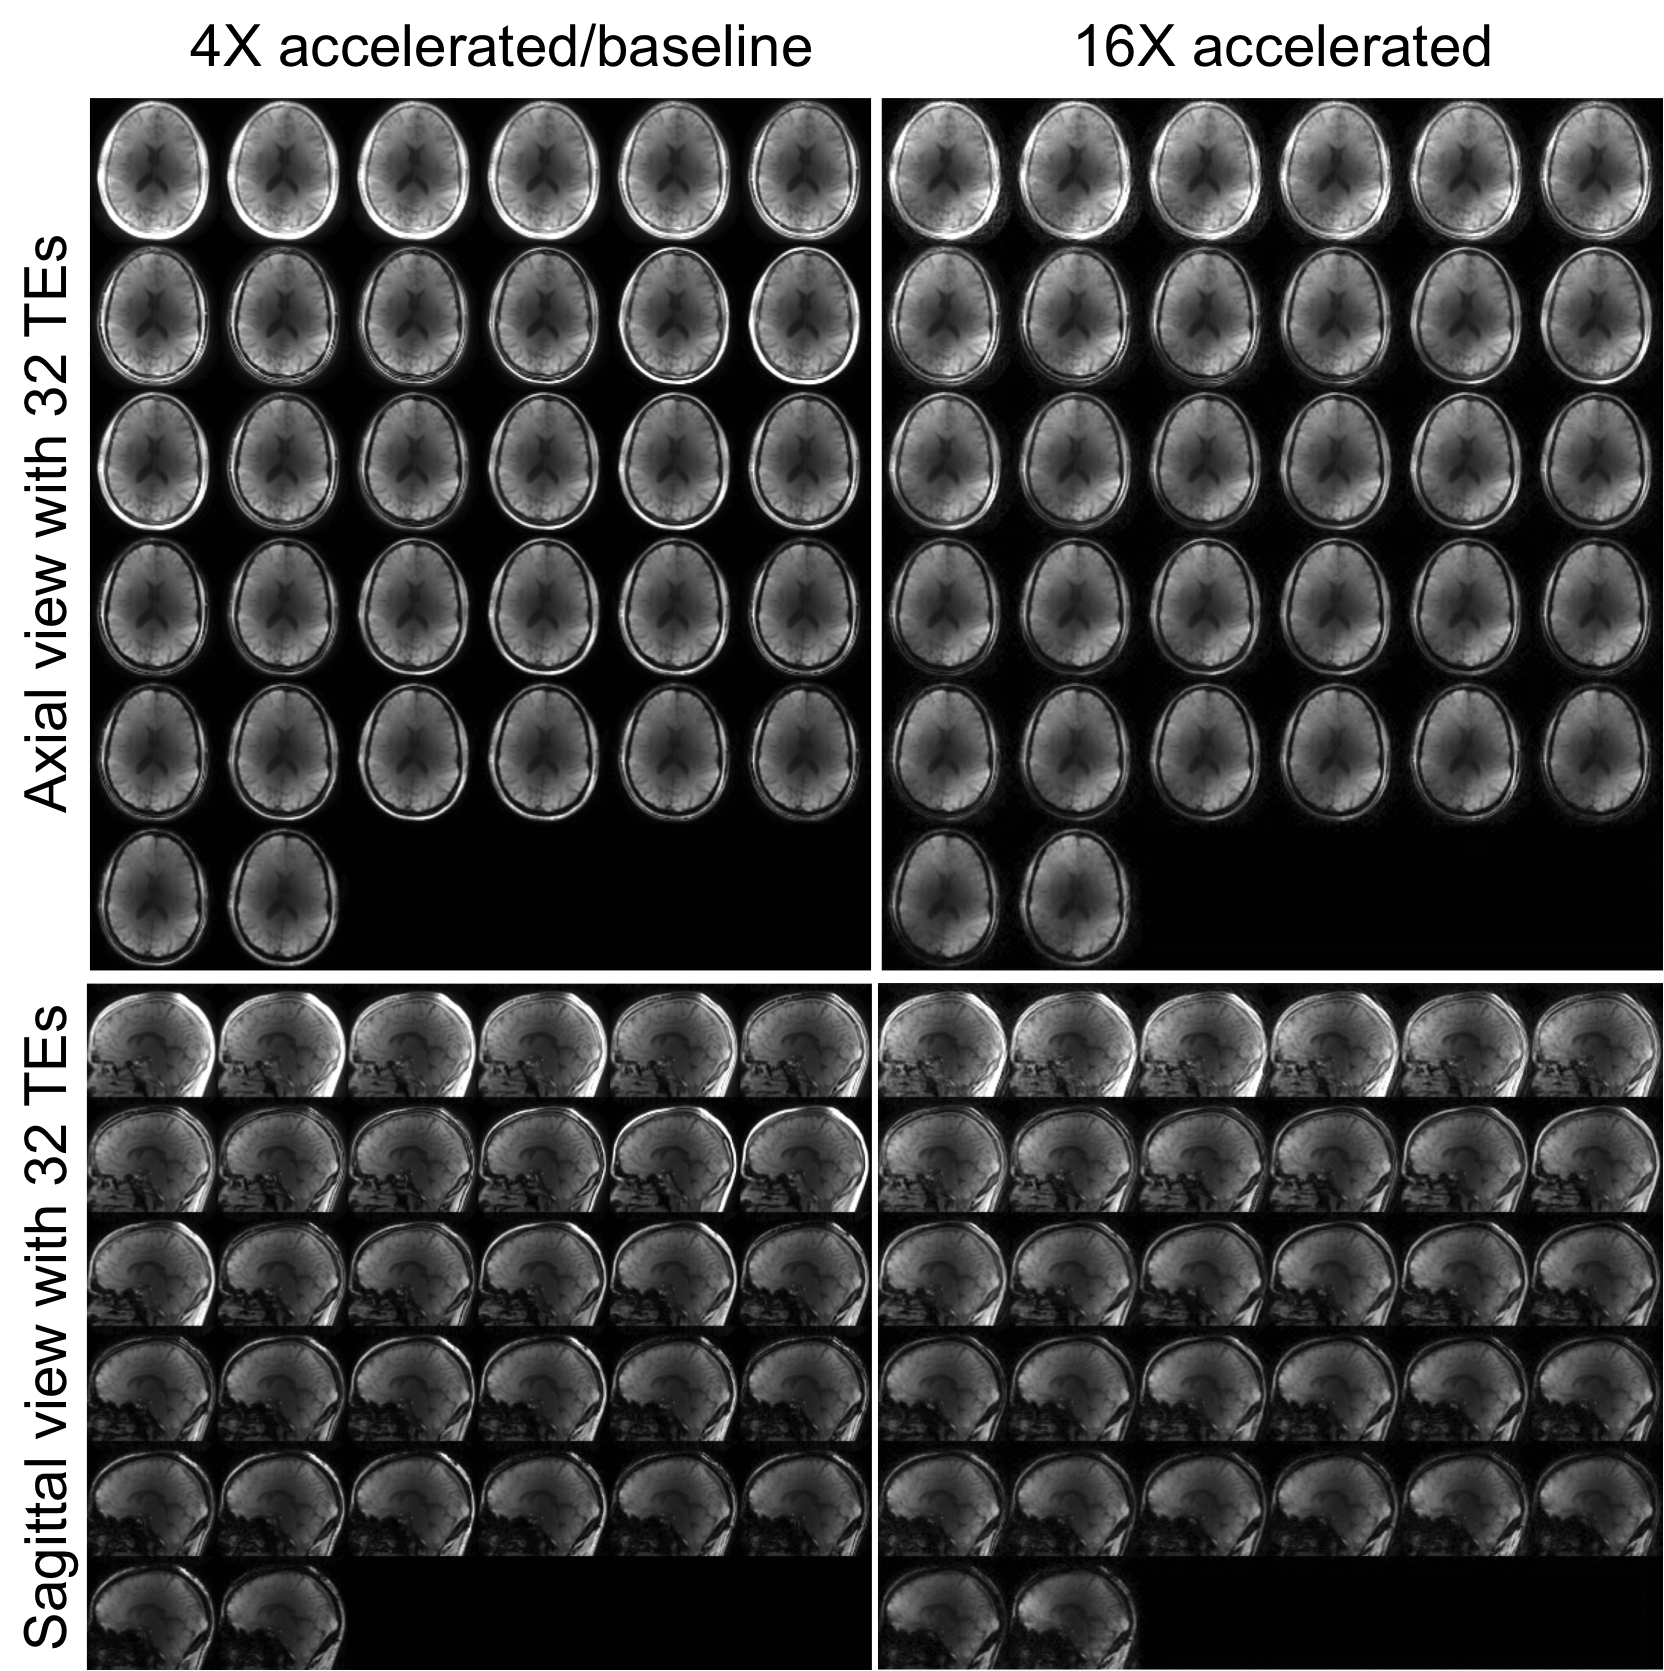
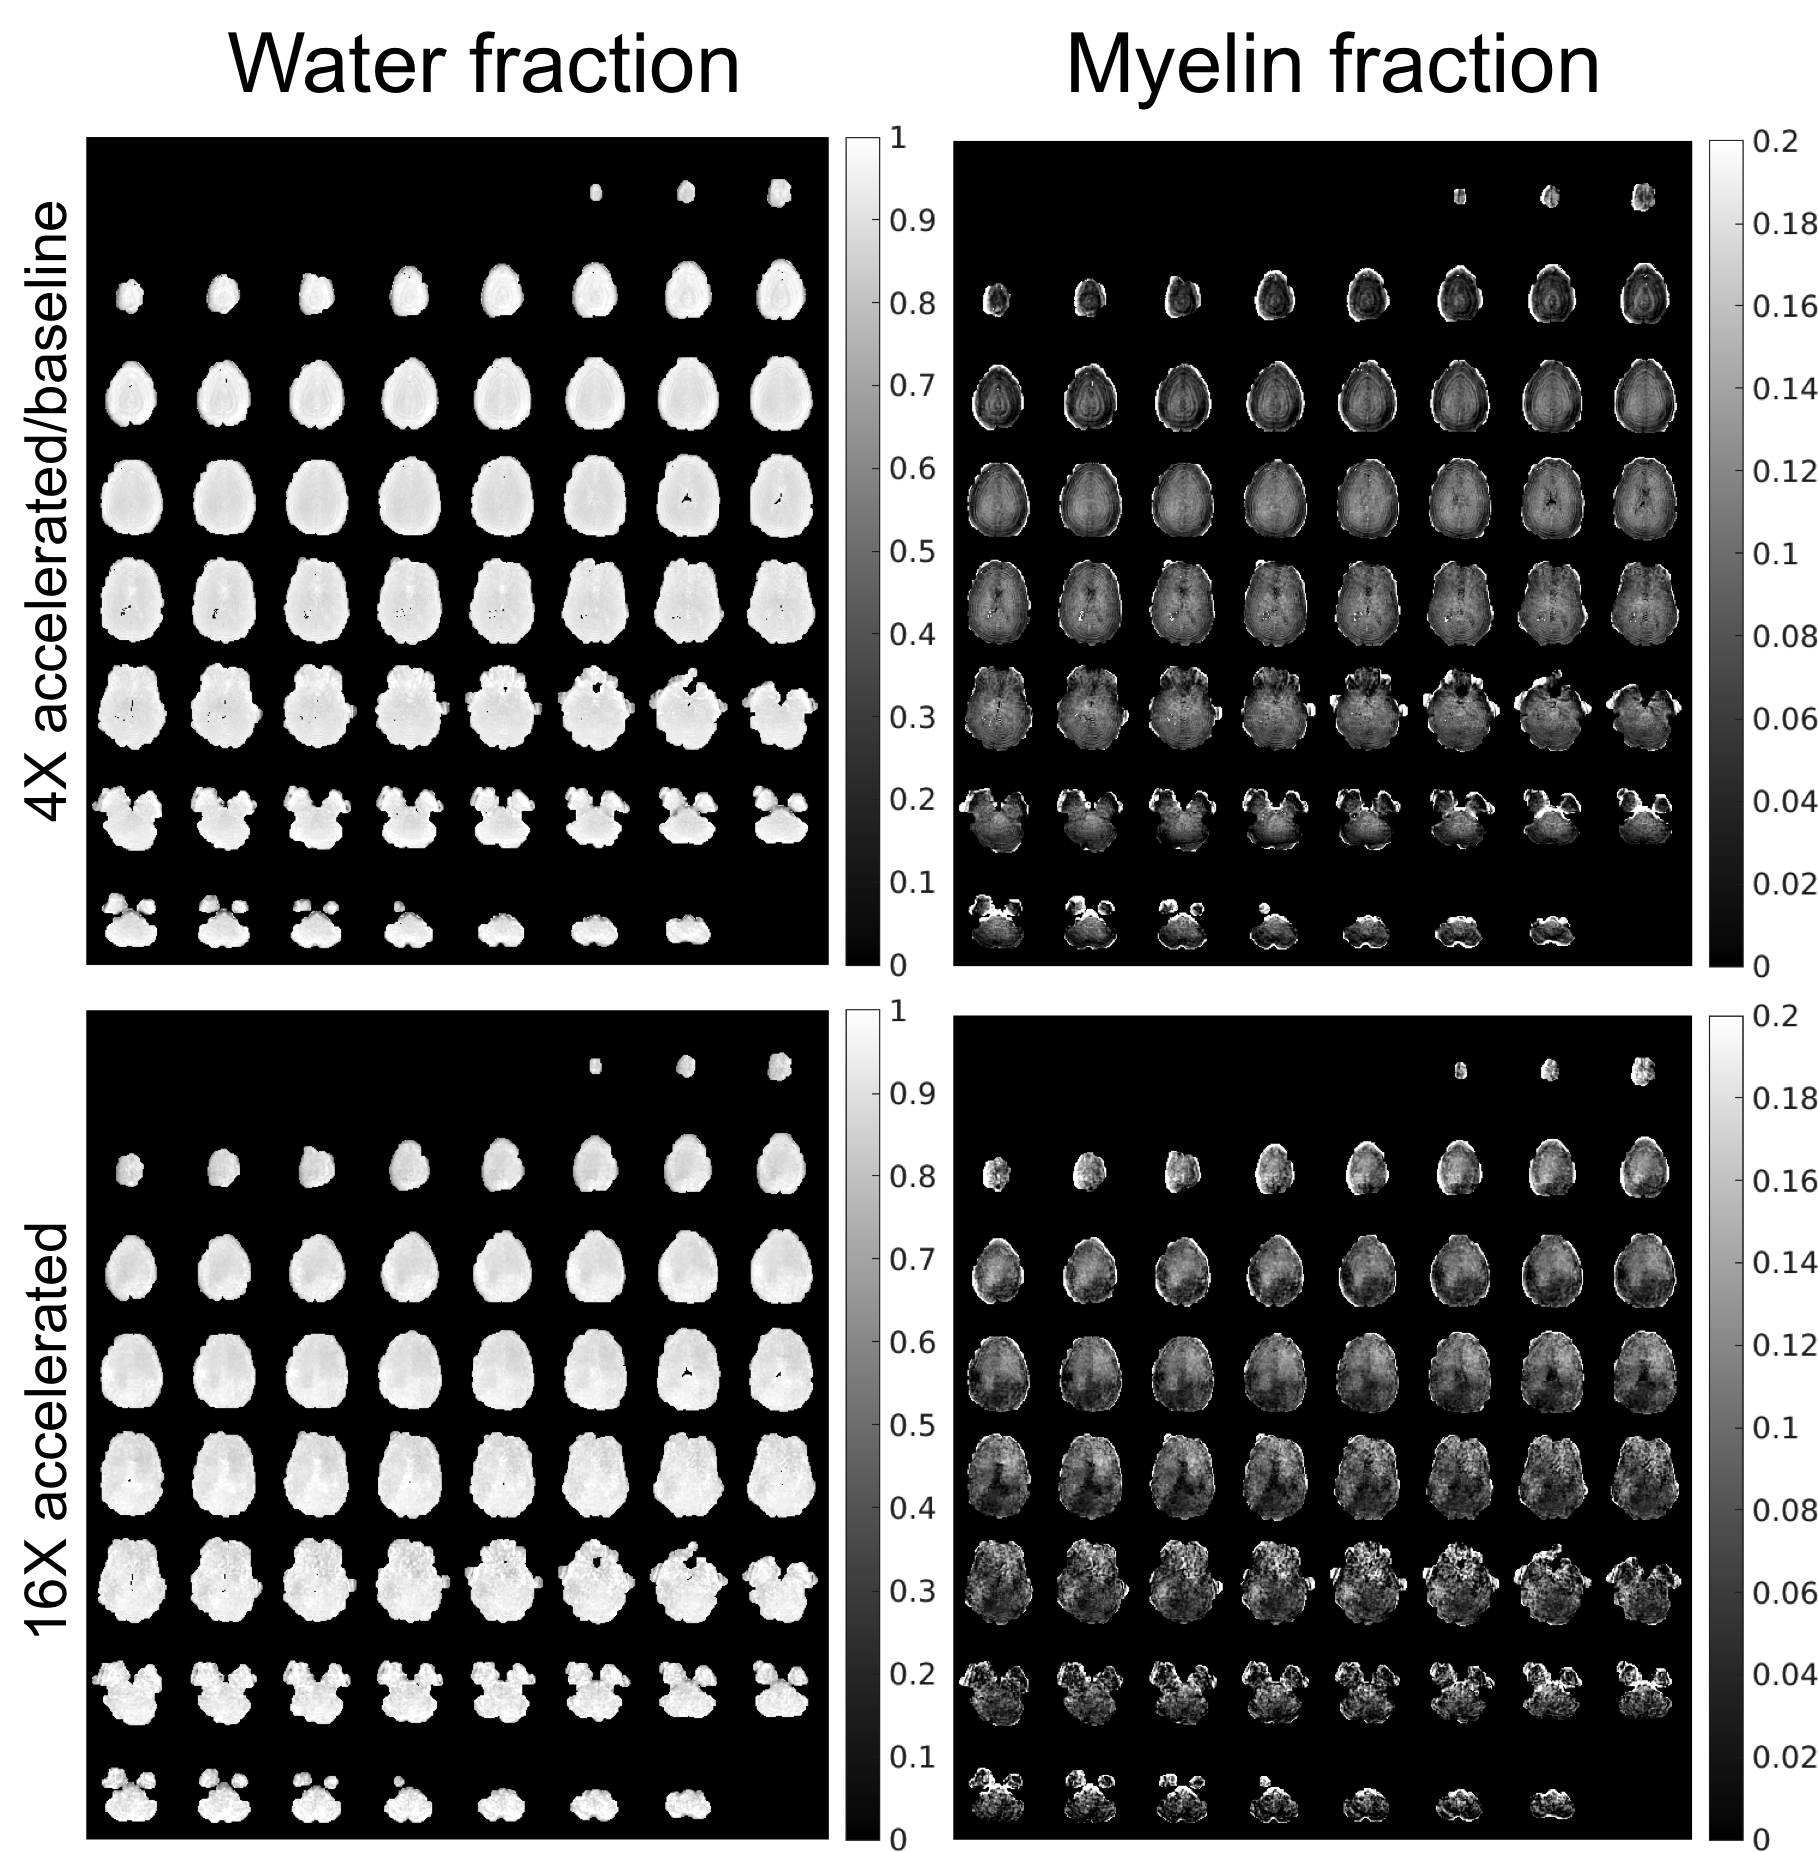
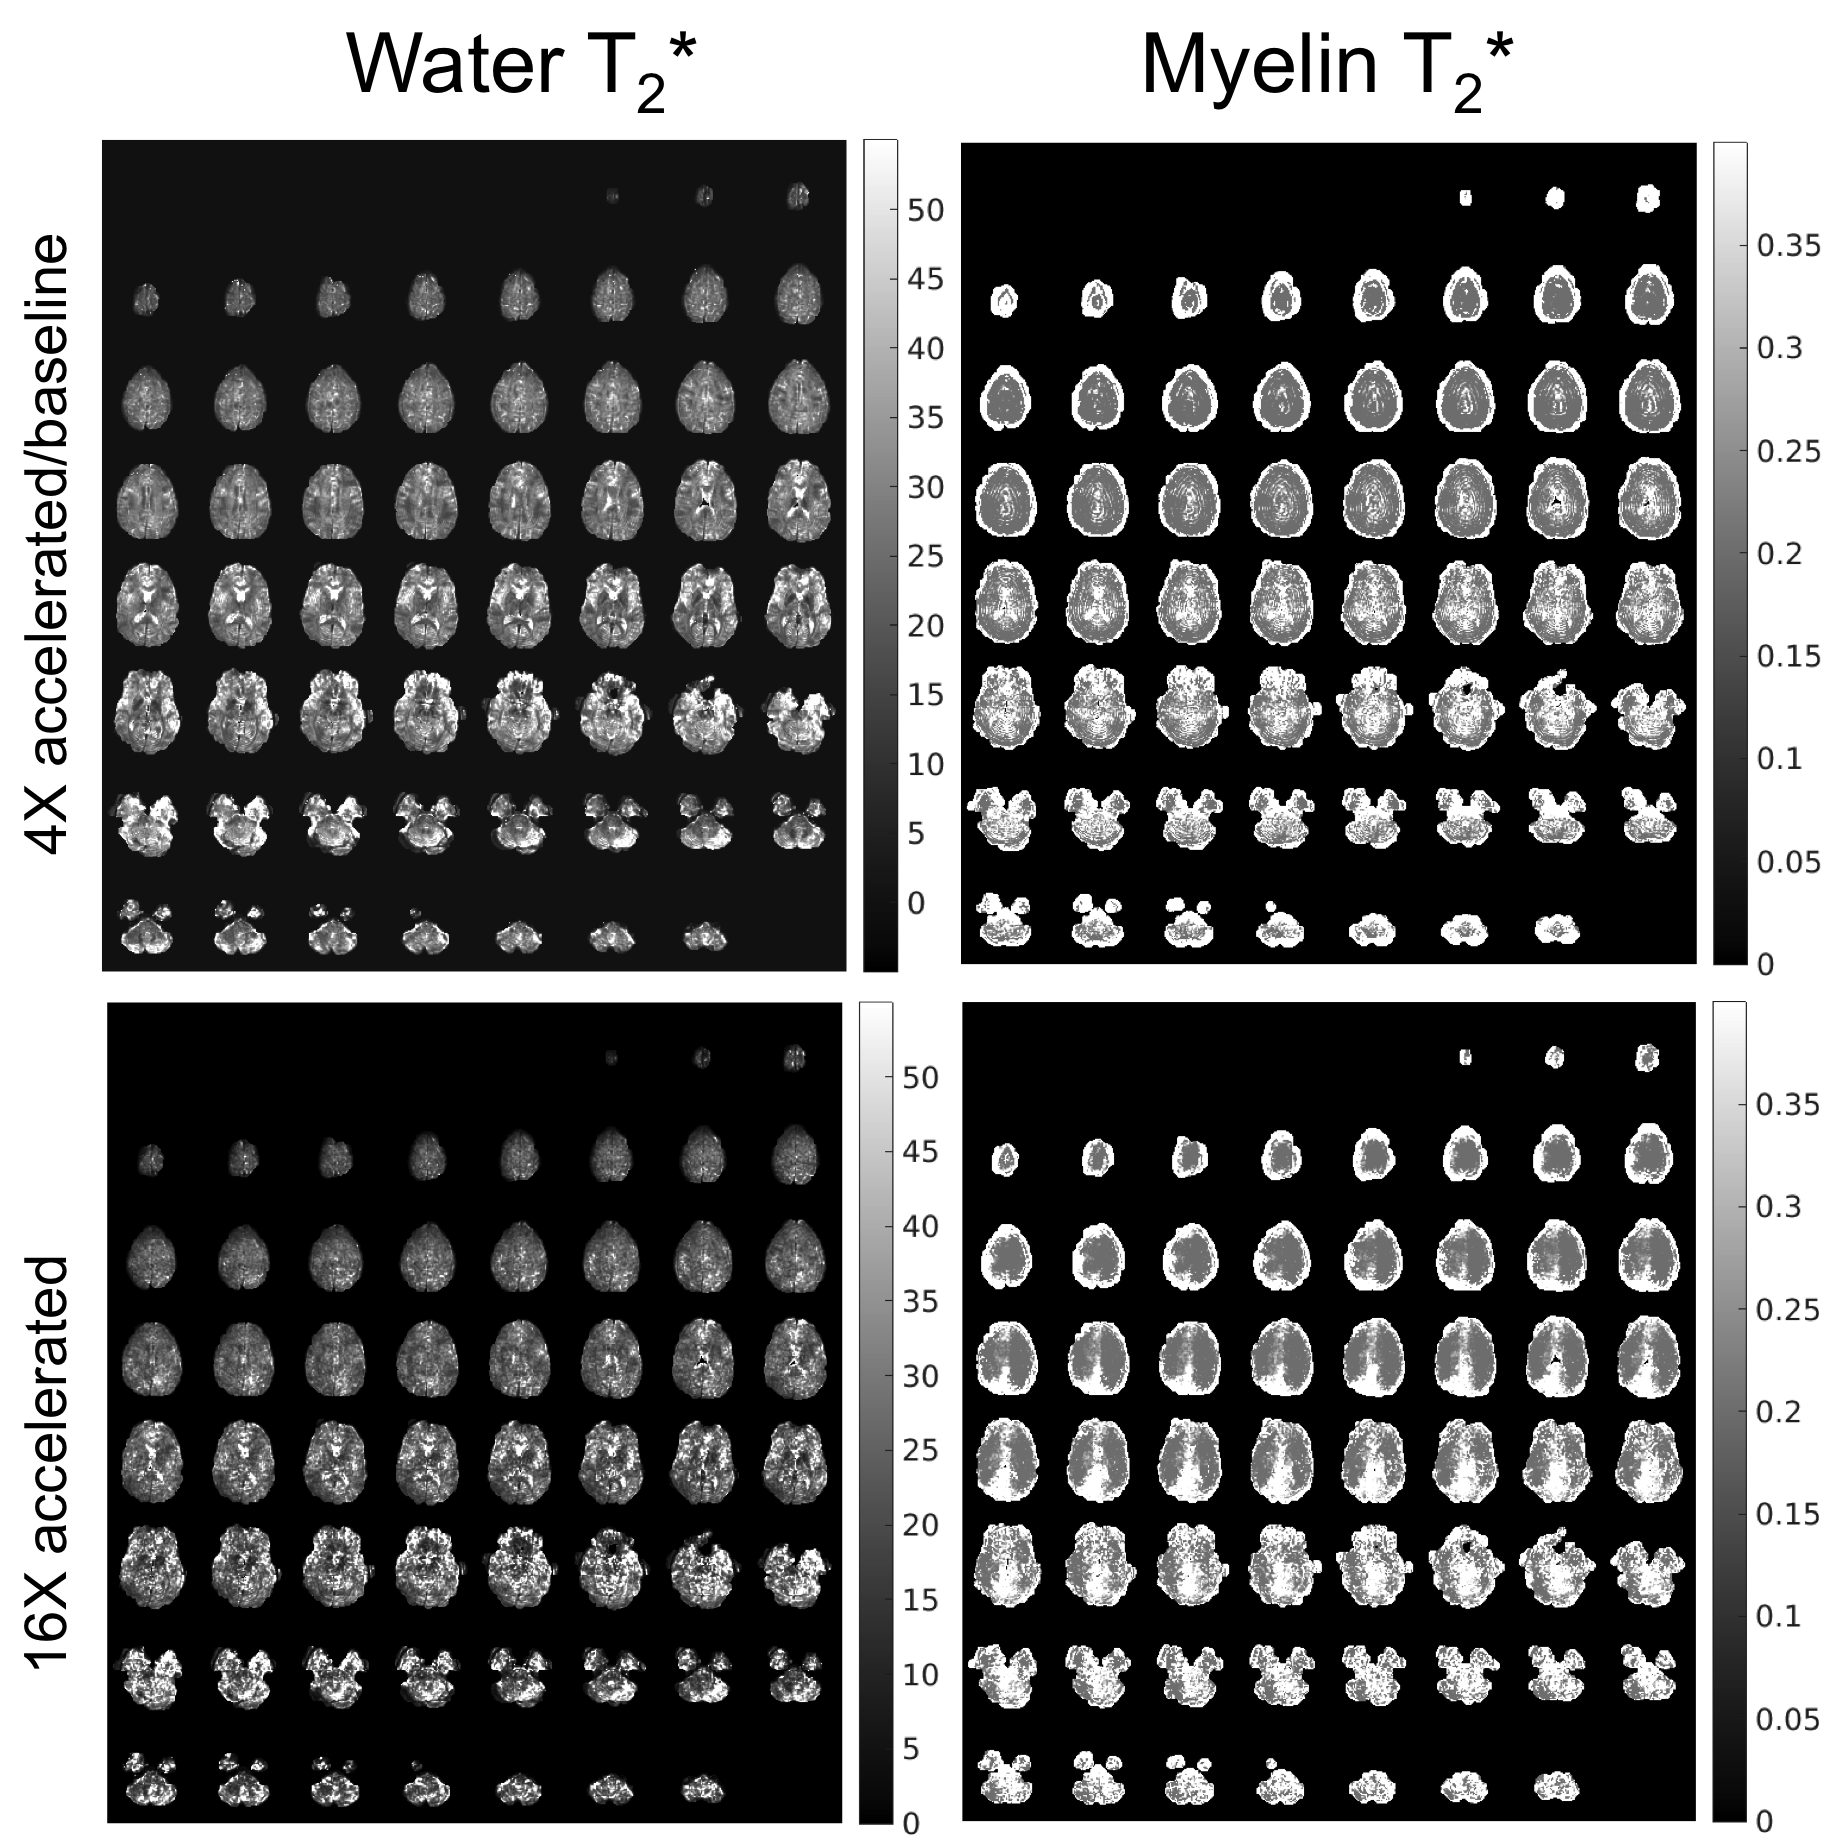
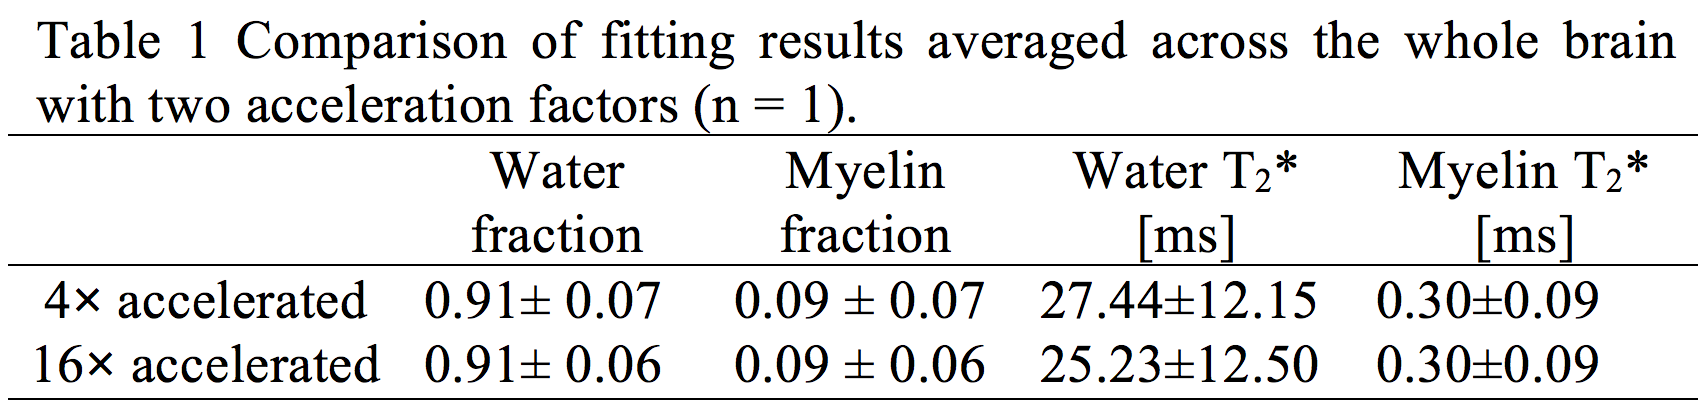
Figure 2 shows the proposed acceleration method preserved the spatial and relaxation characteristics with acceleration factors up to 16-fold. With acceleration random fluctuations induced by undersampling were noticed. Figures 3 and 4 show the quantitative maps with 16-fold acceleration were comparable with those of 4-fold sampled data (baseline). Some signal loss in the 16-fold accelerated myelin fraction map was noticed, possibly indicating insufficient SNR for this low concentration component. Table 1 summarizes the quantitative results shown in Figures 3 and 4. The water and myelin fractions and T2*s from accelerated datasets were agreed well with those from 4-fold sampled data.Discussion and Conclusion
This study demonstrated the feasibility of the proposed acceleration method in the direct myelin content measurement using multi-UTE data. Without acceleration, the multi-UTE scan time to acquire this large number of echo times would be several hours. On the other hand, Hankel matrices for FIDs of this multi-UTE dataset were approximately low rank as there were typically one or two exponential components in each FID. High acceleration factors achieved in this study can significantly reduce the scan time.Acknowledgements
No acknowledgement found.References
1. Wilhelm, M. J. et al. Direct magnetic resonance detection of myelin and prospects for quantitative imaging of myelin density. Proc. Natl. Acad. Sci. 109, 9605–9610 (2012).
2. Horch, R. A., Gore, J. C. & Does, M. D. Origins of the ultrashort-T2 1H NMR signals in myelinated nerve: A direct measure of myelin content? Magn. Reson. Med. 66, 24–31 (2011).
3. MacKay, A. et al. In vivo visualization of myelin water in brain by magnetic resonance. Magn. Reson. Med. 31, 673–677 (1994).
4. Larson, P. E. Z. et al. Designing long-T2 suppression pulses for ultrashort echo time imaging. Magn. Reson. Med. 56, 94–103 (2006).
5. Du, J. et al. Ultrashort echo time (UTE) magnetic resonance imaging of the short T2 components in white matter of the brain using a clinical 3T scanner. Neuroimage 87, 32–41 (2014).
6. Tanguy Boucneau, Shuyu Tang, Misung Han, Roland G Henry, Duan Xu, and P. E. Z. L. In Vivo Characterization of Brain Ultrashort-T2 Components. in ISMRM Proceeding 330 (2016).
7. Uecker, M. et al. ESPIRiT - An eigenvalue approach to autocalibrating parallel MRI: Where SENSE meets GRAPPA. Magn. Reson. Med. 71, 990–1001 (2014).
8. Tamir, J. I. et al. T 2 shuffling: Sharp, multicontrast, volumetric fast spin-echo imaging. Magn. Reson. Med. 0, n/a-n/a (2016).
9. Ong, F. & Lustig, M. Beyond Low Rank + Sparse: Multiscale Low Rank Matrix Decomposition. IEEE J. Sel. Top. Signal Process. 10, 672–687 (2016).
10. Afonso, M. V., Bioucas-Dias, J. M. & Figueiredo, M. A. T. An augmented lagrangian approach to the constrained optimization formulation of imaging inverse problems. IEEE Trans. Image Process. 20, 681–695 (2011).
11. Boyd, S., Parikh, N., E Chu, B. P. & Eckstein, J. Distributed Optimization and Statistical Learning via the Alternating Direction Method of Multipliers. Found. Trends Mach. Learn. 3, 1–122 (2011).
Figures