4750
Quantitative T1 mapping and somatotopic organization of the cerebellum at 7T : is there a link?1Laboratory of Functional and Metabolic Imaging, Ecole Polytechnique Fédérale de Lausanne, Lausanne, Switzerland, 2Department of Neurophysics, Max Planck Institute for Human Cognitive and Brain Sciences, Leipzig, Germany, 3Department of Radiology, University of Lausanne, Lausanne, Switzerland, 4Department of Radiology, University of Geneva, Geneva, Switzerland, 5Biomedical Imaging Research Center, Ecole Polytechnique Fédérale de Lausanne, Lausanne, Switzerland, 6Spinoza Centre for Neuroimaging, Amsterdam, Netherlands
Synopsis
In this study, the spatial relationship between the somatotopy and the pattern of myelination (as measured by quantitative T1-maps) in the cerebellum was investigated. Subject-specific surfaces were generated on which were mapped T1 values and somatotopic maps. Consistent somatotopic gradients organized through several lobules were present in the anterior and posterior lobes. Despite being more complex, changes of T1 values across the cerebellar surface were also observed and showed a similar orientation as the somatotopic organization. This study showed the potential structure-function relationship of the cerebellum observed at macroscale level.
Introduction
The cerebellar cortex is characterized by heterogeneous patterns of different amounts of myelin and protein expression profiles1–3. Functionally, the cerebellum exhibits an organized somatotopy4–6. The combination of the structural and somatotopic organizations may represent functional units with distinct neuronal activities which may play a role in the processing of sensory information as suggested by electrophysiological recordings at microscale level3,7,8. Previous MRI studies have showed a similar organization between the level of myelination and the functional organization of the auditory9 and visual cortices10. The goal of this study was to investigate the observability of such a structure-function relationship in the cerebellum using quantitative T1 data and somatotopic maps.Methods
Nine healthy participants (5 females, 18-27 y.o., right-handed) were scanned at 7T (Siemens). They performed a motor task following a visual cue indicating which body part to move (15s ON, 10s OFF). Five different body parts were targeted (6x5 min): bilateral toes, bilateral thumbs, bilateral little fingers, tongue and eyes. Functional data were acquired with a sinusoidal EPI (1*1*1 mm voxels, matrix 154x154x46, coronal-oblique acquisition, TR/TE:2700/28ms, PE acc. factor:2). An MP2RAGE11; TR/TE/TI1/TI2 6000/2.05/800/2700ms, matrix 320x256x320, 0.6x0.6x0.6mm3) and a SA2RAGE12 (TR/TE:2400/0.79ms, matrix 128x128x64, voxel 2.0x2.0x2.5mm) were acquired. Respiratory and cardiac traces were recorded with external sensors. Functional data were processed with SPM12, including slice-timing, realignment and smoothing (1.5mm FWHM). A first level GLM was created with one regressor per body part and the physiological traces as nuisance regressors. A second level analysis F-test was performed by using a nonparametric permutation method (SnPM, CDT=0.001, p<.05 FWE-corrected at cluster-level). A labeled map was created at subject- and group-level representing the five body parts (see4). The MP2RAGE T1-maps were corrected for B1-inhomogeneities using the SA2RAGE B1-map13. The CBS tools toolbox14 was used to for the next steps. After skull-stripping15, the T1-maps were brought into the MNI space16 and segmented14 into cerebellar gray (GM) and white (WM) matters, which were used to create a binary mask. The latter was manually corrected17. The masked T1-maps were then segmented using FANTASM18 providing a fine delineation of GM, WM and cerebrospinal fluid (CSF). The WM-GM and GM-CSF borders level sets were extracted19 and a continuous layering of the cerebellar cortex was built at three different cortical depths20: an inner, a middle and an outer surfaces. The T1-maps were nonlinearly registered21 to a high-resolution template (CHROMA). The transformation map obtained from the previous procedure was applied to the three surfaces to realign them before averaging across subjects. Averaged T1 values were then mapped onto the three surfaces and also inflated surfaces of the CHROMA template. Label maps were then brought into the MNI and CHROMA space.Results
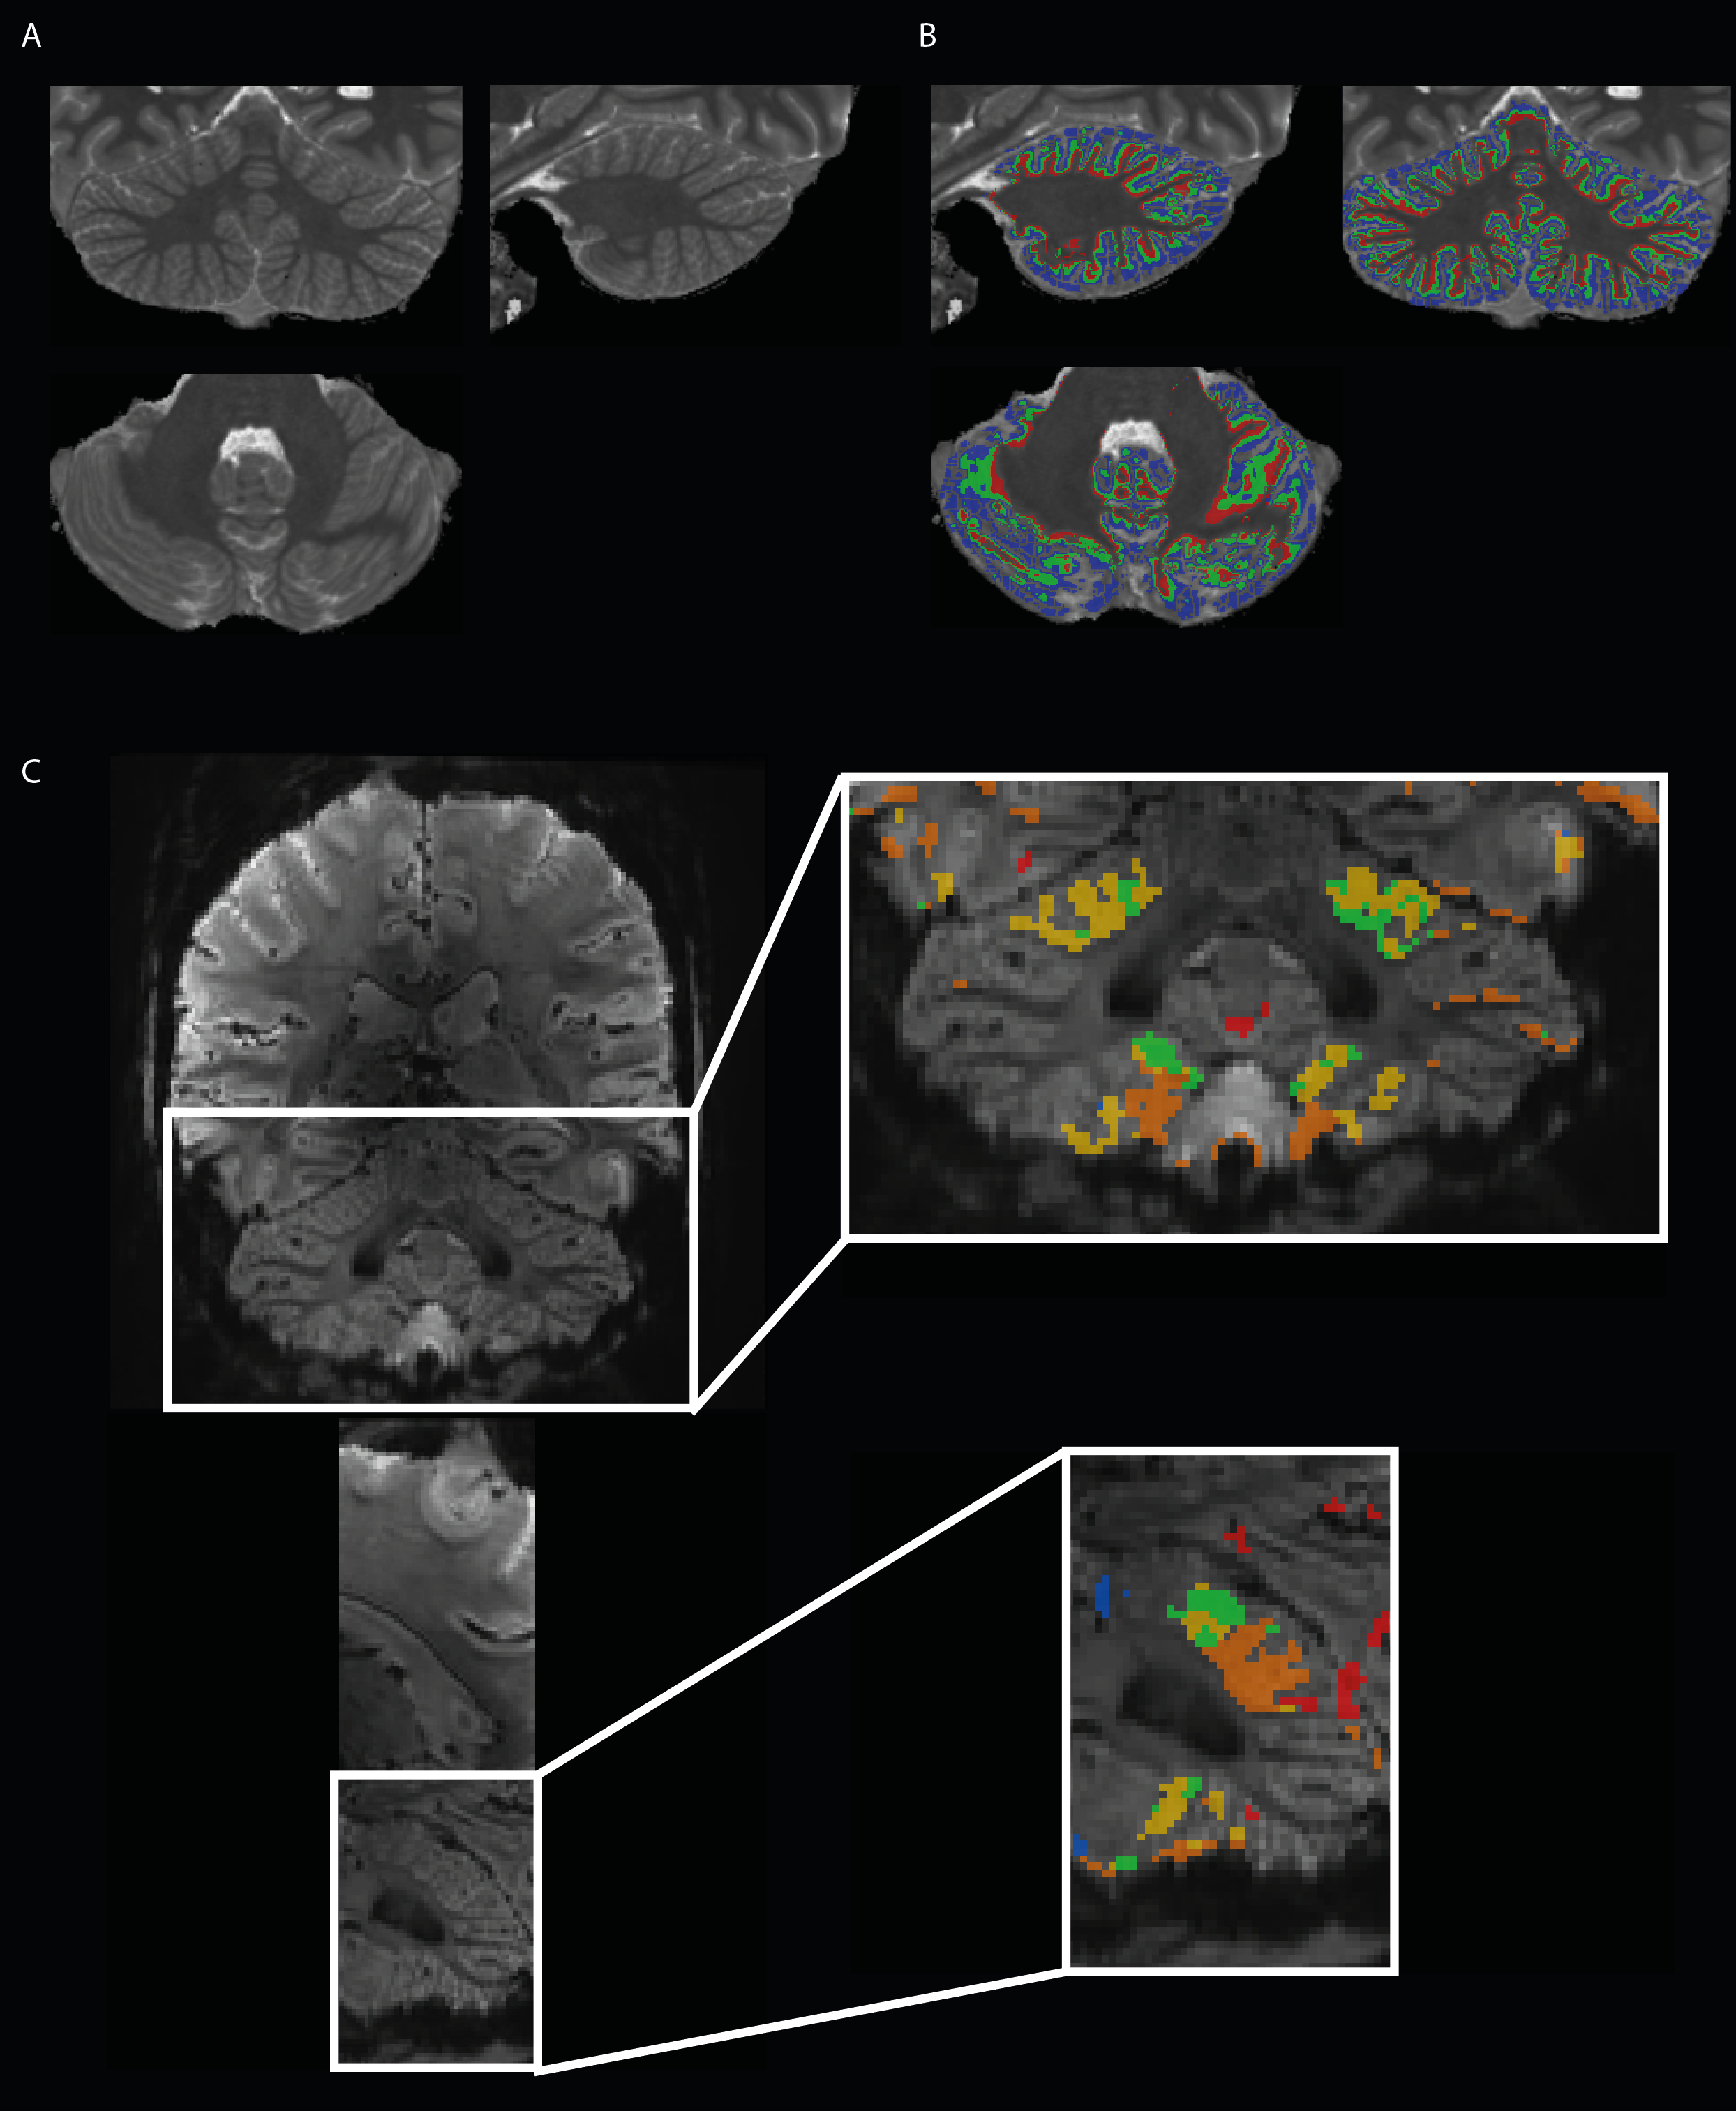
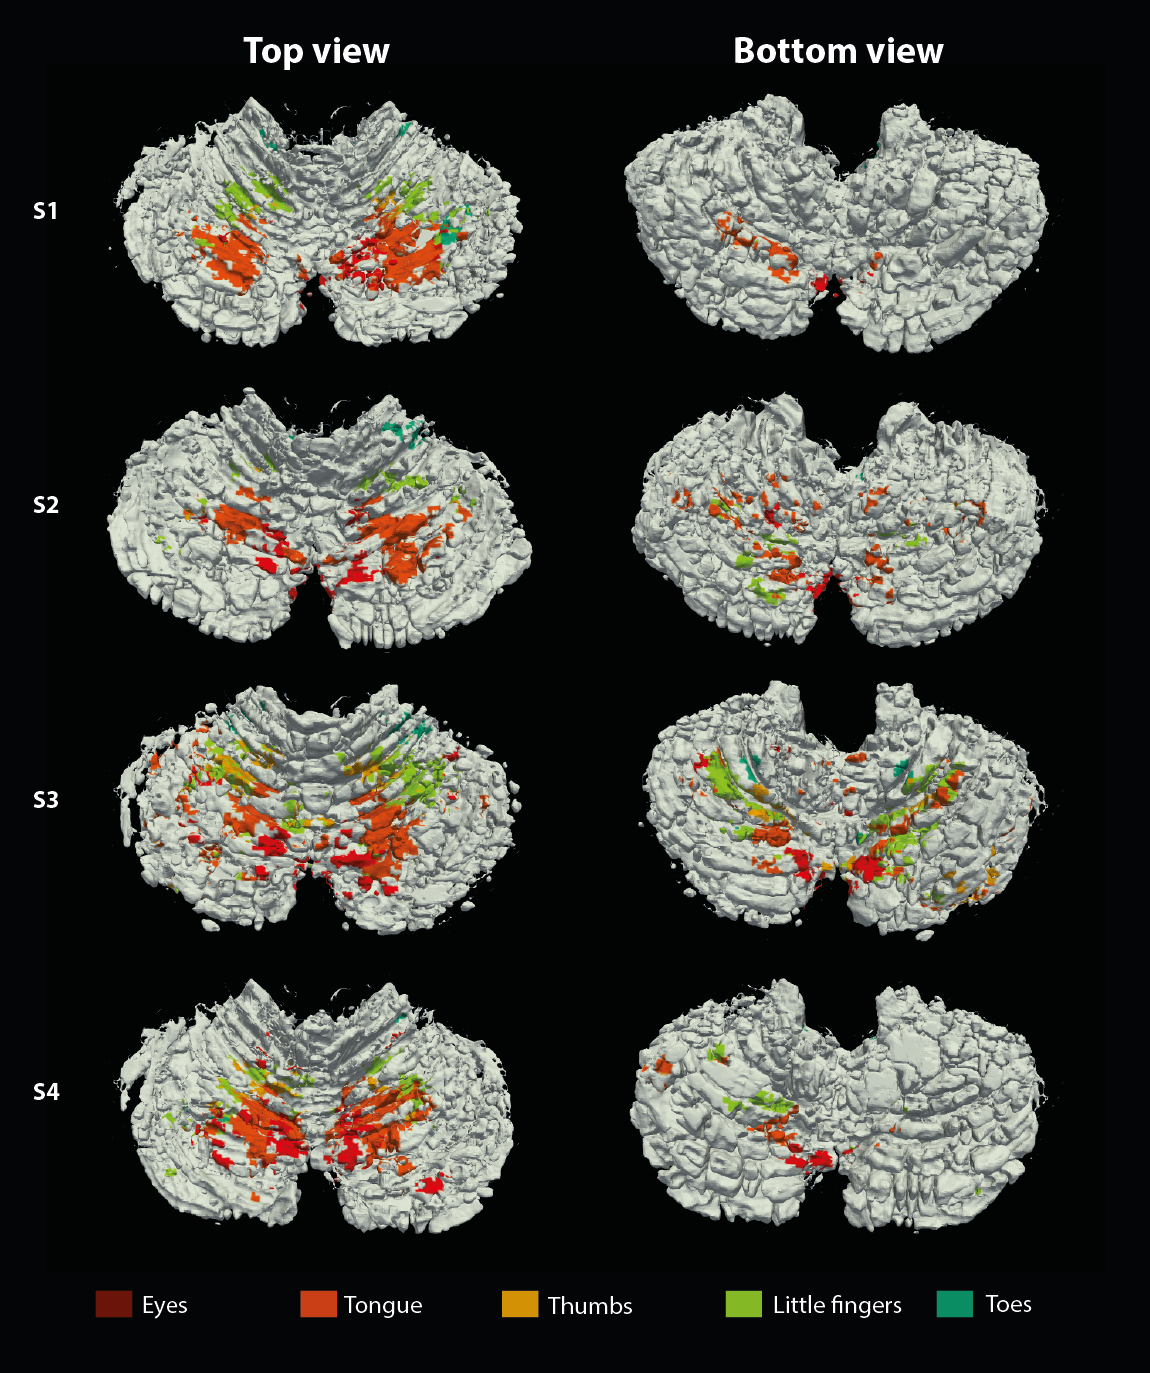
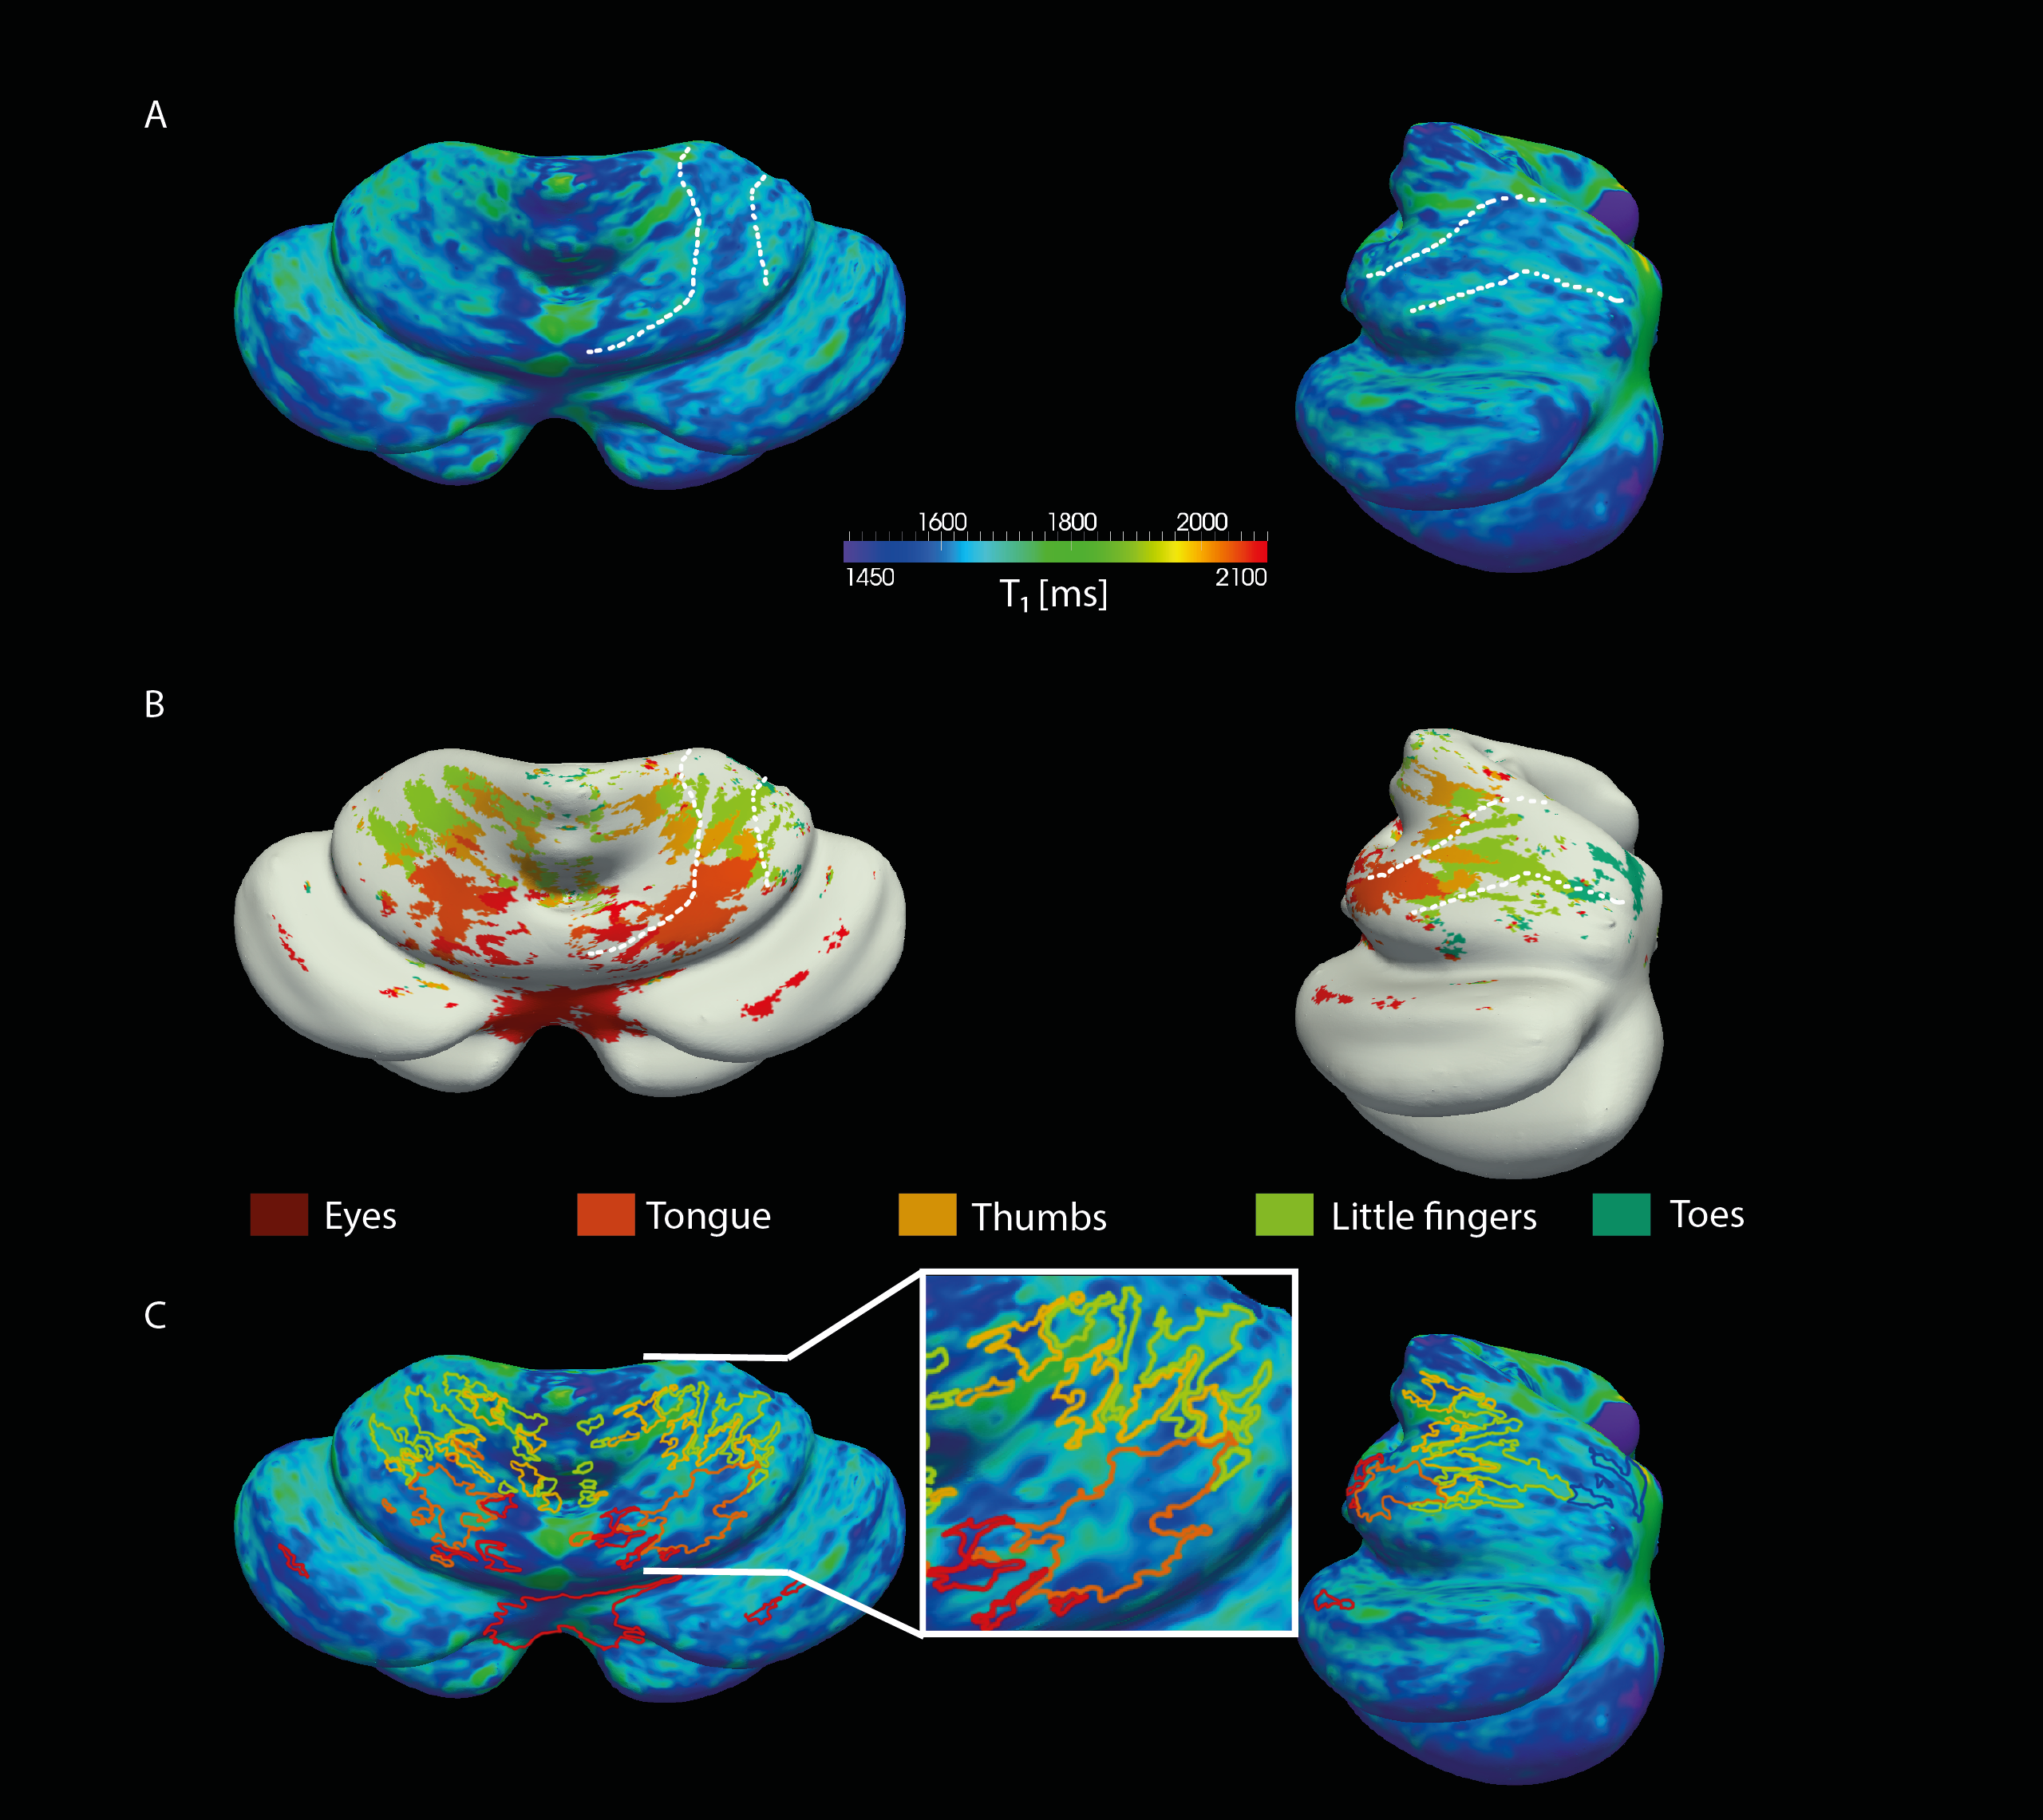
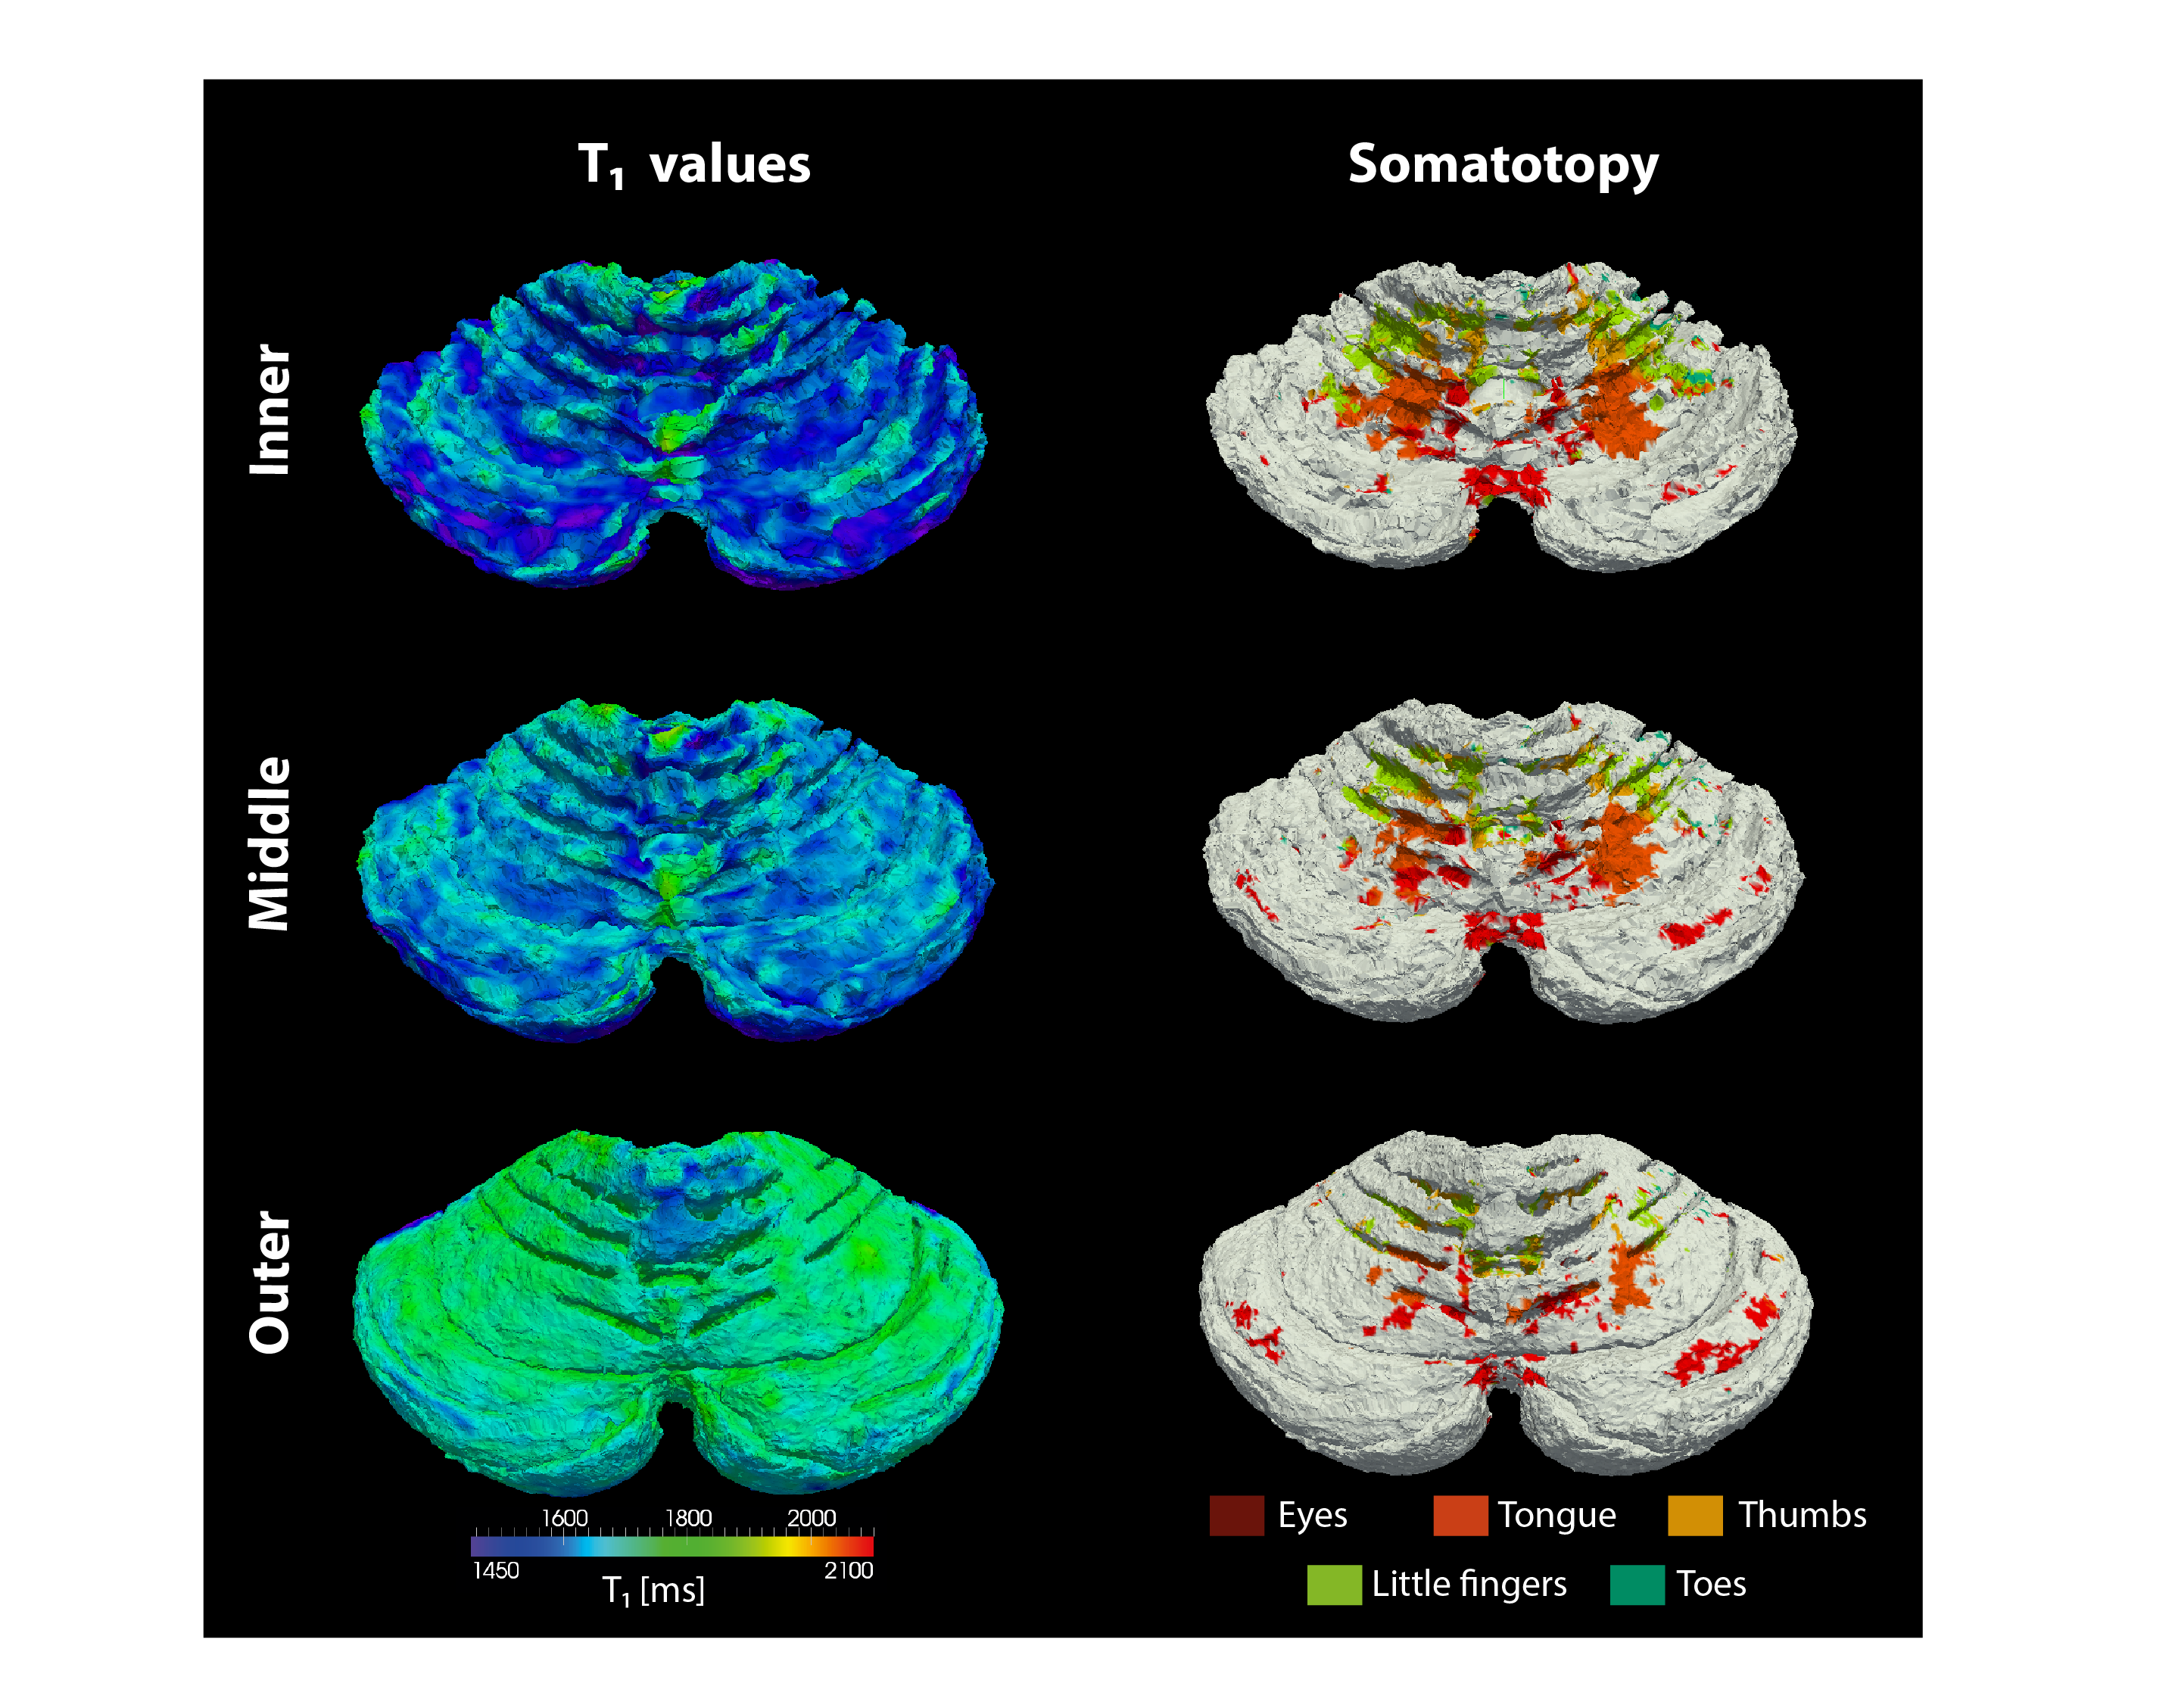
The resolution of both the T1 and EPI images were high enough to obtain a good delineation of the folia and arbor vitae and to segment the cerebellar gray matter layer at three cortical depths (Figure1). Single participant surfaces show the different body parts being represented in the antero-superior and inferio-posterior area of the cerebellum (Figure2). In the anterior lobe, a foot-head gradient can be observed longitudinally in the anterio-posterior direction, not following the anatomical structure of lobules and folia. Another, similar gradient may be distinguished in the posterior lobe, although with less SNR. This pattern is consistent at the group level (Figure3 and 4). Concerning the T1 values, they increased when going more laterally to decrease again in the very lateral regions (Figure3 and Figure4). This pattern is mainly observable on the inner and middle surfaces. The somatotopic gradient globally follows the orientation of the T1 pattern (See lines Figure 3). T1 values overall decrease going from outer to inner cortical depths (Figure4).Discussion
The observed somatotopic pattern, consistent with previous studies4,6, is organized through several lobules: lobules IV to VI for the anterior lobe and VIIb to VIIIb for the posterior lobe. T1 values, which have been linked related to the level of myelination22,23, seem to change in a media-lateral fashion across several lobules, similar to the somatotopy. Myelination has been related to a protein expression (zebrin II) pattern1,24 which may play a role in sensory information processing3,7,8. However, these observations have been found at a microscale level and whether they can translate to the present results remains to be confirmed.Conclusion
This study was a first attempt to link quantitative T1 mapping with the somatotopic organization of the cerebellum using sophisticated methods for subject-specific surface reconstruction and mapping. Although, a similar spatial organization was found, further studies will be needed to confirm this relationship.
Acknowledgements
This work was supported by the Centre d'Imagerie BioMédicale (CIBM) of the UNIL, UNIGE, HUG, CHUV, and EPFL and the Leenaards and Jeantet Foundations and the Swiss National Science Foundation Grants #153070.References
1. Voogd, J. Cerebellar zones: A personal history. Cerebellum 10, 334–350 (2011).
2. Cerminara, N. L., Lang, E. J., Sillitoe, R. V. & Apps, R. Redefining the cerebellar cortex as an assembly of non-uniform Purkinje cell microcircuits. Nat. Rev. Neurosci. 16, 79–93 (2015).
3. Apps, R. & Hawkes, R. Cerebellar cortical organization: a one-map hypothesis. Nat. Rev. Neurosci. 10, 670–681 (2009).
4. Van der Zwaag, W. et al. Digit somatotopy in the human cerebellum: A 7T fMRI study. Neuroimage 67, 1–9 (2013).
5. Boillat, Y. & Van der Zwaag, W. Somatotopic body map of the cerebellum at 7T. in Human brain mapping 4213 (2016).
6. Wiestler, T., McGonigle, D. J. & Diedrichsen, J. Integration of sensory and motor representations of single fingers in the human cerebellum. J. Neurophysiol. 105, 3042–53 (2011).
7. Witter, L. & De Zeeuw, C. I. Regional functionality of the cerebellum. Curr. Opin. Neurobiol. 33, 150–155 (2015).
8. Tsutsumi, S. et al. Structure-Function Relationships between Aldolase C/Zebrin II Expression and Complex Spike Synchrony in the Cerebellum. J. Neurosci. 35, 843–852 (2015).
9. Dick, F. et al. In vivo functional and myeloarchitectonic mapping of human primary auditory areas. J. Neurosci. 32, 16095–16105 (2012).
10. Sereno, M. I., Lutti, A., Weiskopf, N. & Dick, F. Mapping the human cortical surface by combining quantitative T1 with retinotopy. Cereb. Cortex 23, 2261–2268 (2013).
11. Marques, J. P. et al. MP2RAGE, a self bias-field corrected sequence for improved segmentation and T1-mapping at high field. Neuroimage 49, 1271–81 (2010).
12. Eggenschwiler, F., Kober, T., Magill, A. W., Gruetter, R. & Marques, J. P. SA2RAGE: a new sequence for fast B1+ -mapping. Magn. Reson. Med. 67, 1609–19 (2012).
13. Marques, J. P. & Gruetter, R. New developments and applications of the MP2RAGE sequence--focusing the contrast and high spatial resolution R1 mapping. PLoS One 8, e69294 (2013).
14. Bazin, P. L. et al. A computational framework for ultra-high resolution cortical segmentation at 7 Tesla. Neuroimage 93, 201–209 (2013).
15. Smith, S. M. Fast robust automated brain extraction. Hum. Brain Mapp. 17, 143–155 (2002).
16. Jenkinson, M. & Smith, S. A global optimisation method for robust affine registration of brain images. Med. Image Anal. 5, 143–156 (2001).
17. Yushkevich, P. a. et al. User-guided 3D active contour segmentation of anatomical structures: Significantly improved efficiency and reliability. Neuroimage 31, 1116–1128 (2006).
18. Pham, D. L. Robust Fuzzy Segmentation of Magnetic Resonance Images. IEEE Symp. Comput. Med. Syst. 127–131 (2001).
19. Han, X. et al. CRUISE: Cortical reconstruction using implicit surface evolution. Neuroimage 23, 997–1012 (2004).
20. Waehnert, M. D. et al. Anatomically motivated modeling of cortical laminae. Neuroimage 93, 210–220 (2014).
21. Avants, B. B., Epstein, C. L., Grossman, M. & Gee, J. C. Symmetric diffeomorphic image registration with cross-correlation: Evaluating automated labeling of elderly and neurodegenerative brain. Med. Image Anal. 12, 26–41 (2008).
22. Stüber, C. et al. Myelin and iron concentration in the human brain: A quantitative study of MRI contrast. Neuroimage 93, 95–106 (2014).
23. Lutti, A., Dick, F., Sereno, M. I. & Weiskopf, N. Using high-resolution quantitative mapping of R1 as an index of cortical myelination. Neuroimage 93, 176–188 (2014).
24. Feirabend, H. K. P., Choufoer, H. & Voogd, J. White matter of the cerebellum of the chicken (Gallus domesticus): A quantitative light and electron microscopic analysis of myelinated fibers and fiber compartments. J. Comp. Neurol. 369, 236–251 (1996).
Figures