4749
Glucose Tolerance Test in the Human Brain: 1H MRS study at 7 Tesla1Diagnostics, Siemens Healthcare Japan, Tokyo, Japan, 2Psychology, UC Berkeley, Berkeley, CA, United States, 3NIPS, Okazaki, Japan, 4Department of Diagnostic Radiology, Kyoto University, Japan
Synopsis
The goal of this study is to perform an oral glucose tolerance test (GTT) in the healthy human brain tissue in vivo and to evaluate the performance of the recently developed 1H MRS technique. The observed glucose level curve shape showing increase and washout during the 1H MRS GTT test is consistent with the medical GTT blood measurements obtained in healthy subjects. This study demonstrates the initial steps towards better understanding of potential utility of 1H MRS in experiments on glucose metabolism in vivo in the context of nutrition, brain function, and various neurological disorders with impaired glucose utilization.
Introduction
Various brain functions are closely linked to glucose levels and how the brain utilizes this primary fuel source. Glucose metabolism studies in the brain have been primarily limited to labeled carbon (13C) infusions, using 13C MRS detection. The goal of this study is to evaluate the performance of the recently developed proton (1H) MRS technique1 in the context of an oral glucose tolerance test (GTT) in the healthy human brain tissue in vivo.Methods
The study is designed to replicate a standard GTT procedure performed in a hospital, except that the glucose measurements are from a localized volume in the human brain, instead of the blood plasma. Unlike the standard GTT data collection, the measurements are taken continuously and last 1.5 hours (in the hospitals each data point is acquired every 30 minutes and data acquisition is ~ 2-3 hrs). Preliminary in vivo spectra are acquired using normal subjects (with prior 12 hours fasting), who gave informed consent according to procedures approved by the local IRB committee. The 1H MRS data sets are collected in 15 blocks total (1 block: 64 water suppressed and 4 water unsuppressed scans, TR=6 s). First two data blocks are collected prior to the oral glucose intake to establish fasting baseline glucose levels. After fasting baseline data collection, the subjects are instructed to drink glucose solution (glucose=50 g, standard Japanese hospital solution for GTT) and another 13 data blocks are collected immediately. The subjects remain in the magnet throughout the GTT procedure and drink glucose using non-spill cup for drinking in bed. All data is collected on a 7T Magnetom system (Siemens, Erlangen, Germany), maximum gradient strength = 70 mT/m. A 27 mL (3x3x3 cm3) voxel is selected in sagittal midline above corpus callosum (see inset in Fig.1). The optimized J-edit difference technique1 for detecting beta-glucose (β-Glc) resonance at 3.23 ppm using 1H MRS at 7 T is utilized to measure β-Glc concentration as a function of time in the selected voxel. The J-edit difference sequence uses two separate scans: during the first scan (Edit Off) the editing pulse is centered at 7.5 ppm, while during the second scan (Edit On), the editing pulse is centered on the β-Glc resonance at 4.63 ppm. The difference spectrum (Edit Off-Edit On) contains the contributions from the β-Glc resonance at 3.23 ppm. In vivo MRS data parameters are: TE=114 ms, total number of averages = 960 (Edit On=Edit Off=480 scans each). The total acquisition time after oral glucose intake is 90 min.Results/Discussion
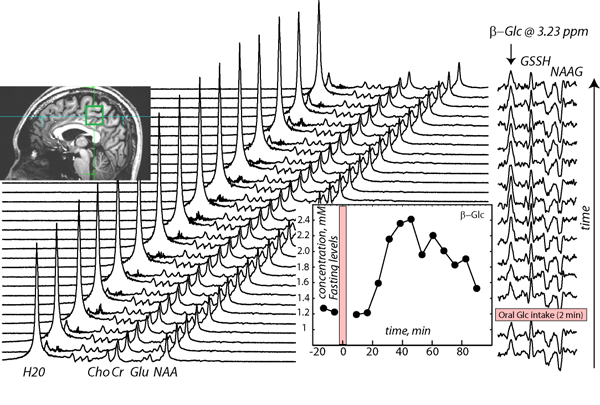
Figure 1 shows the example of a data set and data analysis from one healthy subject: GTT 1H MRS scans acquired as a function of time prior and after the oral glucose intake (alternating Edit Off/Edit On scans, with reduced water peak during Edit On scan). The resulting difference (or edited) spectra are shown on the right hand side, with 4 resonances: β-Glc at 3.23 ppm and co-edited resonances of glutathione (GSH) and N-acetylaspartylglutamate (NAAG). The β-Glc concentration curve is shown as an inset in Figure 1 (bottom right). The β-Glc levels reached the highest point (2.4 mM) in ~ 40 minutes after oral glucose intake. The maximum level of glucose measured constituted 100% concentration increase, doubling the level of fasting glucose (1.2 mM). The observed glucose level curve shape showing increase and washout during the 1H MRS GTT test is consistent with the medical GTT blood measurements obtained in healthy controls2. Since glucose from the blood is carried to the brain by a transport protein, this result is expected.Conclusions
This study utilizes 1H MRS method to mimic standard medical GTT procedure in order to evaluate its applicability to monitor non-invasively glucose metabolism in vivo. The results agree closely with medical GTT data in blood plasma in healthy subjects. One of the main advantages of this method is that does not require glucose injections and 13C hardware to measure glucose metabolism in the brain tissue. This study demonstrates the initial steps for better understanding of potential utility of 1H MRS in experiments on glucose metabolism in vivo in the context of nutrition, brain function, and various neurological disorders with impaired glucose utilization.Acknowledgements
This study was partially funded by JETRO/METI grant in JapanReferences
1) Kaiser, L. G., Hirokazu, K., Fukunaga, M. and B.Matson, G. (2016), Detection of glucose in the human brain with 1H MRS at 7 Tesla. Magn. Reson. Med. 2016. doi:10.1002/mrm.26456
2) Tschritter O, Fritsche A, Shirkavand F, et al. Assessing the shape of the glucose curve during an oral glucose tolerance test. Diabetes Care. 2003;26(4):1026-33
Figures