4748
T1 Shortening in the Globus Pallidus after Macrocyclic Gadolinium Contrast Agent Administration assessed with Multi-Dynamic, Multi-Echo (MDME) Sequence1Seoul National University Hospital, Seoul, Korea, Republic of
Synopsis
Although a few studies reported the possibility of Gd deposition in the brain by macrocyclic GBCAs, the final determination of deposition with macrocyclic GBCAs has not been performed. Because Synthetic MRI with MDME sequence enables quantitative measurements with relatively short time, our study aimed to investigate whether T1 relaxation time in globus pallidus was influenced by gadobutrol administrations by using the quantitative MR imaging. This study revealed that T1 shortening in globus pallidus occurs by gadobutrol administrations. Additional studies are needed to investigate the clinical significance of these findings.
Purpose
Because free gadolinium (Gd) is highly toxic and the potential release of free Gd depends on the stability of the Gd based contrast agents (GBCAs), there has been great interest focus on the Gd retention in the brain according to the class of GBCAs. So far, several studies on Gd retention in the brain described that linear GBCAs are associated with T1 signal intensity (SI) increase in the deep brain nuclei.1-3 Recently, an autopsy brain tissue study by Murata et al described that Gd deposition occurred with macrocyclic and linear GBCAs in all brain sampled with highest level in GP and DN.4 However, the final determination of deposition with macrocyclic agent seems still to be determined. By using multi-dynamic, multi-echo (MDME) sequence, we can not only get the conventional T1 and T2 weighted images, but also measure objective tissue water properties.5 Therefore, the purpose of our study was to determine if a correlation exists between the number or dose of previous macrocyclic contrast media (gadobutrol) administration and T1 relaxation time (T1) in the GP in patients with normal renal function by using MDME sequence.Methods
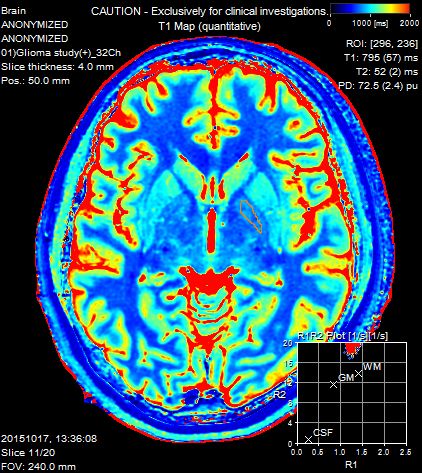
Among 112 patients who underwent contrast-enhanced brain MR imaging examinations which included MDME sequence, the following exclusion criteria were applied: (a) number of MR contrast administration at outside hospital exceeded one time; (b) any other GBCA exceeded one time; (c) contrast-enhanced MR imaging prior to 2008 when the documentation of the name of contrast material was not clear; (d) presence of brain hemorrhage or stroke; (e) edema, tumor or other lesions located in the basal ganglia or thalamus; (f) immediate postop MR imaging; (g) presence of midline shift ; and (h) unsatisfactory image quality. Finally, forty six patients were included in this study. Age, sex, diagnosis, treatment and eGFR were evaluated by means of chart review. In addition, it was assessed whether patients were treated with chemotherapy, radiation therapy, concurrent chemoradiation therapy or surgery. Finally, the number of gadobutrol-enhanced MR imaging, mean interval between the administrations and accumulated dose were calculated. A 2D fast spin echo (FSE) MDME sequence, which was performed using an interleaved slice-selective 120 degrees saturation and multi-echo acquisition was used. Free hand region of interests (ROIs) were drawn on the quantitative T1 maps (SyntheticMR AB, Linko¨ping, Sweden) to cover the normal appearing GP, thalamus, frontal white matter (WM) and frontal cortex. To assess the reproducibility of measurements, ROIs were placed twice by the same reader. Intra-observer reproducibility was assessed by calculating intraclass correlation coefficients (ICCs). The T1 of each anatomical region was modeled using multiple linear regression analyses. For the categorical variables, independent samples t-test or Mann-Whitney test was tested. Significant variables in univariate analyses were then evaluated by stepwise multiple regression analyses to identify factors independently associated with T1 of each anatomical region.Results
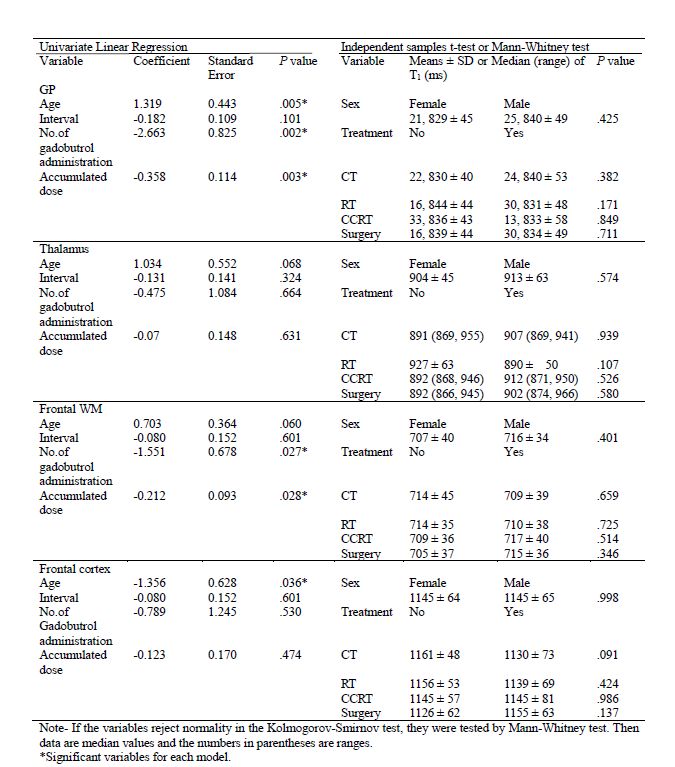
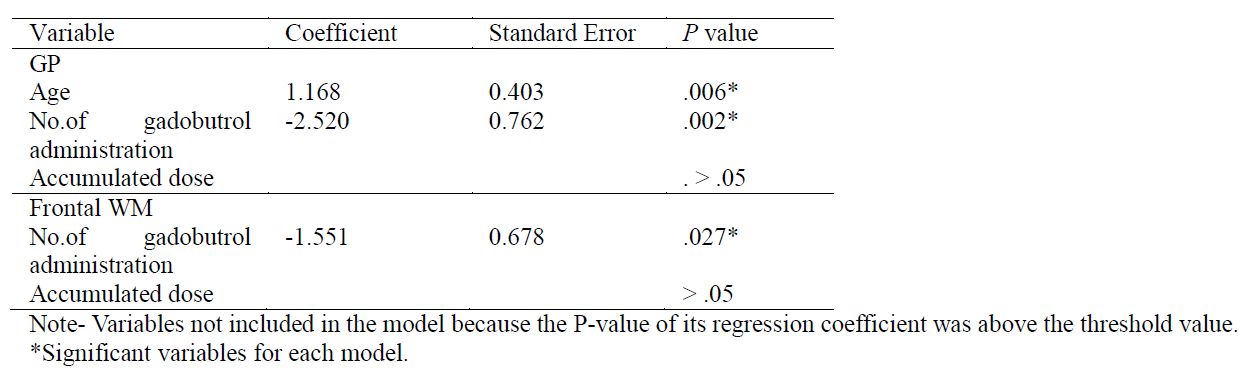
Intra-observer reproducibility was fair to excellent for T1 and SI of all anatomical regions except SI of the frontal cortex (ICC = 0.28, 95% CI: -0.30 to 0.60). Therefore, it was not included in the univariate analysis. T1 of GP was significantly associated with the number of gadobutrol administration and accumulated dose of gadobutrol (P = 0.002 and P = 0.003 , Table 1). Age was significantly associated with an increase in the GP T1 (P = 0.005). The mean interval between gadobutrol administrations, sex, and history of variable treatments did not have a significant influence on GP T1 and SI (All P > 0.05). Regarding the frontal WM, T1 was significantly decreased by the number of gadobutrol administration and accumulated dose (P = 0.027 and P = 0.028). Otherwise, T1 of the frontal cortex and thalamus were not influenced by Gd administration in all analyses (All P > 0.05). In the multivariate stepwise regression analyses, the number of gadobutrol administration and age were significantly associated with the GP T1 (P = 0.002 and P = 0.006). Regarding the frontal WM T1, the number of gadobutrol administration was the only significantly associated variable (P = 0.003).Conclusion
Macrocyclic GBCA exposure is associated with T1 shortening in the GP.Acknowledgements
NoneReferences
1. Errante Y, Cirimele V, Mallio CA, et al. Progressive increase of T1 signal intensity of the dentate nucleus on unenhanced magnetic resonance images is associated with cumulative doses of intravenously administered gadodiamide in patients with normal renal function, suggesting dechelation. Investigative radiology 2014;49:685-690
2. Quattrocchi CC, Mallio CA, Errante Y, et al. Gadodiamide and dentate nucleus T1 hyperintensity in patients with meningioma evaluated by multiple follow-up contrast-enhanced magnetic resonance examinations with no systemic interval therapy. Investigative radiology 2015;50:470-472
3. Weberling LD, Kieslich PJ, Kickingereder P, et al. Increased signal intensity in the dentate nucleus on unenhanced T1-weighted images after gadobenate dimeglumine administration. Investigative radiology 2015;50:743-748
4. Murata N, Gonzalez-Cuyar LF, Murata K, et al. Macrocyclic and Other Non–Group 1 Gadolinium Contrast Agents Deposit Low Levels of Gadolinium in Brain and Bone Tissue: Preliminary Results From 9 Patients With Normal Renal Function. Investigative radiology 2016;51:447-453
5. West J, Aalto A, Tisell A, et al. Normal appearing and diffusely abnormal white matter in patients with multiple sclerosis assessed with quantitative MR. PloS one 2014;9:e95161
Figures