4743
COnstrained Data Extrapolation (CODE): A New Approach for High Resolution MR Angiographic Image Reconstruction.1Shanghai Key Laboratory of Magnetic Resonance, East China Normal University, Shanghai, People's Republic of China, 2Magnetic Resonance Innovations, Inc., Detroit, MI, United States, 3Radiology, Wayne State University, Detroit, MI, United States
Synopsis
We propose a “COnstrained Data Extrapolation” (CODE) algorithm to reconstruct high-resolution MRA images from k-space with a lower resolution thereby accelerating acquisition of the data. We found that CODE can estimate a 50% (70%) stenosis of a vessel with a diameter equal to 7 (10) pixels in the high-resolution image to within 5% of the correct result when the SNR=4:1 or better. Both phantom simulations and in-vivo 3D contrast enhanced MRA data demonstrate that CODE is robust to noise and can be used to speed up conventional data acquisition by a factor of four.
Purpose
Imaging the vascular system is an important and common clinical practice in diagnosing patients with a variety of diseases.1,2 Since physicians treat stenosis for asymptomatic patients if there is a 50% stenosis or for symptomatic patients if there is a 70% stenosis, it is critical to measure the cross-sectional area (CSA) of a vessel.3 To determine the CSA of a vessel accurately to within 5% of the correct area, at least 4 voxels across the diameter of the vessel are needed.4 We propose a “COnstrained Data Extrapolation” (CODE) algorithm to reconstruct high-resolution MR angiography (MRA) images from low-resolution k-space data and accelerate the data acquisition by a factor of 4.Methods
We compared both CODE from centrally sampled k-space data and compressed sensing (CS)5 using random under-sampling (RUS) with fully sampled (FS) data with different levels of noise. For CS, we used a total variance approach to constrain the sparsity and the split Bregman algorithm to reconstruct the image.6 For CODE, we used the principle of invariance of the full width half maximum (FWHM) as a function of resolution. We zero-filled k-space to match the maximum k-space values used in the CS case. After FFT, we applied a global threshold in the image domain to remove the noise followed by a local threshold within the vessels to keep only voxels with an intensity greater than half the local maximum signal (thus maintaining the FWHM). After inverse FFT, the resulting data was merged with the original sampled data in the k-space domain by replacing the center of the newly created data with the original k-space data. Then this merged data was Fourier transformed to obtain the final CODE image. Both simulations and in-vivo 3D MRA data were used to evaluate the image quality from each reconstruction method. For the simulated data, a circle of diameter 160 pixels was embedded in a 2048x2048 matrix. The 3D contrast enhanced (CE) neck MRA data was collected with TWIST from a healthy volunteer on a Siemens 3T Trio scanner (matrix=384x288x88, resolution=0.89×0.89×0.9mm3, TR=2.96ms, TE=1.12ms, FA=20°).7 The total acquisition time was 5.88s with 6/8 partial Fourier in phase-encoding and partition-encoding directions.Results
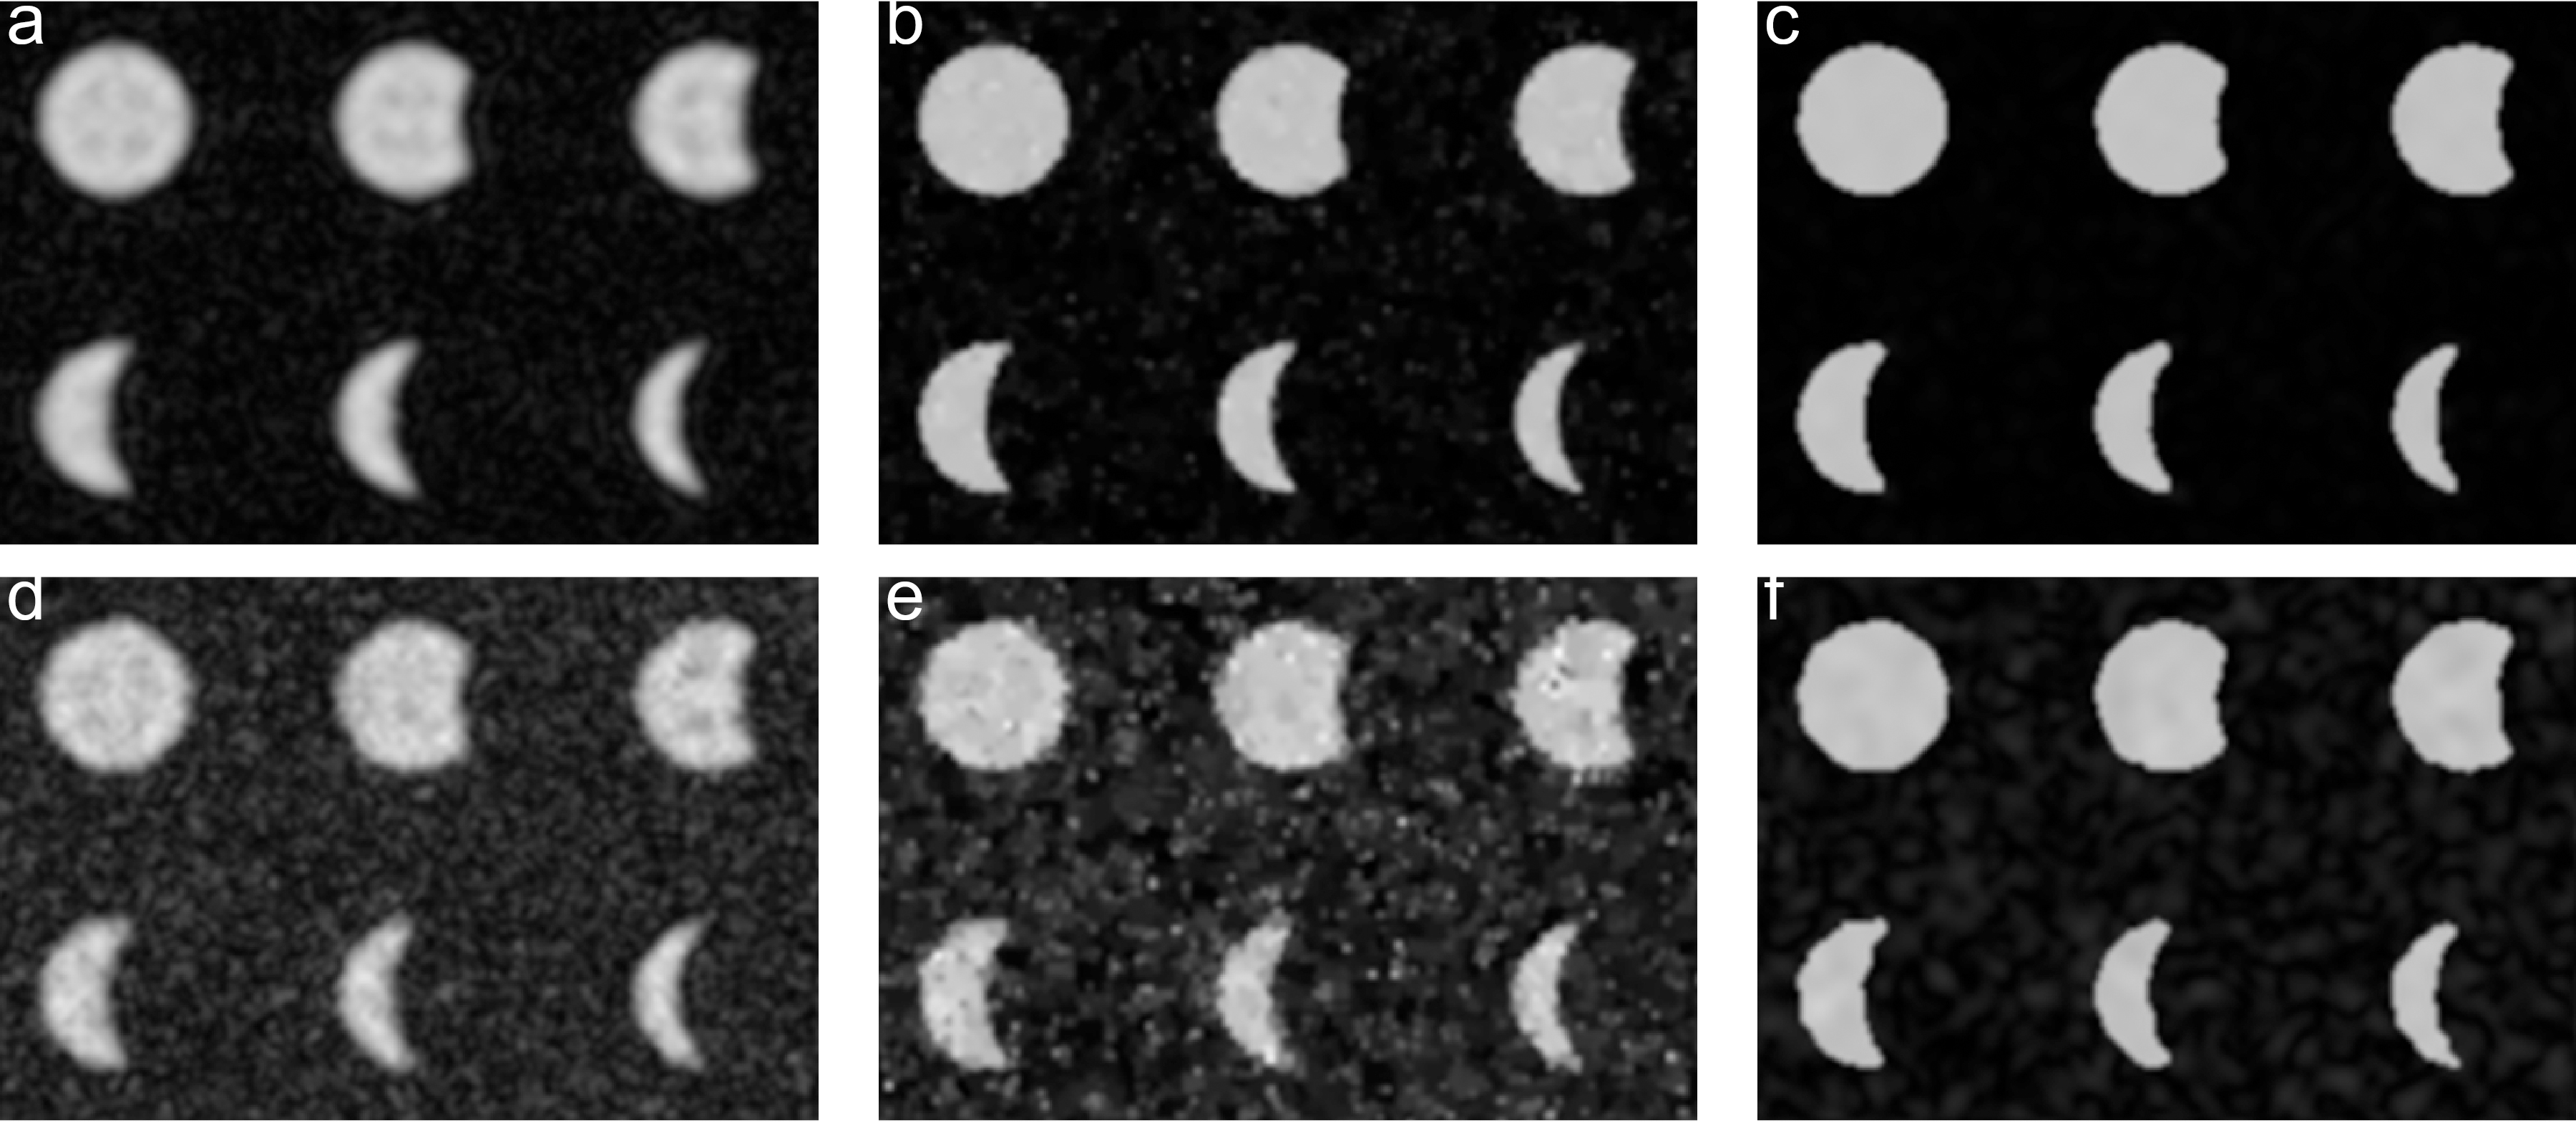
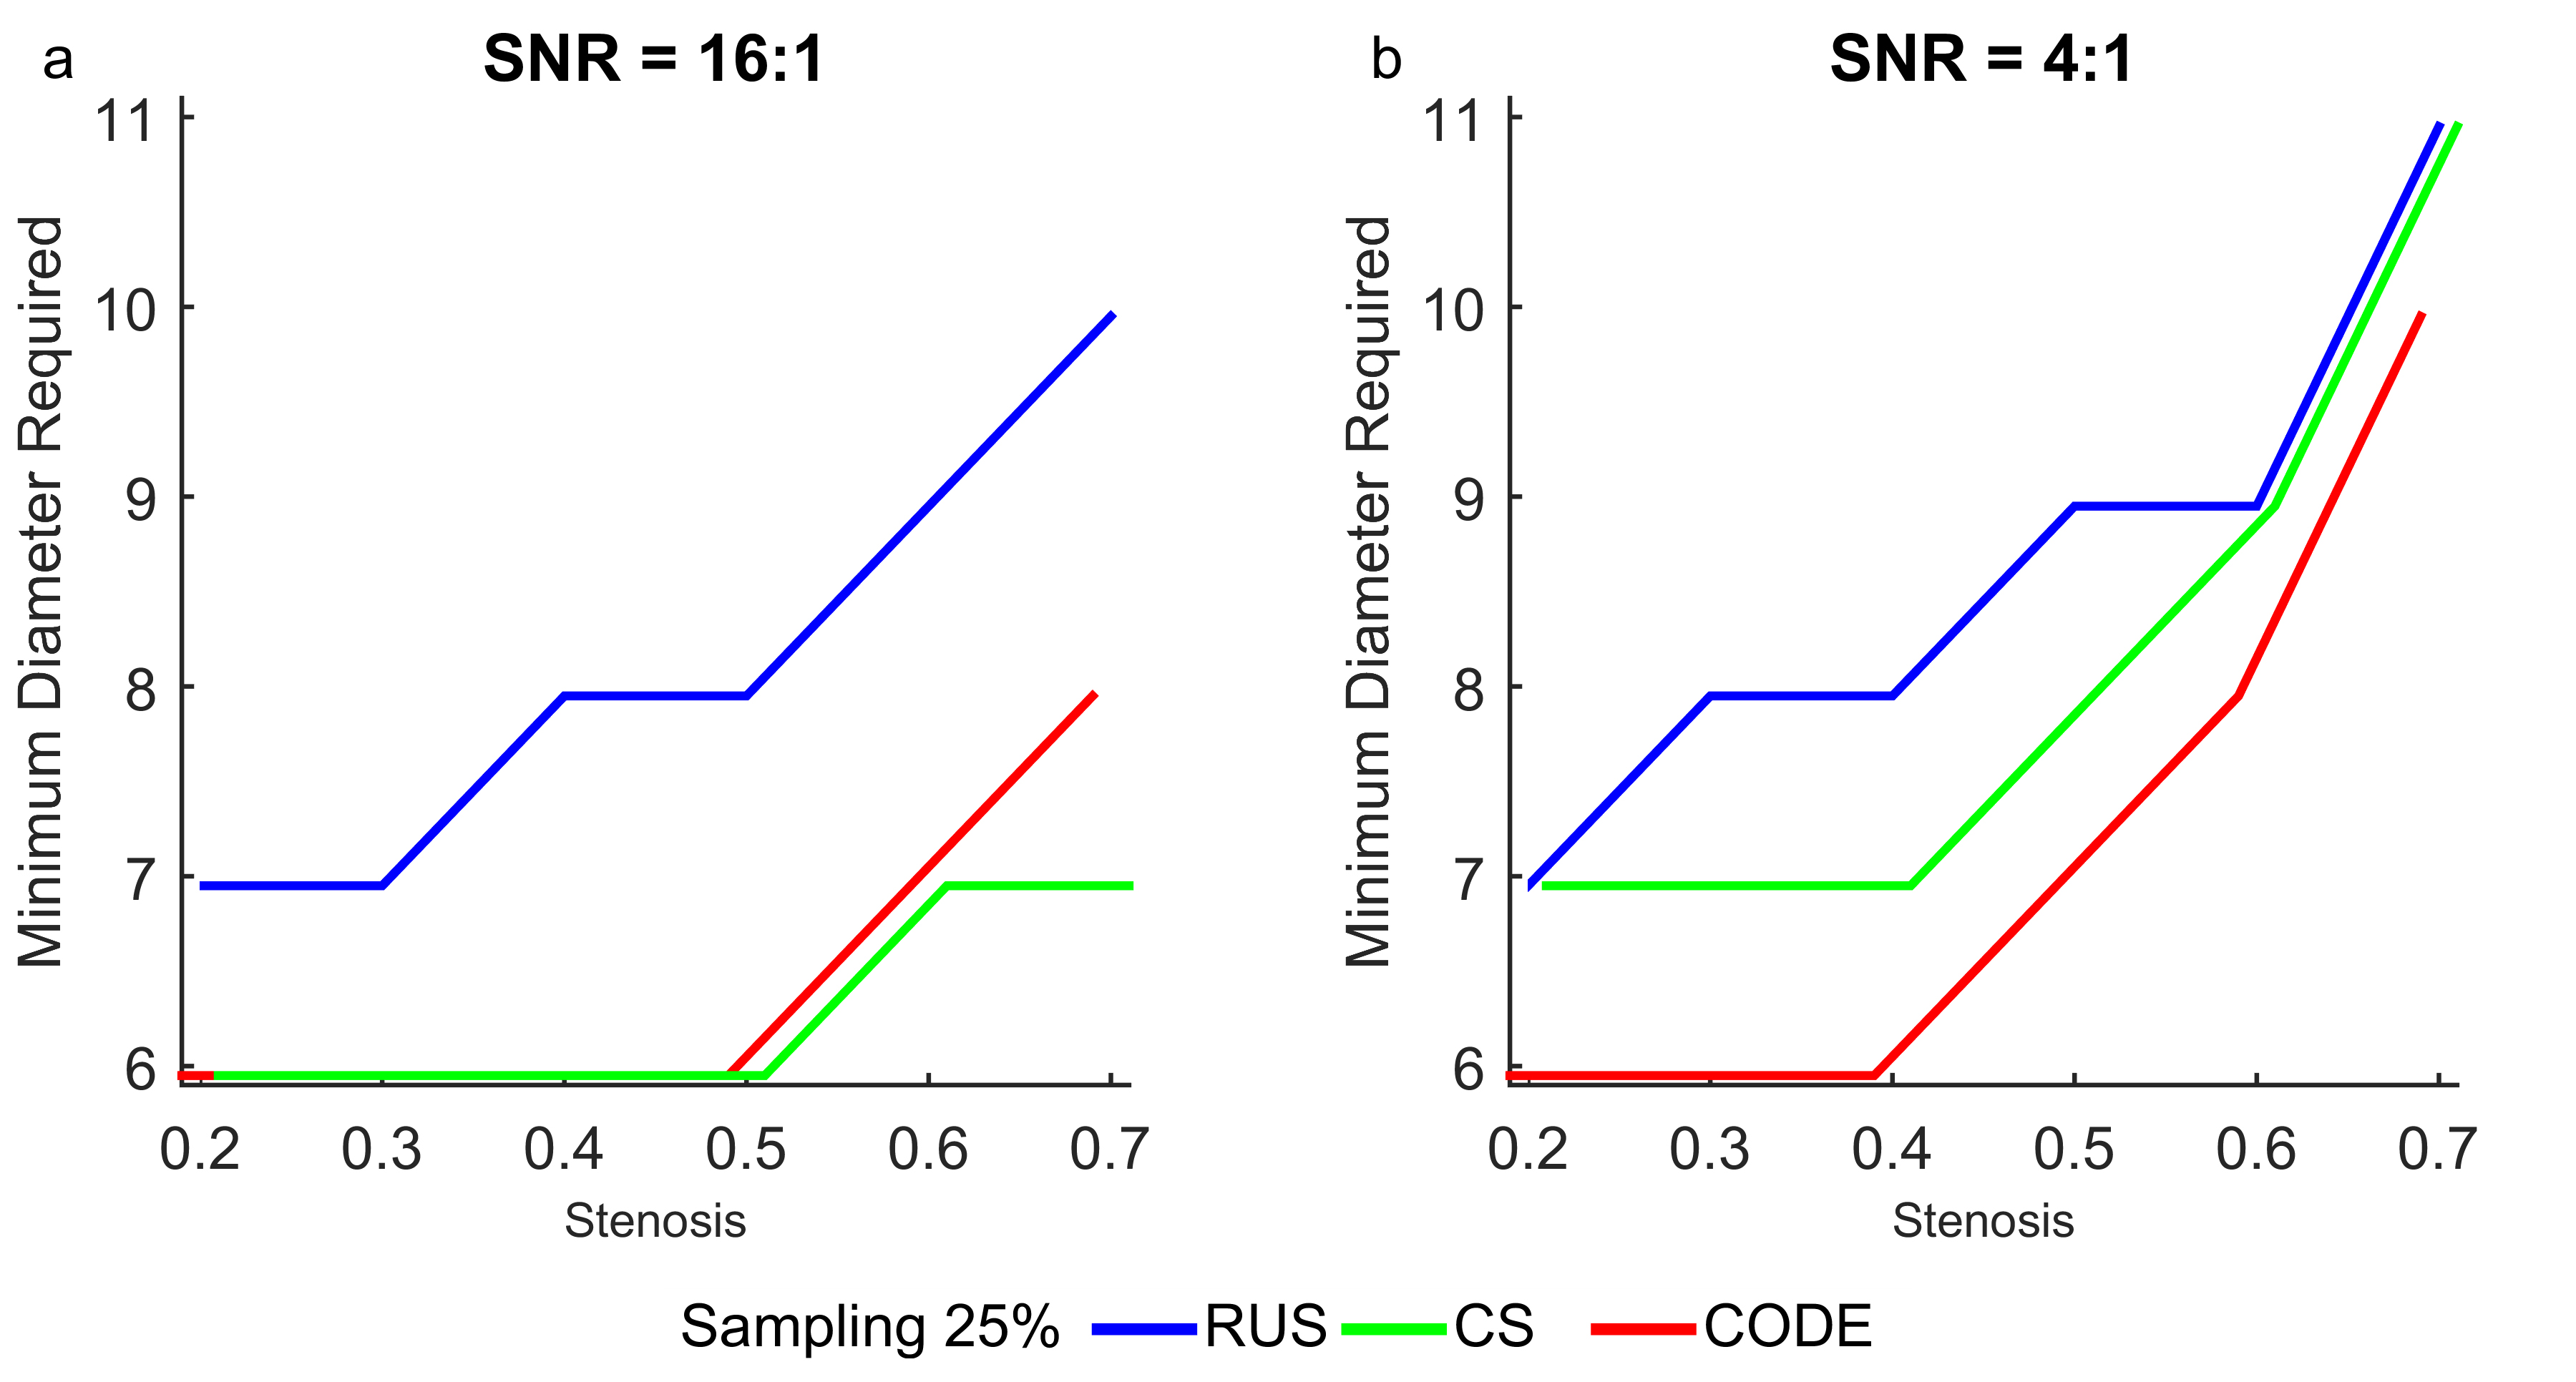
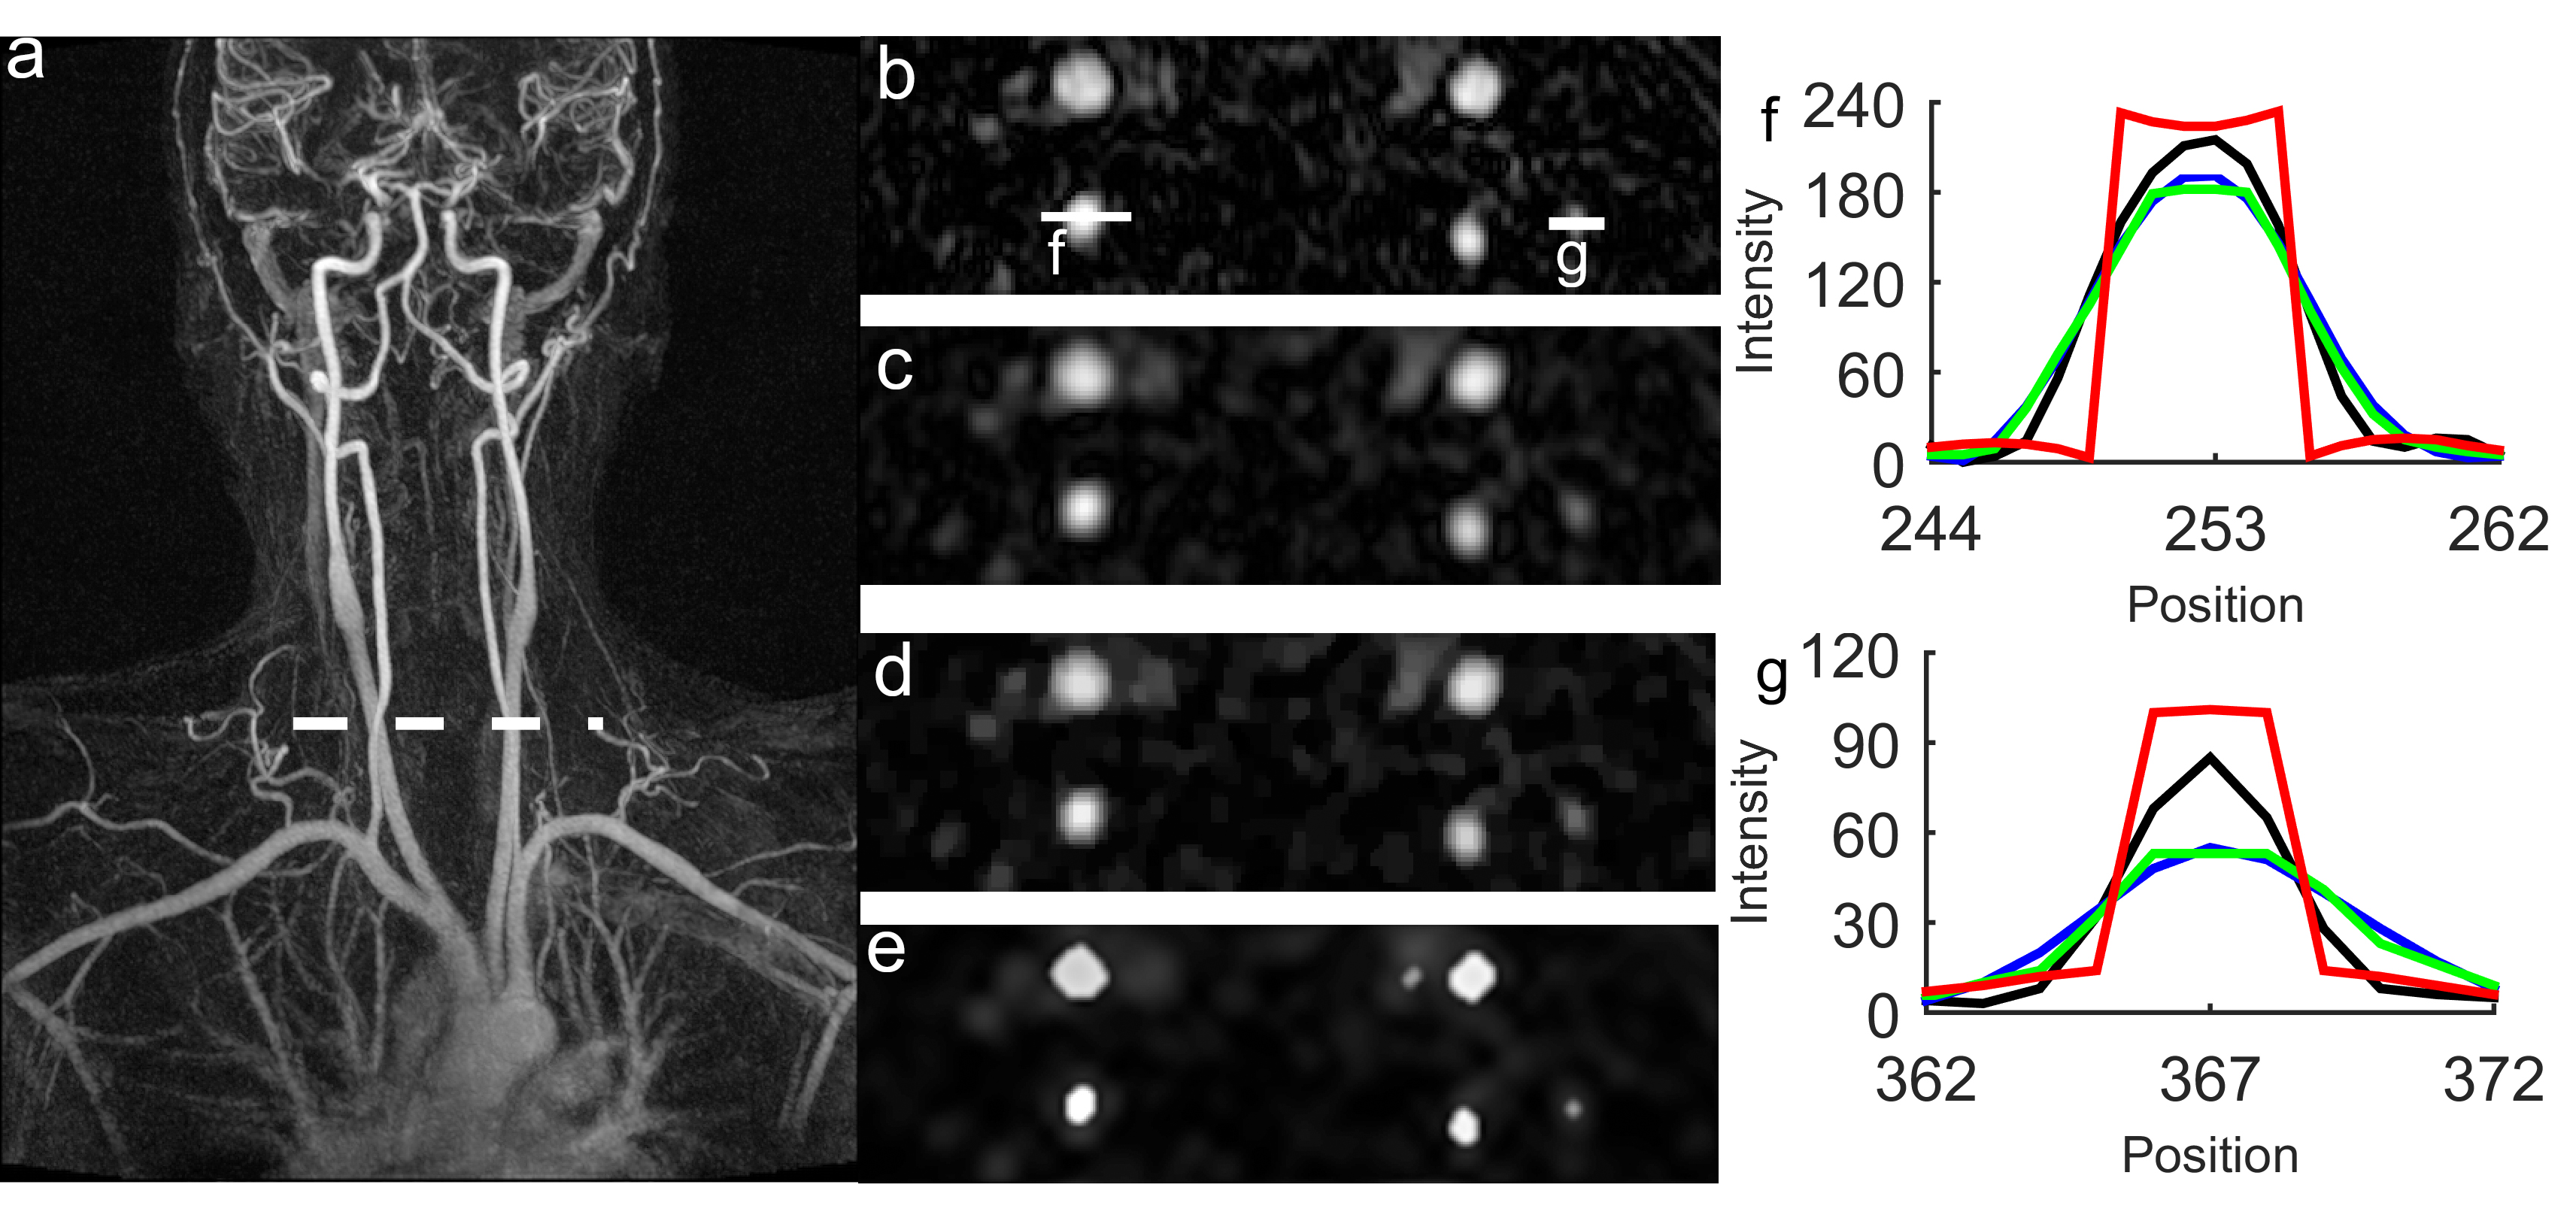
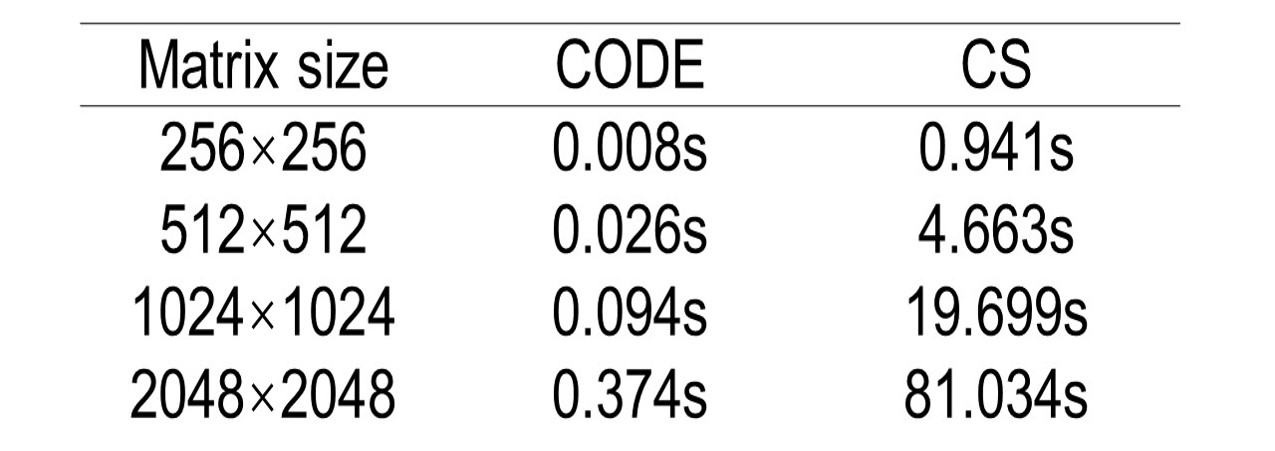
Figure 1 shows the reconstructed circles with 10%, 20%, 50%, 60%, and 70% stenosis and non-stenosis with different noise levels for 25% sampling. CS provides good reconstructions even for the smallest structures with high SNR (16:1), but not for low SNR (4:1). On the other hand, CODE gives clear images with sharp edges even when the SNR is 4:1. However CODE didn’t perform as well on the smallest structures. Figure 2 shows the profile of the required minimum diameter of vessels versus the measured stenosis within 5% deviation of the correct answer for high and low SNR cases. CS could estimate 50% (70%) stenosis of vessels with a diameter equal to 6 (7) pixels at high SNR and high sampling rate, but can’t give an accurate stenosis diagnosis at low SNR and low sampling rate even for the vessel with diameter less than 8 (11) pixels. On the other hand, with CODE, we could diagnose the 50% (70%) stenosis for the vessel with a diameter equal to or greater than 7 (10) pixels for any SNR. All diameters were measured from the 256x256 matrix data. For the simulated data, we also recorded the reconstruction time for CODE and CS (Table 1). All reconstructions were performed by MATLAB 2015a on a workstation, Intel CPU i7-3770 with 4 cores and 16GB RAM. Figure 3 shows the 3D CE MRA. We find CS is blurrier while CODE provides sharper edges. For big vessels, both CS and CODE performed well. For smaller vessels, CODE provides sharper edges and has comparable CNR with FS.Discussion and Conclusions
Both CS and CODE can speed up data acquisition by a factor of 4 relative to the full k-space to obtain an acquisition time of roughly 3 seconds with symmetric k-space sampling. CS can reconstruct small structures well and estimate stenosis accurately at high SNR. But CS doesn’t work well for low SNR. CODE is more robust and gives an accurate measure of 50% (70%) stenosis for vessels with a diameter of 7 (10) pixels in the original 256x256 image even for low SNR data (4:1). Several more advantages of CODE include: retaining good CNR; giving sharp edges; having symmetric k-space coverage; having at least 100 times faster reconstruction times than CS, not requiring random sampling of k-space and can be used on any scanner.Acknowledgements
This work was supported in part by ECNU Fund for short term overseas academic visit.References
1. Hadizadeh DR, Urbach H, Willinek WA. Magnetic Resonance Angiography. Springer New York, 2012.
2. Liu S, Buch S, Chen Y, et al. Susceptibility-weighted imaging: current status and future directions. NMR Biomed 2016.
3. Bendok BR, Naidech AM, Walker MT, Batjer HH. Hemorrhagic and ischemic stroke: medical, imaging, surgical and interventional approaches. New York: Thieme; 2012.
4. Jiang J, Kokeny P, Ying W, et al. Quantifying errors in flow measurement using phase contrast magnetic resonance imaging: comparison of several boundary detection methods. Magn Reson Imaging 2015; p 185-193.
5. Lustig M, Donoho D, Pauly J M. Sparse MRI: The application of compressed sensing for rapid MR imaging. Magn Reson Med 2007; p 1182-1195.
6. Goldstein T, Osher S. The split Bregman method for L1-regularized problems. SIAM J Imaging Sci 2009; p 323-343.
7. Haacke E M, Feng W, Utriainen D, et al. Patients with multiple sclerosis with structural venous abnormalities on MR imaging exhibit an abnormal flow distribution of the internal jugular veins. Journal of Vascular and Interventional Radiology, 2012: p 60-68.
Figures