4742
Comparison of R1ρ dispersion in human brain between 3T and 7T1Radiology and Radiological Sciences, Vanderbilt University Institute of Imaging Science, Nashville, TN, United States
Synopsis
Previous studies have indicated that R1ρ (= 1/T1ρ) dispersion may be dominated by chemical exchange processes at higher fields, and the dispersion may be used to quantify exchange processes between water and labile protons, mainly amides and hydroxyls. At 3T some biological tissues with high macromolecular protein content may demonstrate a considerable dispersion, but fat and water rich tissues typically have a negligible R1ρ dispersion. In this study, we observed that the degree of R1ρ dispersion in white matter at 7T was more than three times the dispersion at 3T, confirming that chemical exchange is a major contribution to R1ρ and suggesting R1ρ dispersion at higher fields may help to characterize tissue physicochemical properties.
Introduction
R1ρ (= 1/T1ρ) is sensitive to slow macromolecular interactions but also may vary with the spin-locking fields used. At higher magnetic fields (3T and beyond), this dispersion may be dominated by chemical exchange processes so that the dispersion may be used to characterize tissue composition and physicochemical properties.1-3 The degree of R1ρ dispersion is tissue specific and depends on the composition and exchange rates of constituent molecules that exhibit chemical exchange between water and labile protons (mainly amides and hydroxyls). If chemical exchange is significant the magnitude of the dispersion should depend strongly on the magnetic field. In this study, we compared the R1ρ dispersion in human brain at 3T and 7T scanners. At 3T there is a small dispersion in both white matter and gray matter in the brain, but this dispersion increased significantly (by more than three fold) in white matter at 7T, whereas R1ρ dispersion in gray matter remains similar at both magnetic fields. This observation suggests that R1ρ dispersion at 7T (ΔR1ρ, the difference of R1ρ between low and high locking fields) is dominated by chemical exchange processes in white matter, which may be sensitive to subtle changes in composition or pH.Methods
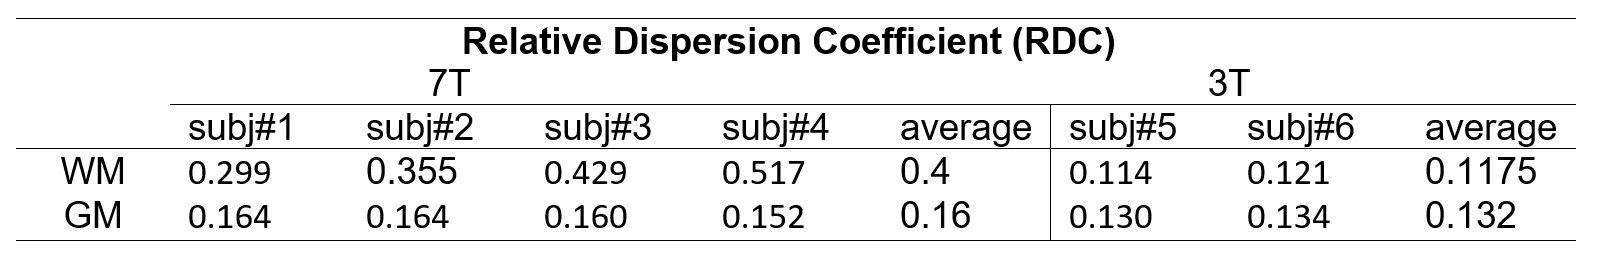
Six healthy volunteers (aged 24 to 37 with a median age of 29.5) were recruited in this study. Two subjects participated in 3T imaging and the other four were imaged at 7T. Both the scanners were Philips Achieva systems (Philips Healthcare, Best, the Netherlands) and the same strategy was used for T1ρ data acquisition (T1ρ pre-pulse4 followed by a TSE readout). The 3T T1ρ imaging was acquired using a Philips 8-channel head coil, with FOV=220 x 220mm2, pixel size = 2 x 2mm2, thickness = 3mm, TR/TE = 5500ms/10ms, NSA = 1. Five spin-locking times (TSL) [2ms, 22ms, 42ms, 62ms, 82ms] were combined into a single scan for T1ρ calculations, resulting in a scan time of 3min 18sec. The T1ρ experiment was repeated at different spin-locking fields (FSL) [0Hz, 50Hz, 100Hz, 300Hz, 500Hz] to construct the dispersion curve. The 7T T1ρ imaging followed the same procedures but used a 32-channel NOVA head coil. Other parameters were: FOV = 240 x 240mm2, pixel size = 1 x 1mm2, thickness = 4 mm, TR/TE = 8000ms/55ms, NSA = 1, each T1ρ acquisition took 2min 48sec (with SENSE acceleration). After acquisition, an R1ρ map at each spin-locking frequency was calculated by fitting the signal intensity vs TSL to a three-parameter mono-exponential model on a pixel-wise basis. The R1ρ dispersion was assessed on both white matter and gray matter regions. To quantify the degree of a dispersion curve, a relative dispersion coefficient (RDC) was defined as: RDC = (R1ρ,max - R1ρ,min)/(R1ρ,max + R1ρ,min), where R1ρ,max and R1ρ,min represent the maximum and minimum of the R1ρ values on the dispersion curve.Results
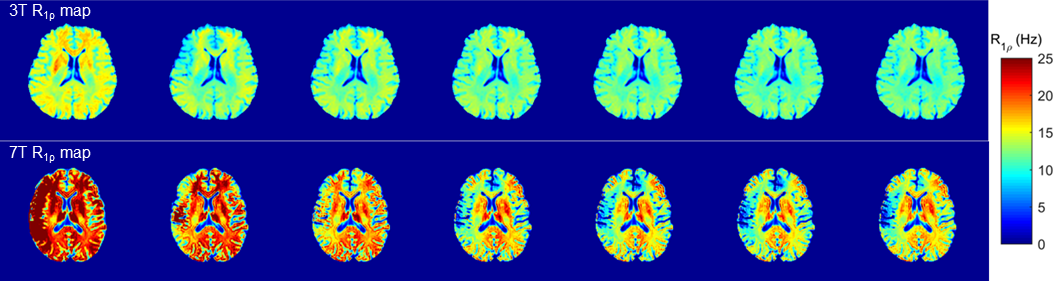
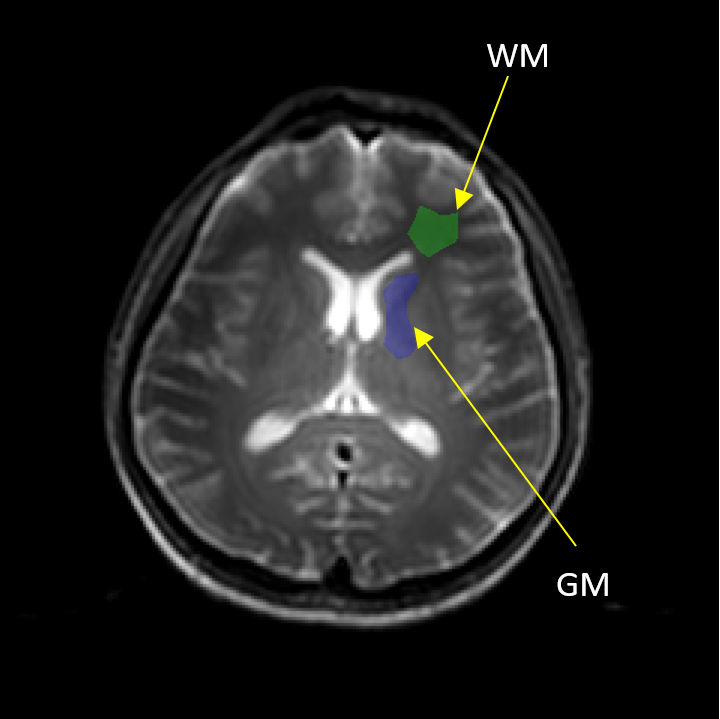
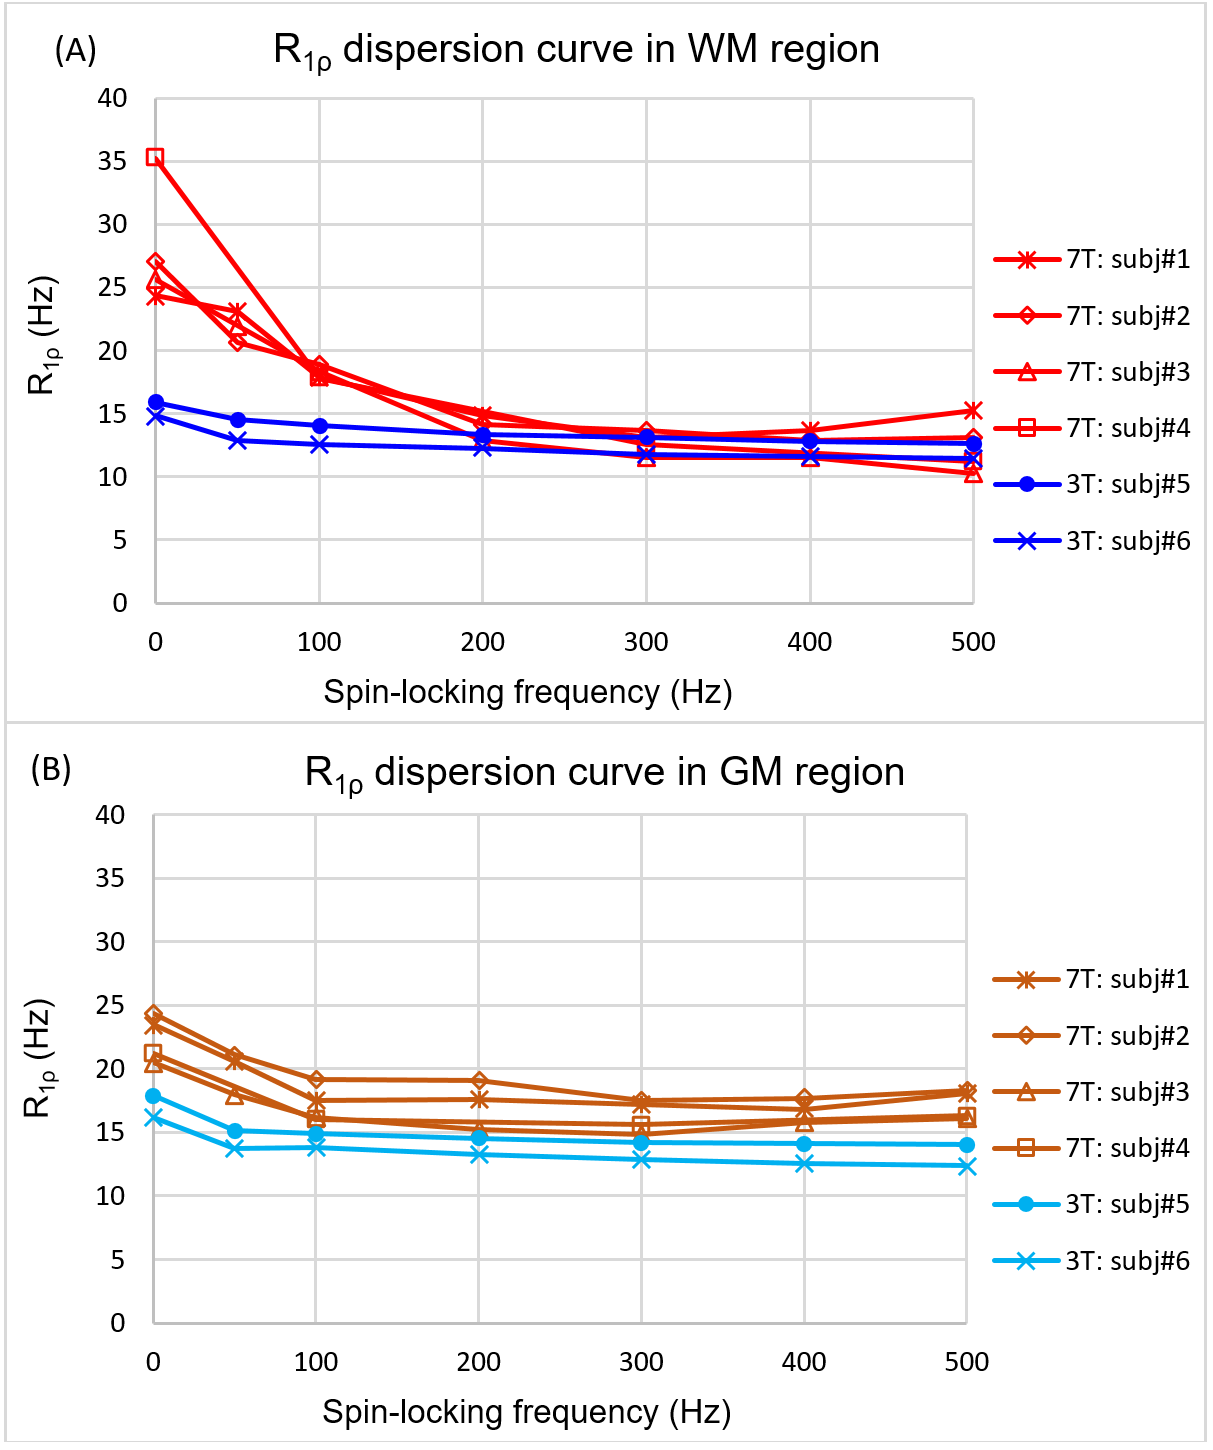
Figure 1 shows the comparison of R1ρ maps between 3T and 7T at each FSL, it is seen that the overall R1ρ value at 7T is great than 3T. Also because the 7T scanner is more susceptible to field inhomogeneities, the R1ρ map at 7T appears less uniform than 3T. Figure 2 indicates the selected regions of interest (ROIs) from white matter and gray matter, and the dispersion curves for these regions are plotted in Figure 3. It is clear that more pronounced R1ρ dispersion is observed in white matter at 7T over 3T, whereas the dispersion in gray matter remains similar between the two magnetic fields. Through quantitative analyses (shown in Table 1), the relative dispersion coefficient in white matter at 7T is more than three times that at 3T (average RDC of 0.4 vs 0.1175), while they are close in the gray matter region (average RDC of 0.16 at 7T vs 0.132 at 3T).Discussions
Biological tissues containing high concentrations of amides, amines, hydroxyls or other protons that exchange at appropriate rates may demonstrate a considerable dispersion in R1ρ, but fat and water rich tissues typically have a negligible R1ρ dispersion. It has been shown in this study that the R1ρ dispersion in white matter at 7T is much greater than 3T, while the dispersion at the two fields remains similar in gray matter region, confirming that exchange is significant in white matter. Because gray matter contains more water and less myelin (and the associated hydroxyl groups of e.g. cholesterol), chemical exchange processes may be less relevant compared to white matter. For tissues with appropriate composition of exchangeable protons, R1ρ dispersion at higher field is expected to better characterize the tissue composition and physicochemical properties.Acknowledgements
No acknowledgement found.References
1. Cobb J, Xie J, Gore J. Contributions of chemical exchange to T1rho dispersion in a tissue model. MRM. 2011; 66(6):1563-1571.
2. Cobb J, Xie J, Li K, et al. Exchange-mediated contrast agents for spin-lock imaging. Magn Reson Med. 2012; 67(5):1427-1433.
3. Wang P, Block J, Gore J. Chemical Exchange in Knee Cartilage Assessed by R1ρ (1/T1ρ) Dispersion at 3T. MRI. 2015; 33(1):38-42.
4. Witschey W, Borthakur A, Elliott M, et al. Artifacts in T1ρ-Weighted Imaging: Compensation for B1 and B0 Field Imperfections. JMR. 2007; 186(1):75-85.
Figures