4741
ΔR1ρ, a potential indication for myelin concentration in white matter?1Radiology and Radiological Sciences, Vanderbilt University Institute of Imaging Science, Nashville, TN, United States
Synopsis
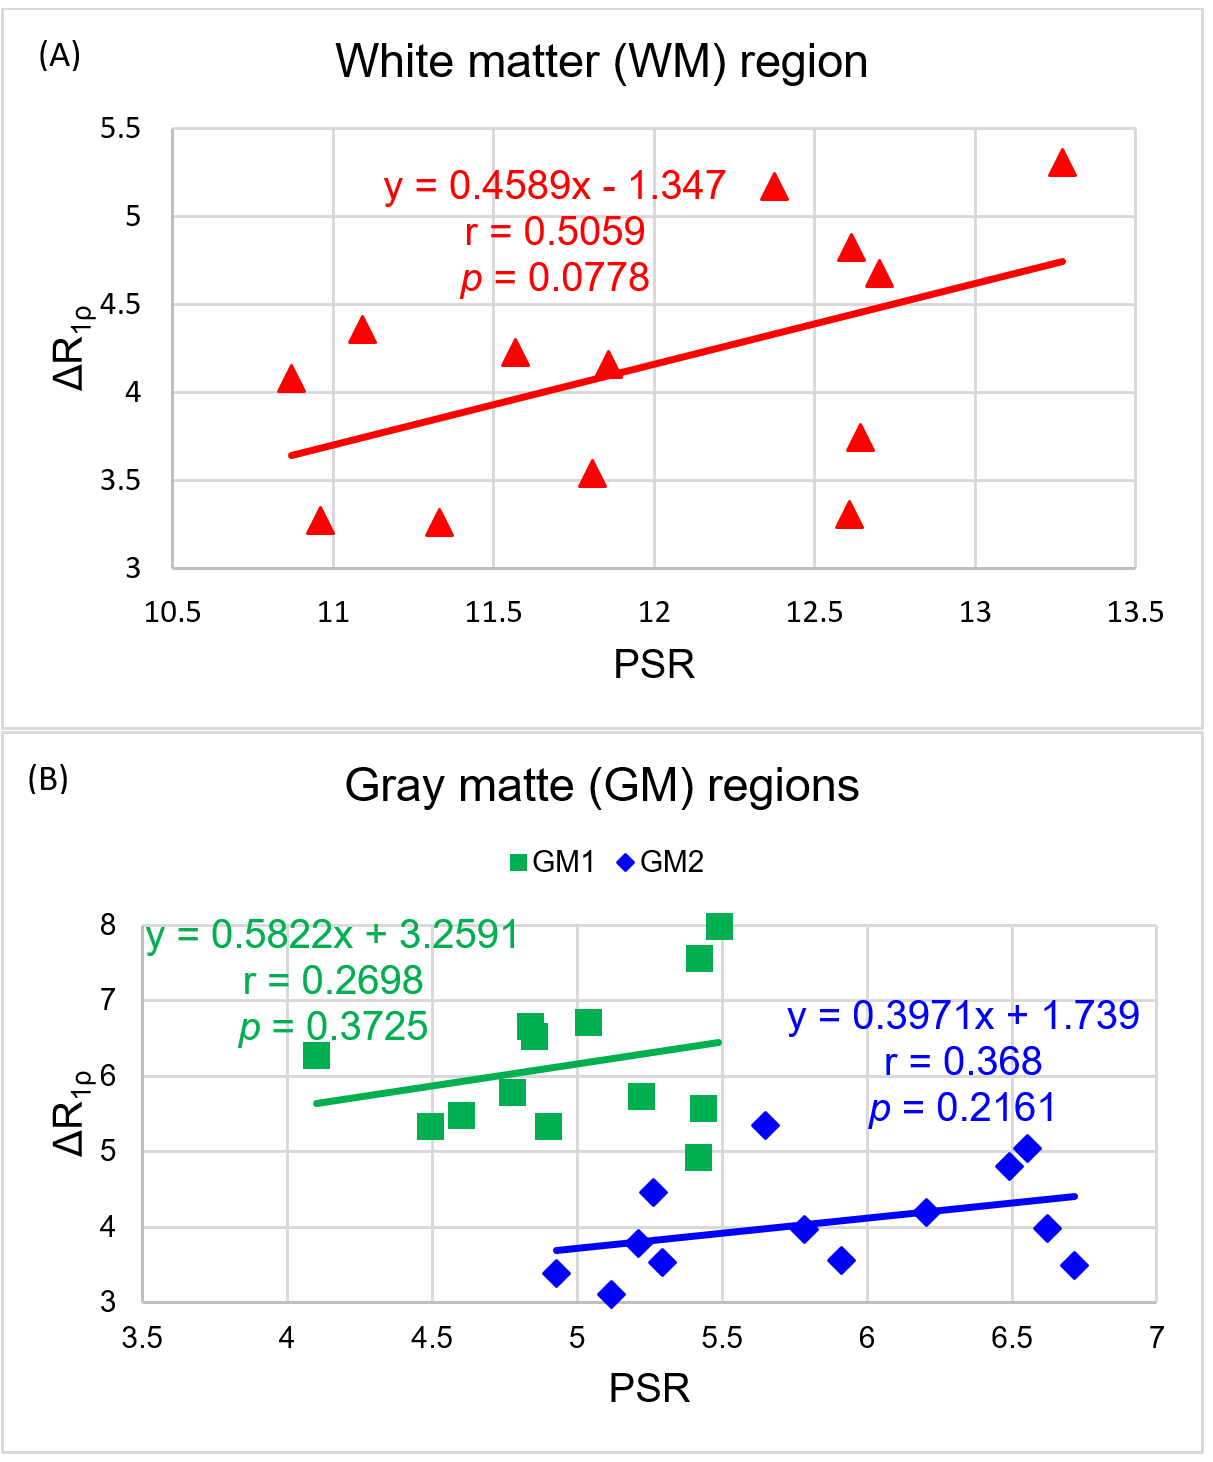
Previous studies have demonstrated that at high fields (3T and beyond), the difference of R1ρ between low and high spin-locking fields (ΔR1ρ) may reflect chemical exchange processes in biological tissues. This study aimed to investigate the possibility of using ΔR1ρ to assess the content of exchangeable protons in myelin in white matter by comparing ΔR1ρ with PSR (macromolecular to free pool size ratio from magnetization transfer imaging). The results show that ΔR1ρ and PSR have a much stronger correlation in white matter than in gray matter, inferring that ΔR1ρ might have a potential to evaluate myelin integrity.
Introduction
The difference of the rotating frame relaxation rate (R1ρ = 1/T1ρ) between high and low locking fields, i.e. ΔR1ρ, has been shown to be able to potentially assess chemical exchange processes between water and labile protons (mainly amides and hydroxyls) at high fields (3T and beyond).1-4 Previous studies have proposed that hydroxyl groups of cholesterol in myelin are the major locus for magnetization transfer (MT) in white matter of the brain,5,6 so we hypothesized that ΔR1ρ may have the potential to evaluate the content of exchangeable protons (for example hydroxyls) within myelin. PSR (the macromolecular to free pool size ratio calculated from MT imaging)7 also increases with myelin and thus can be used as a reference. We found that although not reaching statistical significance, the dependence of ΔR1ρ on PSR is much stronger (correlation coefficient r=0.5059, p=0.0778, slope = 0.4589) in white matter than in gray matter, which may infer the possibility of using ΔR1ρ to assess myelin integrity.Methods
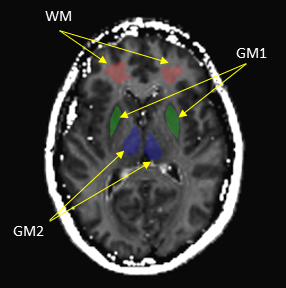
A total of thirteen (13) healthy subjects (aged 25 to 73 with a median age of 39) were included in this study. T1ρ and MT images of oblique transaxial slices were acquired in each volunteer (parallel to AC-PC line) on a Philips 3T Achieva scanner using an 8-channel head coil (Philips Healthcare, Best, the Netherlands). T1ρ data were acquired using a T1ρ pre-pulse8 followed by a Turbo Spin Echo (TSE) sequence, with parameters: FOV: 240×240mm2, pixel size: 1×1mm2, slice thickness: 4mm, TR/TE = 5000ms/10ms, TSE factor = 15, NEX = 1. Five spin-locking times (TSL) [2ms, 22ms, 42ms, 62ms, 82ms] were combined into a single scan for T1ρ calculations, resulting in a scan time of 6min45sec. The T1ρ measurement was repeated at two different spin-locking fields (FSLs) 0Hz and 500Hz for the calculation of ΔR1ρ = R1ρ(0Hz) - R1ρ(500Hz). The MT scan was performed based on a selective inversion recovery (SIR) technique7 with the same geometry as the T1ρ imaging. Other parameters were: inversion times (ti) logarithmically spaced between 10ms and 2s (15 values) and ti = 10s, predelay time = 2.5s, block inversion pulse duration = 1ms, number of echoes = 24, echo spacing = 5.9ms, TR/TE: 2724ms/74ms, NEX = 2, total scan time 4min4sec. The macromolecular to free pool size ratio PSR was calculated by fitting the SIR data to previously derived signal equations.9 Finally, regions of interest (ROIs) were drawn manually on the white matter and gray matter for each subject, and the correlation between ΔR1ρ and PSR on these regions was evaluated by a linear regression analysis with correlation coefficient (r) and p value reported. Data processing was performed using custom MATLAB (R2013a) scripts. ImageJ (NIH, version 1.49v) was used for ROI drawing and signal intensity measurements.Results
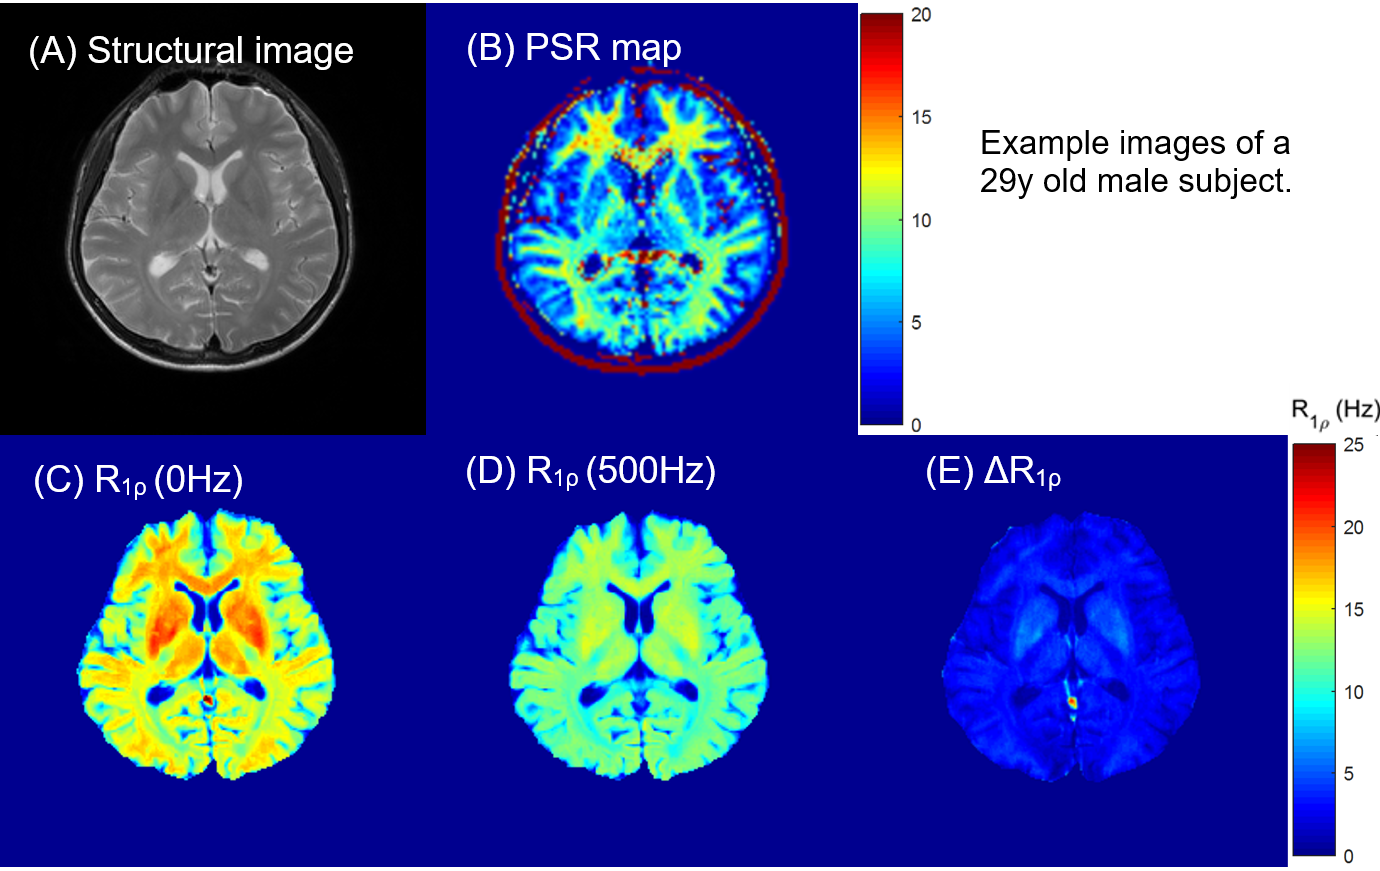
Figure 1 shows sample images from one volunteer. The PSR map exhibits clear distinction between white matter and gray matter in the brain. The overall R1ρ values in white matter are greater than in gray matter. Figure 2 indicates the selected ROIs of white matter and gray matter, and the correlation between ΔR1ρ and PSR is shown in Figure 3. Although not reaching a statistical significance, Figure 3 demonstrates that the correlation between ΔR1ρ and PSR in white matter is much stronger than in gray matter, as evidenced by r = 0.5059 and p = 0.0778 for WM vs. r = 0.368 and p = 0.2161 for GM1 (or r = 0.2698 and p = 0.3725 for GM2).Discussions
ΔR1ρ reflects the degree of R1ρ dispersion that may be dominated by chemical exchange at high magnetic fields (3T and beyond), so R1ρ dispersion can in principle provide a more complete characterization of tissue composition and physicochemical properties. Because ΔR1ρ requires only two scans, significant time can be reduced compared to acquiring a complete dispersion curve, which makes ΔR1ρ more feasible in clinical practice. Our data show here that ΔR1ρ is greater in white matter than in gray matter, which may be because gray matter contains more water and less myelin, so gray matter demonstrates minor R1ρ dispersion and has nearly negligible correlation with PSR. Also although the contributors to the contrasts of MT and ΔR1ρ are not completely the same, a strong trend between ΔR1ρ and PSR in white matter was still observed, so a strong inference may be made that ΔR1ρ could be a potential biomarker for the assessment of myelin integrity.Acknowledgements
No acknowledgement found.References
1. Cobb J, Xie J, Li K, et al. Exchange-mediated contrast agents for spin-lock imaging. Magn Reson Med. 2012; 67(5):1427-1433.
2. Cobb J, Li K, Xie J, et al. Exchange-mediated contrast in CEST and spin-lock imaging. Magn Reson Imaging. 2014; 32(1):28-40.
3. Wang P, Zhu H, Kang H, et al. T1ρ dispersion in human calf muscle. ISMRM. 2016; 2827.
4. Wang P, Zhu H, Kang H, et al. Correlation between sodium and T1ρ dispersion in human calf muscle. ISMRM. 2016; 4515.
5. Fralix T, Ceckler T, Wolff S, et al. Lipid bilayer and water proton magnetization transfer: effect of cholesterol. Magn Reson Med. 1991; 18(1):214-23.
6. Koenig S. Cholesterol of myelin is the determinant of gray-white contrast in MRI of brain. Magn Reson Med. 1991; 20(2):285-291.
7. Dortch R, Li K, Gochberg D, et al. Quantitative Magnetization Transfer Imaging in Human Brain at 3T via Selective Inversion Recovery. Magn Reson Med. 2011; 66(5):1346-1352.
8. Witschey W, Borthakur A, Elliott M, et al. Artifacts in T1ρ-Weighted Imaging: Compensation for B1 and B0 Field Imperfections. JMR. 2007; 186(1):75-85.
9. Li K, Zu Z, Xu J, et
al. Optimized inversion recovery
sequences for quantitative T1 and magnetization transfer imaging. Magn Reson
Med. 2010; 64(2):491-500.
Figures