4740
Toward Real Time Estimation and Quality Assurance for Myelin Water Mapping in the Human CNS1Diagnostic and Interventional Radiology, University of Texas Health Science Center at Houston, Houston, TX, United States, 2Neurology, University of Texas Health Science Center at Houston, Houston, TX, United States
Synopsis
Reliable in vivo quantification and visualization of myelin spatio-temporal changes in the developing and aging human central nervous system (CNS) would help provide important surrogate markers of white matter integrity. However, high resolution whole brain myelin water fraction (MWF) mapping methods remain challenging and are not well-standardized and are not widely adopted due to ill-posed solutions of the sum-of-exponents problem in the presence of noisy measurements and excessive computation time due to iterative solutions. In this work, we report a rapid method to initialize the solution of the bi-exponential multi-compartment fit which was used along with a host of quality assurance measures to speed up the estimation of the MWF and corresponding compartmental T2 relaxation times using an improved and regularized non-negative least-squares (rNNLS). The sensitivity of the method to signal-to-noise ratio (SNR) and different values of MWF was investigated using a digital phantom. This method was applied to healthy and multiple sclerosis (MS) patients. Our analysis strategy accelerated the accurate mapping of high resolution MWF in the entire human brain in seconds and provided the spatial variability MWF across the corticospinal tract (CST) and callosal pathways.
Introduction
In myelinated white matter of the central nervous system (CNS), the T2-weighted signal may be modeled as the sum of two slowly non-exchanging water compartments 1,2, the water trapped between myelin and intra/extracellular water 3,4. Multi-compartment T2 relaxation modeling using magnitude measured signal Sm for N echoes seeks to solve the problem: Sfit(t(i))= A*exp(-t(i)/T2a)+B*exp(-t(i)/T2b)+...+Noise, where t stands for echo time, TE. In general, this ill-posed problem appears in several physical systems 3,4,5 and the regularized NNLS is the most common approach adopted to solve this problem by minimizing a cost function of the square sum-of-residuals, SSR = ∑ |Sm-Sfit|2, χ2 = SSR + λ |u2| for the unknowns: u = [A, T2a, B, T2b,..]; the myelin water fraction is defined as the ratio A/(A+B), assuming two compartments.
Methods
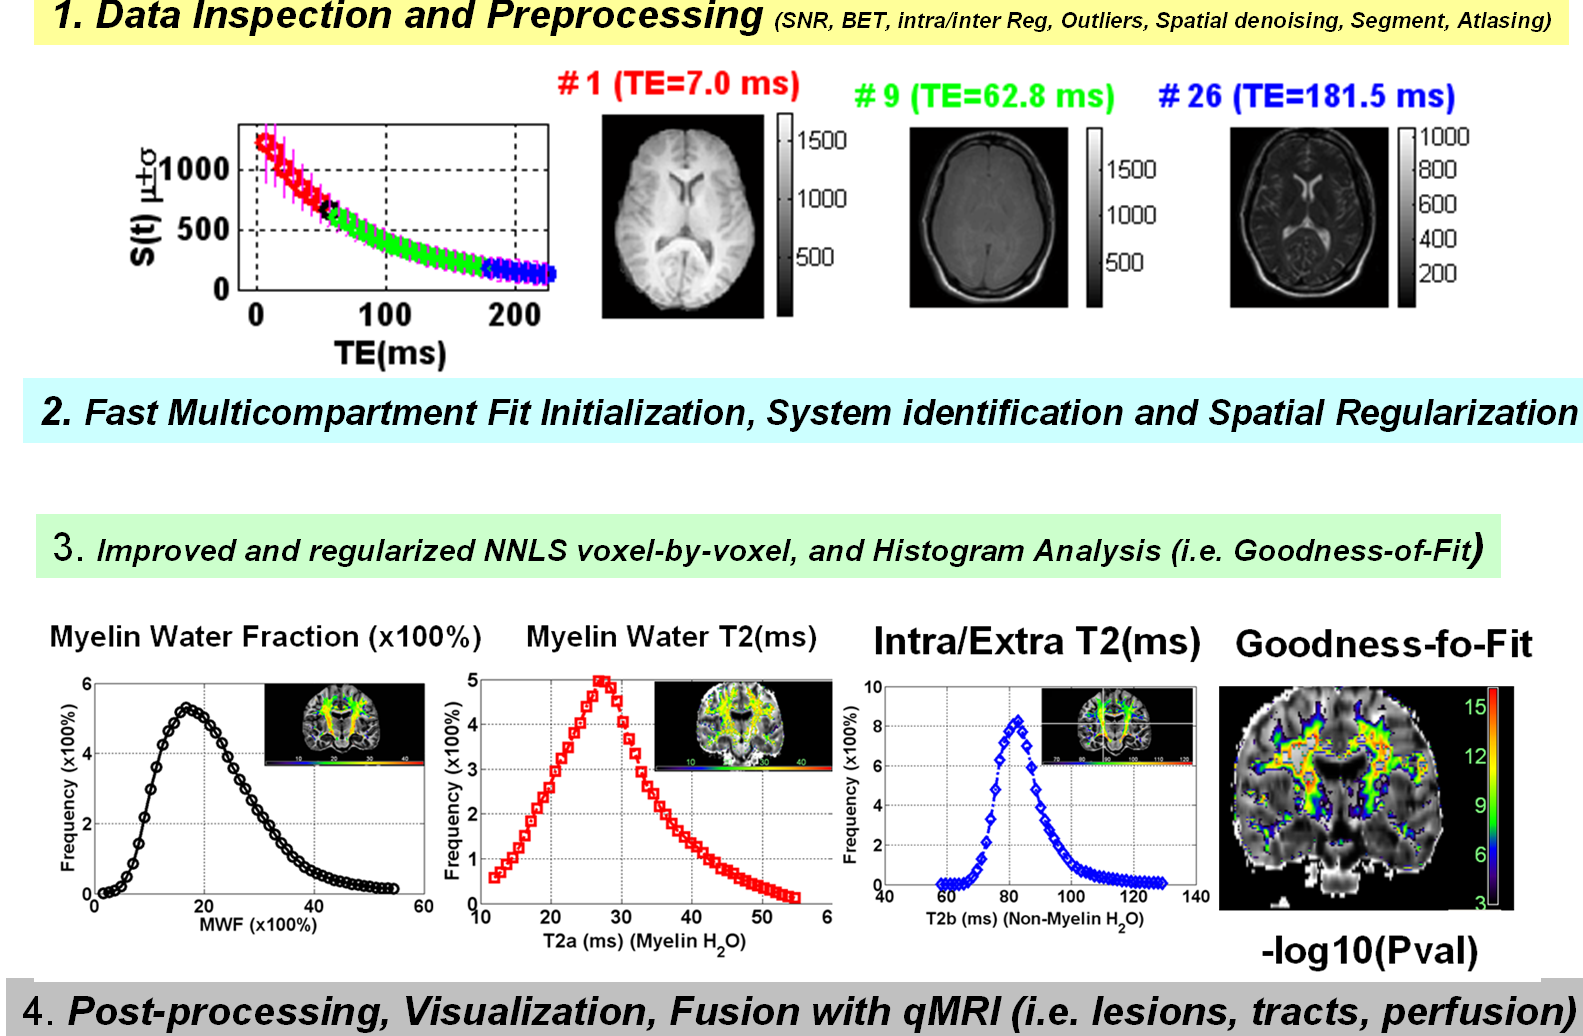
Digital Phantom: To study the parameter space of the multicompartment inverse problem, we created a digital phantom with size 401x401 pixels composed of 12 concentric rings to simulate the spatial variability of myelin in a human brain. Each zone in the phantom consisted of ~10,000 voxels that are assigned true T2a (15 ms), T2b (100 ms), and MWF values between 0.01 to 0.35. These values can be modified to study the effects of T2a or T2b at constant MWF. Normally-distributed Gaussian noise is added in quadrature to simulate an actual MRI data acquisition. Initialization of the solution: An initial solution of the multicompartment problem parameters was attempted by successive linear-inversion and variable projection of the non-linear problem. 6 We also implemented a system identification approach to select the number of compartment.7 This initial stage provided the spatial priors to help reduce the search and avoid multiple local minima.3-7 Using MATLAB we implemented an iterative rNNLS procedure that utilized the analytical initialization. We also provide goodness-of-fit or F-map to test the statistical significance of the single exponential model with N-2 degrees-of-freedom over the biexponentntial model with N-4, F=[SSRmono/(N-2)]/[SSRbi/(N-4)], where N is the umber of echoes used. In vivo Human Brain measurements: To test our procedures and demonstrate clinical utility, we acquired whole brain MRI data from healthy adults and patients diagnosed with MS on a 3T Ingenia clinical scanner. Multiecho T2-weighted volumes were acquired in the axial plane with a 3D-gradient and spin-echo (GRASE) sequence.8 Acquisition parameters for the GRASE sequence were: TR~1000 ms, number of echoes = 32, first echo TE=7 ms, last echo TE= 24 ms; Field-of-Fiew=256x256 mm2, matrix size=256x 256, slice thickness = 2 mm, number of slices = 66, in-plane resolution ~ 2x2 mm2 interpolated in k-space to 1x1 mm2. The duration of GRASE sequence was ~ 10 min. We also acquired high resolution T1-weighted and diffusion tensor data for anatomical information.Results
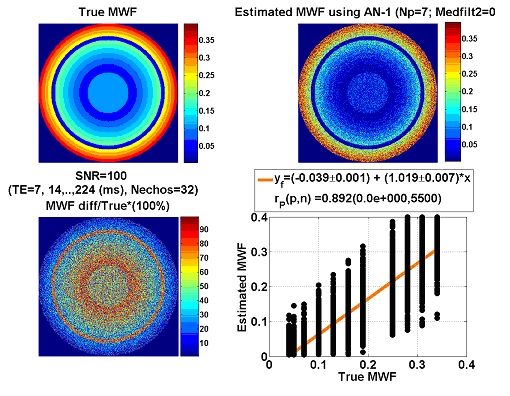
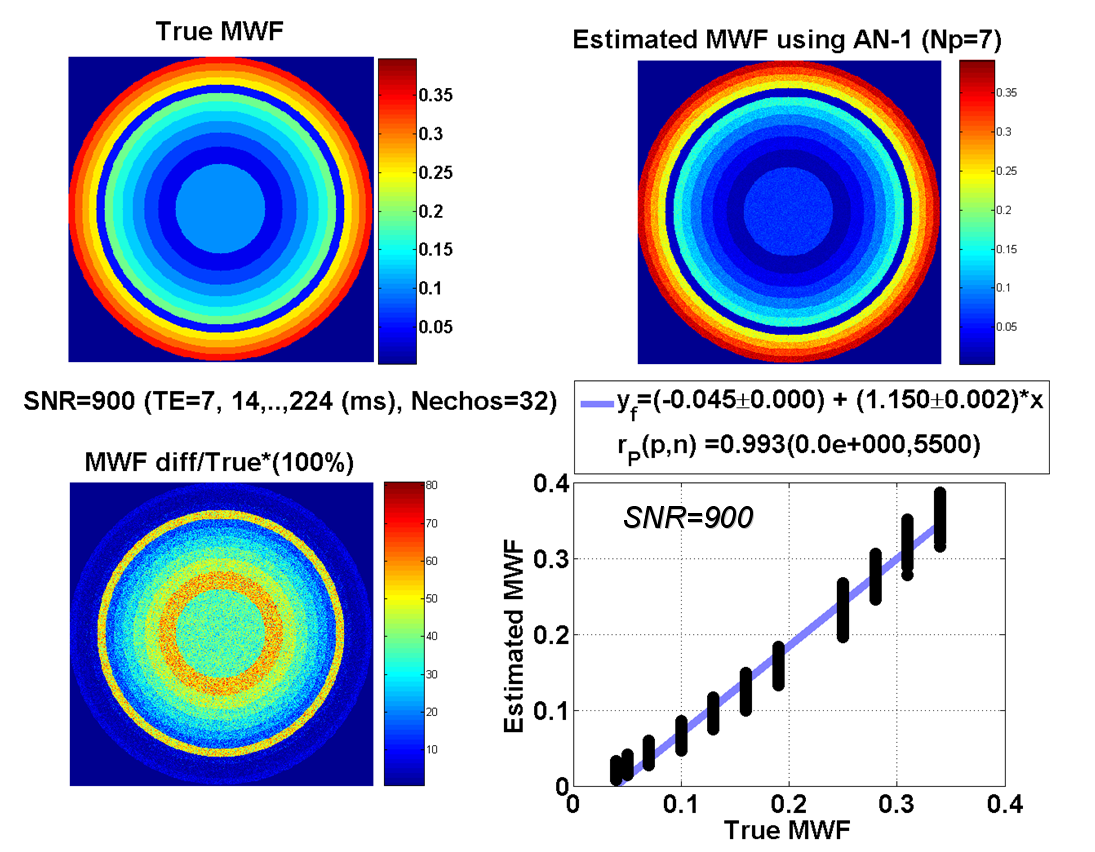
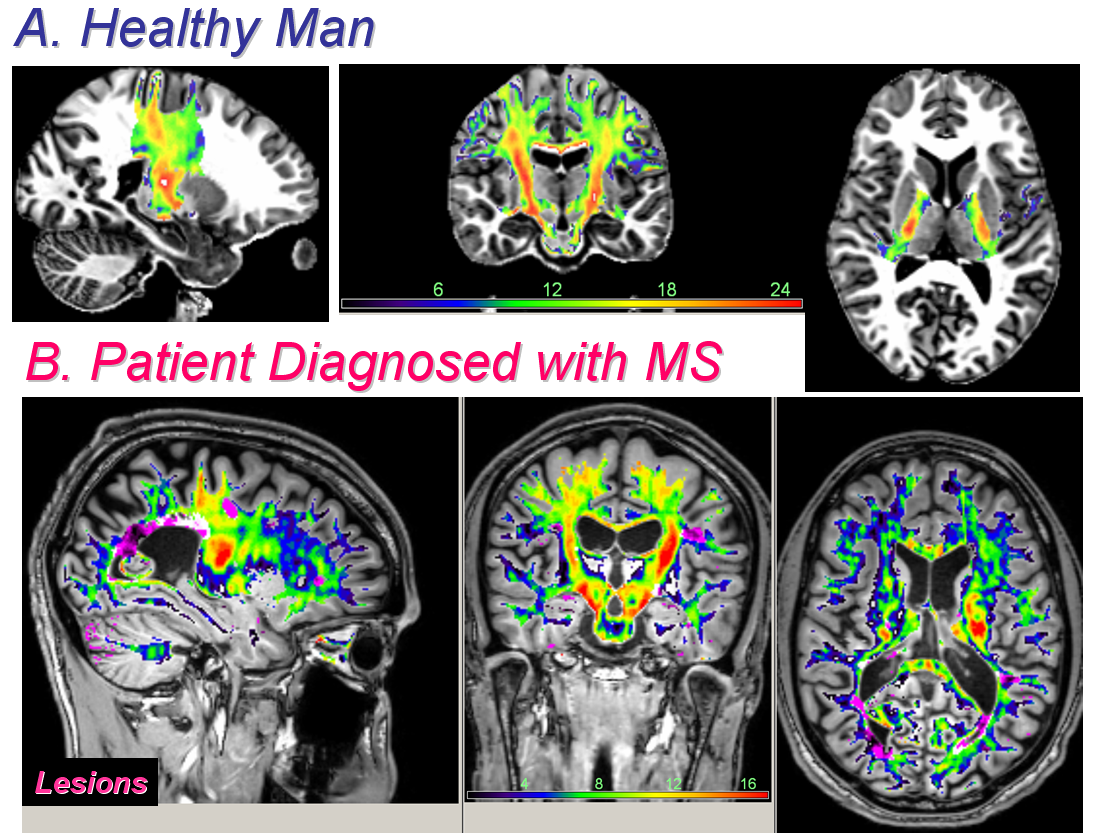
Figure 1 shows the digital phantom used for simulations. We studied and simulated our MRI data acquisition protocol with TE=7, 14, 21,.., 214 ms assuming true T2b=100ms and T2a=15 ms and optimized the initial guess parameters accordingly. The expected or true MWF is compared at two levels of SNR = 100 (Fig.2) and SNR=900 (Fig. 3) to the actual values obtained from the initialized and improved rNNLS approach by taking the percentage difference |Estimated-True|/True*100%. Note the accurate initial guess and the ability to predict the true values. The quality assurance measures used are summarized in Fig. 4 and applied to human brain measurements from an adult healthy control and one MS patient (Fig. 5). Figure 5 shows clearly the spatial distribution of the MWF across the CST which seems to have the largest MWF at the level of posterior limb of internal capsule (plIC).Discussion
Myelin water mapping has been challenging due to the ill-posed inverse problem in the presence of noise and absence of histological data. Requirements for single slice, high SNR and computation time challenged the widespread use of the methods to whole brain high spatial resolution applications including extended fiber tracts such as CST and even entire corpus callosum. Our digital phantom simulations (Fig. 2 & Fig 3) show the high demand for SNR to map accurately MWF in particular regions with low values. We also showed the range and distribution of expected myelin water and relaxation time values (Fig.4). The histological 9,10 and pathological correlates of the MWF maps across the CST (Fig. 5) require cross-sectional and serial studies. Provision of a simple analytical inversion offered rapid spatial priors and regularization that helped the rNNLS converge accurately to help optimize the acquisition parameters.
Conclusions
We presented a method that provided rapid and accurate initialization of the non-linear multi-compartment problem. We provided sensitivity analysis using both digital phantom and brain measurements to demonstrate utility for high spatial resolution measurements of myelin in the entire brain.Acknowledgements
No acknowledgement found.References
1. Laule C, Vavasour IM, Kolind SH, Li DK, Traboulsee TL, Moore GR, MacKay AL. Magnetic resonance imaging of myelin. Neurotherapeutics. 2007;4(3):460-84. Review.
2. Alonso-Ortiz E, Levesque IR, Pike GB. MRI-based myelin water imaging: A technical review. Magn Reson Med. 2015;73(1):70-81.
3. Bjarnason TA, Mitchell JR. AnalyzeNNLS: Magnetic resonance multiexponential decay image analysis. J Magn Reson 2010;206:200–4.
4. Graham SJ, Stanchev PL, Bronskill MJ. Criteria for analysis of multicomponent tissue T2 relaxation data. Magn Reson Med 1996;35(3):370–8.
5. Istratov AA, Vyvenko OF. Exponential analysis in physical phenomena. Rev. Sci. Instrum. 1999; 70(2):1233–1257.
6. Vidarsson L, Conolly SM, Lim KO, Gold GE, Pauly JM. Echo Time Optimization for Linear Combination Myelin Imaging. Magn Reson Med. 2005; 53:398–407.
7. Björk M, Zachariah D, Kullberg J, Stoica P. A multicomponent T2 relaxometry algorithm for myelin water imaging of the brain. Magn Reson Med. 2016;75(1):390-402.
8. Prasloski T, Rauscher A, MacKay AL, Hodgson M, Vavasour IM, Laule C, Madler B. Rapid whole cerebrum myelin water imaging using a 3D GRASE sequence. NeuroImage 2012;63:533–539.
9. Yagishita A, Nakano I, Oda M, Hirano A. Location of the corticospinal tract in the internal capsule at MR imaging. Radiology 1994;191:455-460.
10. Russell-Schulz B1, Laule C, Li DK, MacKay AL. What causes the hyperintense T2-weighting and increased short T2 signal in the corticospinal tract? Magn Reson Imaging. 2013;31(3):329-35.
Figures
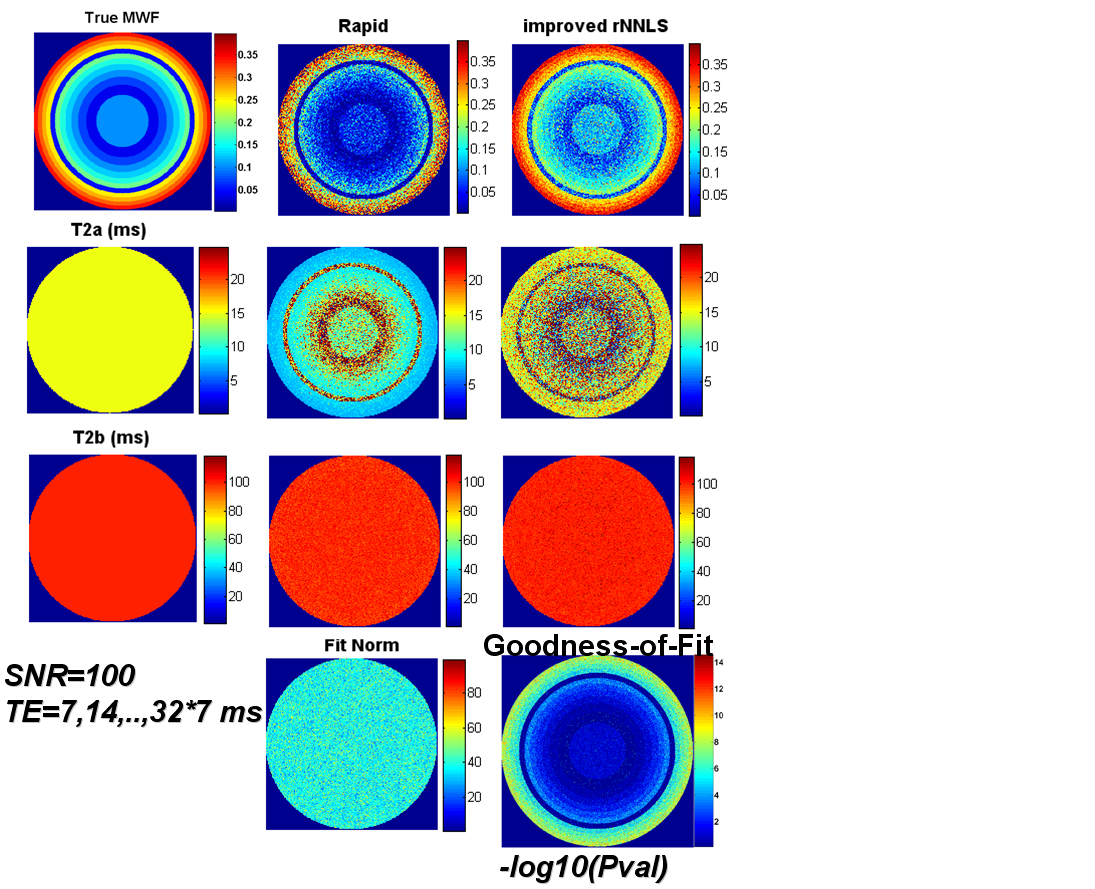
Figure 1. Illustration of the digital two compartment phantom design. True values for MWF, T2a and T2b and the maps obtained at SNR =100 are shown along with the F statistical significance map. Simulations were carried to test the acquisition scheme with TE=7, 14,..., 7*32 ms.