4738
Segmented EPI readout Variable Flip-angle Magnetization Transfer (EP-vfMT) imaging for 7 T quantitative MT (qMT) Imaging1Imaging Institute, Cleveland Clinic Foundation, Cleveland, OH, United States, 2Department of Biomedical Engineering, Hankuk University of Foreign Studies, Yongin, Korea, Republic of
Synopsis
Because of the much higher SAR and longer acquisition time, patient studies using qMT at UHF have not been clinically feasible. In this work, we demonstrated a new approach (EP-vfMT) for whole brain 7T qMT data in a clinically reasonable time. EP-vfMT provides similar image quality to that obtained with conventional MT imaging, and shortens the scan time by utilizing segmented EPI readout and avoiding from SAR limitation. EP-vfMT generates qMT map in reasonable scan time and it exhibits similar myelin density distribution with qMT result from vdMT and aMWF map from ViSTa. Moreover, it maintains sensitivity to MS lesions.
Introduction
Magnetization transfer (MT) imaging is a well-known MR imaging technique that allows indirect imaging of protons that are bound in macromolecules1. This imaging technique provides information about changes in the magnitude of restricted protons that are caused by tissue damage (e.g., demyelination)2-8.
For clinical applications, the effect of MT saturation is typically determined by the MT ratio (MTR)9. MTR provides a semi-quantitative metric by calculating the percent difference between MT-saturated and unsaturated images. Several studies have found that MTR has a good sensitivity to measured changes in myelin concentration within the brain.
A few studies have reported that the accuracy of quantification of MTR is limited10-11. Quantitative MT (qMT) imaging techniques have been proposed to overcome these limitations11-14. However, because of the much higher specific absorption rate (SAR) at UHF, which increases with the square of the main magnetic field strength the acquisition time for MR imaging using high-flip angle radiofrequency (RF) pulses is much longer than the time required at lower field strengths. Because of longer scan times at UHF qMT methods have not been adopted for routine patient scan protocols.
Recently, Dortch et al. demonstrated whole brain qMT imaging at 7T. Although they improved the efficiency for covering k-space by using a TFE readout, the acquisition time required is relatively long for routine patient use15.
In this study, we introduce a new qMT data acquisition approach using a 7T MR system, Segmented EPI readout variable flip-angle MT [EP-vfMT] technique, which can be reasonably included in a routine patient scan protocol with a much shorter scan time and reduced discomfort to the patient.
Methods
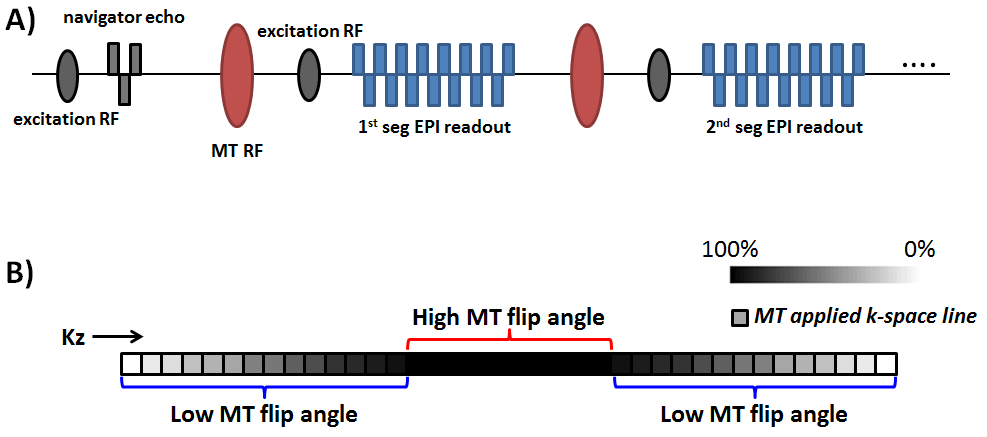
Data were collected from an ALS in situ postmortem brain and three MS patients in a 7T MRI (Siemens; IRB approved). The new EP-vfMT sequence was developed as shown in Figure 1(A). To cover a 3D volume rapidly and reduce EPI associated artifacts a 3D segmented EPI readout was utilized. In order to reduce SAR while maintaining similar MT saturation to conventional MT, the flip angle of the MT RF pulse is varied as a function of the slice-encoding index (Fig. 1(B)). In the central k-space region, which determines most of the information regarding signal intensity and contrast of the image, 100% MT RF flip angles are applied every TR. In the remaining outer peripheral k-space area, which provides most of high spatial frequency information, MT RF flip angles are gradually decreased as a function of the slice-encoding index.
Imaging parameters are as follows: TR = 50 msec, MT RF flip angle in the central k-space= 500/800°; MT RF offset frequencies = 1000, 2000, 4000, 8000, 10000 Hz, 2.0 mm3 isotropic voxel-resolution, total acquisition time 8.3 minutes. The fraction of lines of kz space receiving 100% MT RF flip-angle (=‘H’) was 30%. To generate the myelin volume fraction map, the acquired data is fitted using a nonnegative least-square fitting method proposed by Cabana et al.16
ViSTa aMWF map17-18 and qMT results using vdMT sequence19 were additionally acquired for reference.
Results
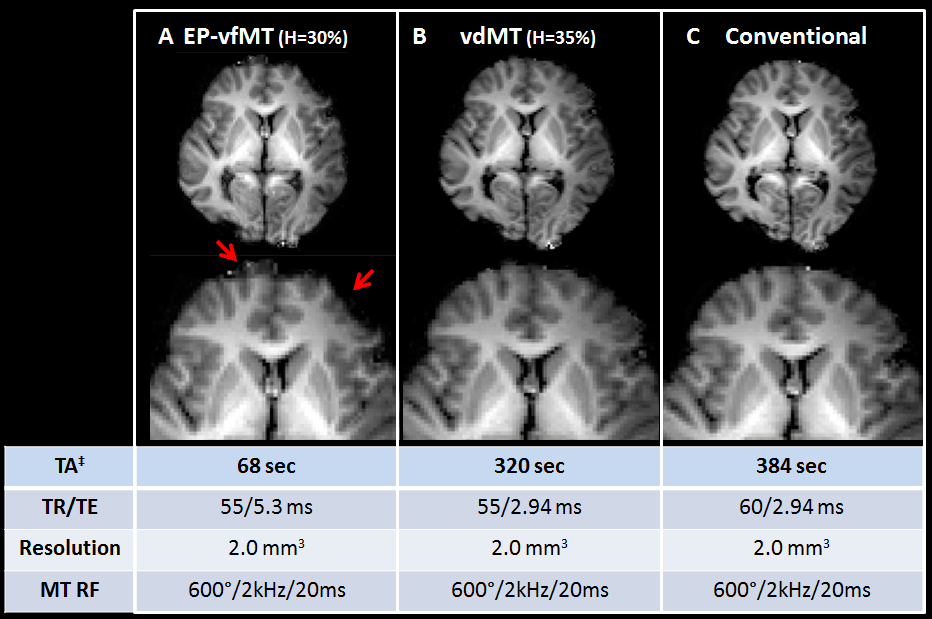
For the validation of EP-vdMT, as shown in Fig. 2, MTR maps from 3 different MT methods are compared. All the MTR maps show similar signal distributions and tissue contrast. Although the segmented EPI readout was used for reducing EPI artifacts, geometric distortion is seen in the frontal region (Fig.2(A)). However the amount of artifact is limited. When compared, the acquisition time for the EP-vfMT is significantly reduced.
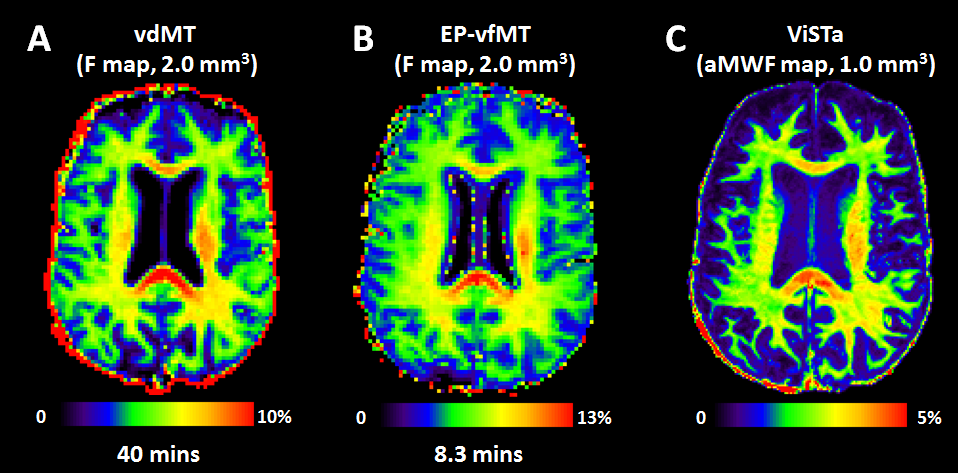
Figure 3 represents a 3D myelin density map from qMT imaging using EP-vfMT sequence compared to qMT imaging using vdMT sequence and ViSTa imaging. Once the maps are compared, they reveal overall similar spatial distributions although the display range is different. In all maps, high myelin densities are observed in corpus callosum and internal capsule.
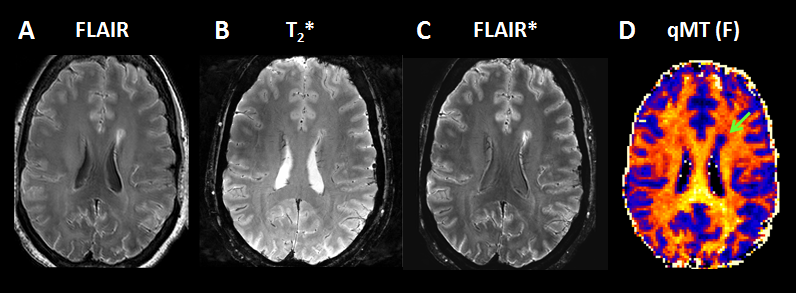
Figure 4 shows the images from a patient with MS. MS lesions demonstrated hyper-signal on the FLAIR, FLAIR* and T2*-weighted images. The corresponding areas in the qMT myelin map demonstrated much reduced signal levels, clearly delineating lesions (Fig. 4D).
Discussions and Conclusions
In this work, we demonstrated a new approach for acquiring whole brain covered 7T qMT data in a clinically reasonable scan time. Our EP-vfMT method provides similar MTR contrast and signal distribution to that obtained with conventional MT and vdMT imaging. The proposed method acquires qMT results in a clinically reasonable scan time while shows similar myelin density map compared to the maps from vdMT and ViSTa imaging. Moreover, it maintains sensitivity to MS lesions. These features make the proposed method appealing for clinical neuroimaging applications in UHF.Acknowledgements
This work was supported by Cleveland Clinic. Author gratefully acknowledges technical support by Siemens Medical Solutions.References
[1] Wolff, S.D., Balaban, R.S., 1989. Magnetization transfer contrast (MTC) and tissue water proton relaxation in vivo. Magn Reson Med 10, 135-144.
[2] Catalaa, I., Grossman, R.I., Kolson, D.L., Udupa, J.K., Nyul, L.G., Wei, L., Zhang, X., Polansky, M., Mannon, L.J., McGowan, J.C., 2000. Multiple sclerosis: magnetization transfer histogram analysis of segmented normal-appearing white matter. Radiology 216, 351-355.
[3] Chen, J.T., Collins, D.L., Freedman, M.S., Atkins, H.L., Arnold, D.L., Canadian, M.S.B.M.T.S.G., 2005. Local magnetization transfer ratio signal inhomogeneity is related to subsequent change in MTR in lesions and normal-appearing white-matter of multiple sclerosis patients. Neuroimage 25, 1272-1278.
[4] Dousset, V., Gayou, A., Brochet, B., Caille, J.M., 1998. Early structural changes in acute MS lesions assessed by serial magnetization transfer studies. Neurology 51, 1150-1155.
[5] Filippi, M., Rocca, M.A., 2004. Magnetization transfer magnetic resonance imaging in the assessment of neurological diseases. J Neuroimaging 14, 303-313.
[6] Schmierer, K., Scaravilli, F., Altmann, D.R., Barker, G.J., Miller, D.H., 2004. Magnetization transfer ratio and myelin in postmortem multiple sclerosis brain. Ann Neurol 56, 407-415.
[7] Gass, A., Barker, G.J., Kidd, D., Thorpe, J.W., MacManus, D., Brennan, A., Tofts, P.S., Thompson, A.J., McDonald, W.I., Miller, D.H., 1994. Correlation of magnetization transfer ratio with clinical disability in multiple sclerosis. Ann Neurol 36, 62-67
[8] Kalkers, N.F., Hintzen, R.Q., van Waesberghe, J.H., Lazeron, R.H., van Schijndel, R.A., Ader, H.J., Polman, C.H., Barkhof, F., 2001. Magnetization transfer histogram parameters reflect all dimensions of MS pathology, including atrophy. J Neurol Sci 184, 155-162.
[9] Dousset, V., Grossman, R.I., Ramer, K.N., Schnall, M.D., Young, L.H., Gonzalez-Scarano, F., Lavi, E., Cohen, J.A., 1992. Experimental allergic encephalomyelitis and multiple sclerosis: lesion characterization with magnetization transfer imaging. Radiology 182, 483-491.
[10] Berry, I., Barker, G.J., Barkhof, F., Campi, A., Dousset, V., Franconi, J.M., Gass, A., Schreiber, W., Miller, D.H., Tofts, P.S., 1999. A multicenter measurement of magnetization transfer ratio in normal white matter. J Magn Reson Imaging 9, 441-446.
[11] Henkelman, R.M., Huang, X., Xiang, Q.S., Stanisz, G.J., Swanson, S.D., Bronskill, M.J., 1993. Quantitative interpretation of magnetization transfer. Magn Reson Med 29, 759-766.
[12] Pike, G.B., 1996. Pulsed magnetization transfer contrast in gradient echo imaging: a two-pool analytic description of signal response. Magn Reson Med 36, 95-103.
[13] Sled, J.G., Pike, G.B., 2000. Quantitative interpretation of magnetization transfer in spoiled gradient echo MRI sequences. J Magn Reson 145, 24-36.
[14] Sled, J.G., Pike, G.B., 2001. Quantitative imaging of magnetization transfer exchange and relaxation properties in vivo using MRI. Magn Reson Med 46, 923-931.
[15] Dortch, R.D., Moore, J., Li, K., Jankiewicz, M., Gochberg, D.F., Hirtle, J.A., Gore, J.C., Smith, S.A., 2013. Quantitative magnetization transfer imaging of human brain at 7 T. Neuroimage 64, 640-649.
[16] Jean-François Cabana, Ye Gu, Mathieu Boudreau, Ives R Levesque, Yaaseen Atchia, John G. Sled, Sridar Narayanan, Douglas L. Arnold, G. Bruce Pike, Julien Cohen-Adad, Tanguy Duval, Manh-Tung Vuong and Nikola Stikov, 2016, Quantitative magnetization transfer imaging made easy with qMTLab: Software for data simulation, analysis, and visualization, Concepts in Magnetic resonance Part A, 44A, 263–277
[17] Oh, S.H., Bilello, M., Schindler, M., Markowitz, C.E., Detre, J.A., Lee, J., 2013. Direct visualization of short transverse relaxation time component (ViSTa). Neuroimage 83C, 485-492.
[18] Oh, S.H.and Lowe, M. 2016, High-resolution myelin water imaging using Direct Visualization of Short Transverse Relaxation Time Component (ViSTa) at 7T, ISMRM, #1288
[19] Oh, S.H., Shin W., Lee J., Lowe, M., 2016, Variable Density Magnetization Transfer (vdMT) imaging for 7 T MR Imaging, Neuroimage, http://dx.doi.org/10.1016/j.neuroimage.2016.09.009
Figures