4737
Small vessel specific cerebrovascular reactivity with 7 tesla 2D Qflow MRI.1Radiology, UMC Utrecht, Utrecht, Netherlands, 2Spinoza Center for Neuroimaging, Amsterdam, Netherlands, 3Brain Center Rudolf Magnus, UMC Utrecht, Utrecht, Netherlands
Synopsis
We aimed to measure cerebrovascular reactivity (CVR) specifically at the level of the superficial perforating arteries with 7T 2D Qflow, to develop a method to assess small vessel function for cerebral small vessel disease research. 7T 2D Qflow acquisitions through the semi oval center (CSO) and through the medial cerebral artery (M1) were acquired at baseline and during hypercapnia. CVRM1 corresponded to CVR values from Qflow literature and, while an order of magnitude smaller, CVRCSO corresponded to CVR values from ASL literature. This shows proof of concept that CVR of perforating arteries can be measured using 7T 2D Qflow.
Introduction
Research on MRI manifestations of cerebral small vessel disease (SVD) primarily assesses parenchymal lesions.1,2 However, SVD is a disease of the blood vessels themselves and abnormalities in these vessels may be present long before lesions develop. It is challenging to assess the involved blood vessels because of their small dimensions. Recent advances in 7T MRI have enabled blood flow velocity measurements in superficial perforating arteries (running through the semioval center of the white matter) with 7T 2D Qflow.3 It is known that patients with SVD have a decreased cerebrovascular reactivity (CVR) in larger arteries.4 For SVD research method development, we aimed to test if we could measure CVR specifically at the level of the perforators with 7T 2D Qflow.Methods
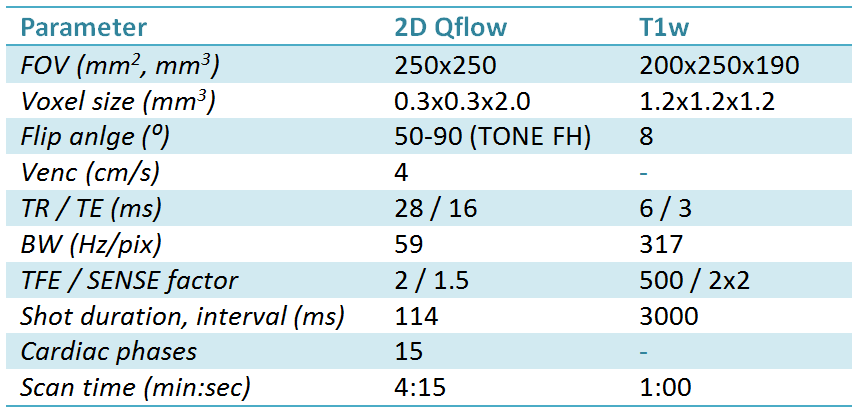
Nine healthy volunteers (4 male, 21-39 years old) were scanned with a 7T MRI system (Philips) with a 32 channel head coil (Nova Medical). A 2D Qflow acquisition3 was performed at two locations; the proximal medial cerebral artery (M1) and the perforators running through the semioval center of the white matter (CSO) and were repeated during a hypercapnic challenge. The challenge was targeted at 12 mmHg partial pressure of end tidal CO2 (PetCO2) increase, administered by the RespirActTM device (Thornhill Research). For tissue segmentation, a T1 weighted scan (T1w) was performed between acquisitions. See table 1 for further parameters.
Processing of CSO data was performed similar to a previously published method:3 Perforators were identified by significant (0 cm/s outside 95%CI) mean velocity (Vmean). The voxel with the highest Vmean was selected for each group of adjacent significant voxels. Detected perforators were matched between baseline and challenge as the closest vessel within 2 mm, ensuring the same subset of perforators for both conditions. The pulsatility index (PI) was calculated from the averaged time curve for all perforators as: $$ PI=\frac{|V|_{max}-|V|_{min}}{|V_{mean}|} $$
To calculate the CVRCSO (%velocity/mmHg PetCO2) a line was fitted with a linear mixed effects model (LME, R statistics). LME allows for hierarchical data, in our case multiple vessels per volunteer. The M1 acquisition was manually analyzed on the MR system. CVRM1 was calculated as %flow/mmHg PetCO2. Measures that were not hierarchical (single result per volunteer: Ndetected, PI, CVRM1) were tested with a (paired, when appropriate) student’s t-test.
Results
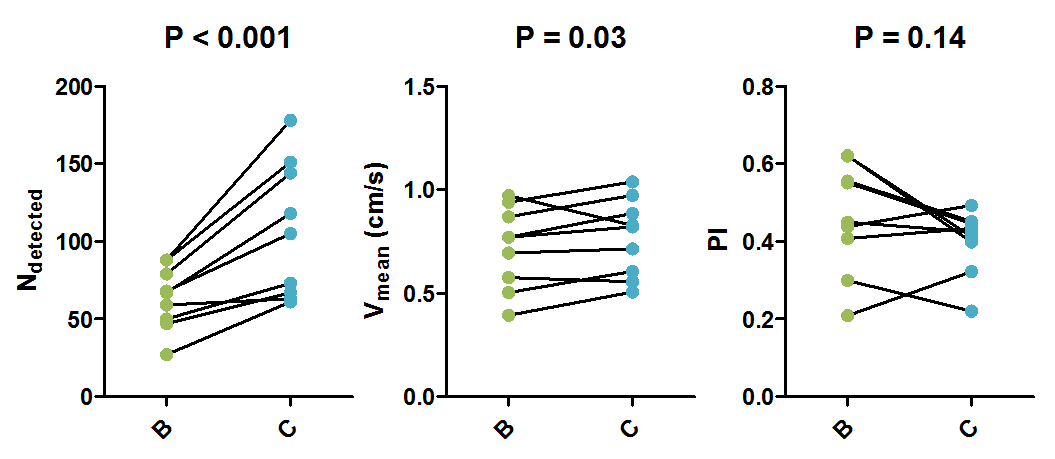
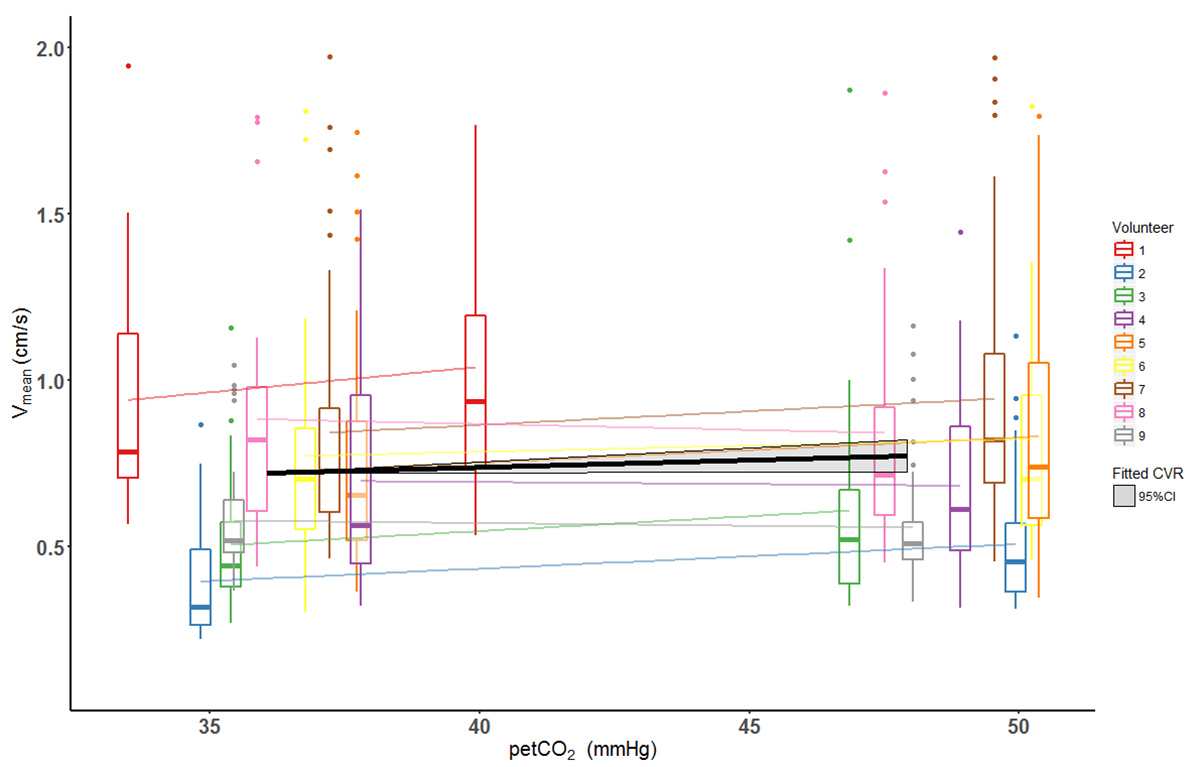
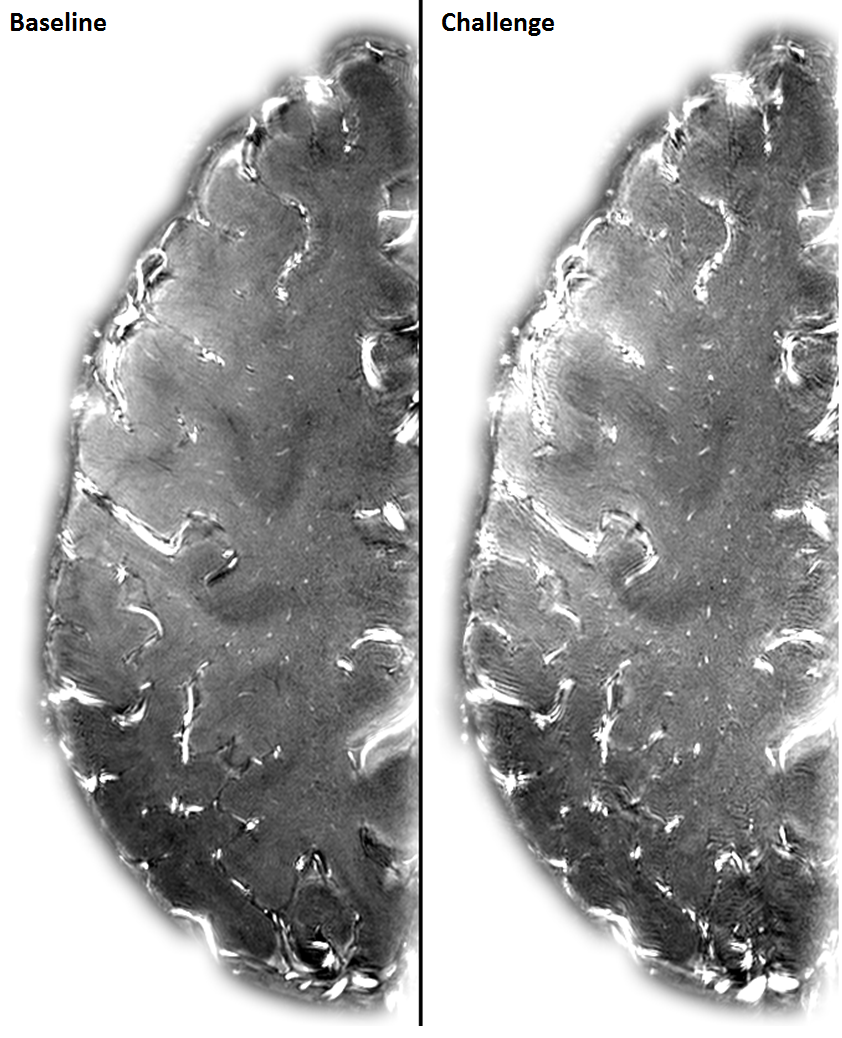
Figure 1 shows the Ndetected, Vmean and PI of the perforators. Ndetected increased from (mean[range]) 64[27-88] to 107[61-178] (p<0.001), Vmean increased with (fit±stderr) 0.06±0.03 (p=0.03) from (mean±stderr) 0.72±0.07 to 0.78±0.06 cm/s and PI decreased from (mean±stderr) 0.46±0.04 to 0.40±0.03 (p=0.14). Figure 2 shows Vmean measurement distributions for every perforator and the average increase per volunteer in colored lines. The black line shows the fitted slope of (fit±stderr) 0.0045±0.0021 (p=0.03) cm/s/mmHg, which resulted in a normalized CVRCSO of 0.62±0.29 %/mmHg. Figure 3 qualitatively shows the increased blood signal during challenge.
M1 measurements were absent in volunteer 3 (scan time constraints). M1 flow increased from (mean±stderr) 149±13 to 263±23 ml/min (p<0.001), see figure 4. The resulting CVRM1 (mean±stderr) was 6.4±0.8 %/mmHg (p<0.001). PI (mean±stderr) decreased from 0.74±0.05 to 0.52±0.04 (p<0.01).
Discussion
In this proof of concept study in healthy volunteers, a large and significant increase was observed in the number of detected perforators. SNR increases with increased flow due to the T1 inflow effect, which increases detectability. A significant increase in flow velocity in the (repeated subset of) perforators was also measured directly. This amounted to a CVR of 0.62 %velocity/mmHg, while the M1 showed a much larger CVR of 6.4 %flow/mmHg (corresponding to flow CVRM1 values known from literature).5 Cerebral perfusion CVR in white matter has been reported to have values of around 1.1 %/mmHg.6 This compares reasonably well with our finding, given the challenges in accurate estimation of white matter perfusion with arterial spin labeling, and the underestimation of the blood flow velocities in the white matter perforators with our method.3
Attributing the measured perforator reactivity entirely to a velocity (versus diameter) increase is problematic. The perforators in the CSO have sub-voxel diameters and their measured velocities are underestimated due to partial volume effects.3 The current method cannot distinguish a true increase in velocity from an apparent increase due to vessel dilation with associate reduced partial volume effects and reduced underestimation. While the measured CVR is an aggregate of the response of the vascular system and imaging methods, our measurement is informative about the induced changes at the level of the perforators.
Conclusion
We have shown proof of concept that vascular reactivity of superficial perforating arteries can be measured using 7T 2D Qflow, promising to be an interesting measure in SVD research.Acknowledgements
This work was supported by the European Research Council, ERC grant agreement n°337333.References
1. Pantoni, L. Cerebral small vessel disease: from pathogenesis and clinical characteristics to therapeutic challenges. Lancet Neurol. 9, 689–701 (2010).
2. Wardlaw, J. M. et al. Neuroimaging standards for research into small vessel disease and its contribution to ageing and neurodegeneration. Lancet Neurol. 12, 822–838 (2013).
3. Bouvy, W. H. et al. Assessment of blood flow velocity and pulsatility in cerebral perforating arteries with 7-T quantitative flow MRI. NMR Biomed. (2015). doi:10.1002/nbm.3306
4. Vicenzini, E. et al. Cerebrovascular reactivity in degenerative and vascular dementia: A transcranial doppler study. Eur. Neurol. 58, 84–89 (2007).
5. Leung, J., Behpour, A., Sokol, N., Mohanta, A. & Kassner, A. Assessment of Intracranial Blood Flow Velocities Using a Computer Controlled Vasoactive Stimulus?: A Comparison Between Phase Contrast Magnetic Resonance Angiography and Transcranial Doppler Ultrasonography. 738, 733–738 (2013).
6. Halani, S., Kwinta, J. B., Golestani, A. M., Khatamian, Y. B. & Chen, J. J. Comparing cerebrovascular reactivity measured using BOLD and cerebral blood flow MRI: The effect of basal vascular tension on vasodilatory and vasoconstrictive reactivity. Neuroimage 110, 110–123 (2015).
Figures