4735
MRI submerging into The Big Blue: A comparative 3D-pCASL and IVIM-MRI brain perfusion study to elucidate circulatory adaptation during prolonged freediving1Department of Radiology, University Hospital Bonn, Bonn, Germany, 2Department of Anesthesiology, University Hospital Bonn, Bonn, Germany, 3Clinical Science Department, Philips Healthcare, Germany, 4Department of Neurology, University Hospital Bonn, Bonn, Germany
Synopsis
Freedivers can endure severe hypoxemia during breathhold without any apparent neurological deficit. Little is known on how brain circulation adapts to deliberate breathhold. We examined 14 experienced freedivers during breathholds of 5 to 7.5 minutes at a 3T MRI applying 3D-pCASL and IVIM-MRI sequences to reveal dynamic alterations of cerebral blood flow (rCBF) and in order to elucidate the relationship of rCBF and perfusion fraction (PF) of IVIM-MRI. rCBF increased to 3.2-fold the baseline levels and negatively correlated to blood oxygen levels, but not to PF, which initially dropped during breathhold and therefore appears to represent another underlying physiological mechanism.
Introduction
Freediving is an increasingly popular, but potentially dangerous sport as hypoxemia during extended breathholds represents an extraordinary challenge to the brain. Research on physiological adaptation to prevent brain damage is scarce, but needed to also better understand other hypoxemic states such as sleep apnea (1). For instance, reactive hyperperfusion may serve as an important compensation mechanism as suggested by extracranial ultrasound analysis of blood flow during breathhold (2). A negative correlation of intravoxel-incoherent motion MRI (IVIM-MRI) derived perfusion fraction (PF) and 3D-pseudo-continuous arterial spin labeling (3D-pCASL) derived cerebral blood flow (rCBF) to apnoe duration was recently proposed (3) and is of interest as these techniques challenge established contrast agent dependent perfusion techniques (4-7).
Purpose
This study was performed to (a) prove the feasibility to quantify breathhold-related perfusion dynamics with 3D-pCASL and IVIM-MRI, (b) link these dynamics to changes in venous blood gases, heart rate and blood oxygen saturation (SpO2) and (c) study the correlation of apnoe time to rCBF and PF.Methods
14 male freedivers (20 to 64 y, median freediving experience 72 months) maintained two breathholds of 5 (n=13) or 7.5 mins (n=1) with continuous heart rate and SpO2 monitoring during 3T brain MRI. Prior enforced CO2 washout by hyperventilation was not allowed. Venous blood gases were taken during IVIM-MRI at baseline, after 2.5 mins., at end of breathhold and after 2.5 mins. recovery time. 3D-pCASL and IVIM-MRI sequences (2.5 mins. scan time each) were run before, during and after breathhold (sequence details fig. 1; setup details fig. 2).
Images were co-registered to reduce motion artifacts. rCBF maps of all stages of the breathhold experiment were generated with commercially available software (PRIDE, Philips). IVIM-MRI PF maps based on bi-exponential fitting were generated with custom-made software. Mean rCBF (in ml/100g/min.) and PF (in %) were determined in matching bilateral regions of interest (ROI) of cortex and cortical vessels, white matter, basal ganglia and hippocampi. Corresponding ROI-based PF and rCBF measurements were normalized to the respective baseline values and plotted against time and correlated with each other and to physiological and biochemical parameters (Spearman).
In 9 cases blood neuron-specific enolase (NSE) levels were obtained before and 24h after breathhold to assess signs of insufficient compensation of hypoxemia defined by neuronal loss, i.e. NSE elevation.
Results
Time curves showed a primary increaseof rCBF during breathhold (n=11/14) or a secondary elevation after a dip below baseline during the first breathhold scan (n=3/14). This was followed by a drop of rCBF during recovery frequently below baseline (n=9/14), while PF in 11/14 cases increased secondarily (fig. 2 and 3). PF increased maximally to 152% of baseline and was moderately anti-correlated to SpO2 (r=-.42;P=.0005; fig. 4) and non-significantly to CO2 (r=.21). rCBF was strongly negatively correlated to SpO2 (r=-.64; P<.0001; fig. 4) and correlated poorly with the heart rate (r=-.001; P=.98). Absolute PF correlated moderately to absolute rCBF (r=.39; P=.0001; fig. 5), but relative parameters did not correlate with each other (r=.14; ns). NSE never showed no elevation after 24h.Discussion
Time curves revealed consistent responses of rCBF and PF during breathhold and recovery. 3D-pCASL revealed cerebral hyperperfusion during breathhold, which was higher than presumed from extracranial measurements in the literature (2) and which closely correlated to a drop in SpO2. A lack of NSE elevation suggests a sufficient compensation of hypoxemia by hyperperfusion in freedivers (no brain damage). An elevation in heart rate is not the driving mechanism behind increased rCBF. The role of CO2, known trigger of hyperperfusion and surprisingly not closely correlated to PF in this study (8,9), needs to be analyzed in consecutive studies. A possible explanation for the inter-individual variability of rCBF drop below baseline levels may be a prophylactic hyperperfusion triggered by anticipation of the apnoe task.
A comparably weaker correlation of PF with SpO2 and qualitatively as well as quantitatively different PF-time dynamics imply that IVIM-MRI and pCASL parameters at least partially derive from divergent physiological phenomena, with pCASL being closely associated with flow in macrovascular structures. The finding of low correlation of rCBF to PF is discordant to earlier findings of Wong et al. (4) and stresses the issue of a limited comparability of these parameters. The origin of the IVIM-MRI signal remains unclear.
Conclusion
Freedivers compensate hypoxemia by cerebral hyperperfusion, which can be quantified with 3D-pCASL. 3D-pCASL-derived rCBF and IVIM-MRI-derived PF a limited comparability pointing to a different physiological cause of signals. Future research should focus on the origin of IVIM signals and the meaning of IVIM-MRI- derived PF, but also on possible cardiovascular and cerebral consequences of repetitive apnoe-induced hyperperfusion.Acknowledgements
No acknowledgement found.References
(1) Yadav SK, Kumar R, Macey PM, et al. Regional cerebral blood flow alterations in obstructive sleep apnea. Neurosci Lett. 2013;555:159-64.
(2) Willie CK, Ainslie PN, Drvis I, et al. Regulation of brain blood flow and oxygen delivery in elite breath-hold divers. J Cereb Blood Flow Metab. 2015;35(1):66-73.
(3) Lin Y, Li J, Zhang Z, et al. Comparison of Intravoxel Incoherent Motion Diffusion-Weighted MR Imaging and Arterial Spin Labeling MR Imaging in Gliomas. Biomed Res Int. 2015;2015:234245.
(4) Wong AM, Yan FX, Liu HL. Comparison of three-dimensional pseudo-continuous arterial spin labeling perfusion imaging with gradient-echo and spin-echo dynamic susceptibility contrast MRI. J Magn Reson Imaging. 2014;39(2):427-33.
(5) Wirestam R, Borg M, Brockstedt S, et al. Perfusion-related parameters in intravoxel incoherent motion MR imaging compared with CBV and CBF measured by dynamic susceptibility-contrast MR technique. Acta Radiol. 2001;42(2):123-8.
(6) Bisdas S, Braun C, Skardelly M, et al. Correlative assessment of tumor microcirculation using contrast-enhanced perfusion MRI and intravoxel incoherent motion diffusion-weighted MRI: is there a link between them? NMR Biomed. 2014;27(10):1184-91.
(7) Tanaka Y, Nagaoka T, Nair G, et al. Arterial spin labeling and dynamic susceptibility contrast CBF MRI in postischemic hyperperfusion, hypercapnia, and after mannitol injection. J Cereb Blood Flow Metab. 2011;31(6):1403-11.
(8) Tancredi FB, Gauthier CJ, Madjar C, et al. Comparison of pulsed and pseudocontinuous arterial spin-labeling for measuring CO2 -induced cerebrovascular reactivity. J Magn Reson Imaging. 2012;36(2):312-21.
(9) Heijtel DF, Mutsaerts HJ, Bakker E, et al. Accuracy and precision of pseudo-continuous arterial spin labeling perfusion during baseline and hypercapnia: a head-to-head comparison with ¹5O H2O positron emission tomography. Neuroimage. 2014;92:182-92.
Figures
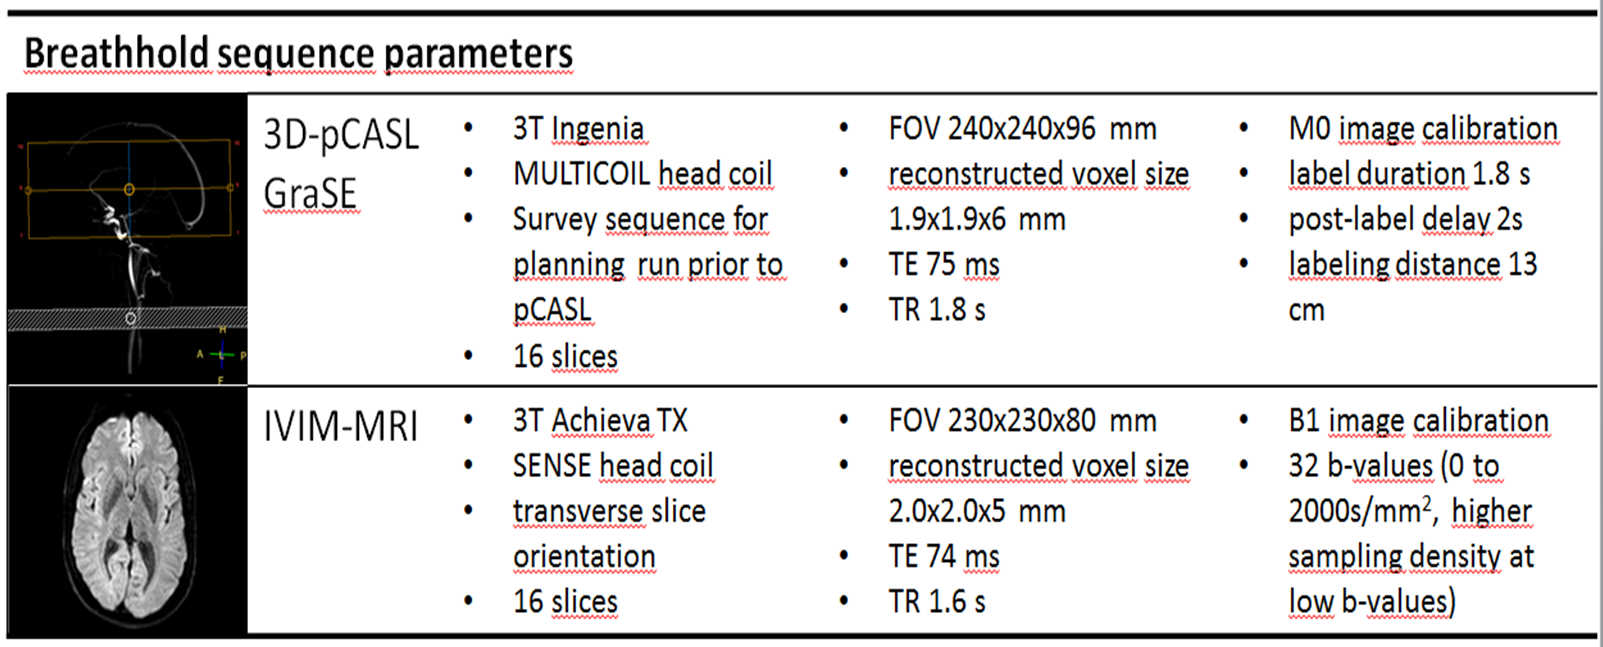
Fig. 1 Technical MRI parameters
All freedivers were scanned five times (or in case of 7.5 mins. breathhold six times) with both 3D-pCASL and and IVIM-MRI sequences at two different 3T MRI scanners [baseline scan; early, late (and once latest; n=1) breathold scans, two recovery scans after breathhold]. Both sequences have a scan time of 2.5 minutes. FOV: field of view; TE: echo time; TR: repetition time.

Fig. 2 Overview on breathhold experiment setup and typical observations
Freedivers were scanned during the last 2.5minutes before breathhold (baseline, a), once per 2.5minutes of breathhold (here 3x; b,c,d), and 2x after (recovery; e,f). Venous blood gases were determined during IVIM-MRI at marked times. Pronounced increase of rCBF during breathhold was observed (lower row), while PF rise was subtle (upper row). The example shows a drop in rCBF between a and b, found in 3 divers, who reported a deep meditative state during the first minutes of breathhold. CV:cardiovascular monitoring; PF:perfusion fraction; pCASL:pseudo-continuous arterial spin labeling; rCBF:regional cerebral blood flow.

Fig. 3 Time dynamics of PF and rCBF
To compare changes in rCBF and PF all values were set as relative ratios to baseline values, defined as 1. The first points in graphs are baseline measurement under normoxia, while the last two points are recovery measurements after breathhold (n=14; 1 freediver with three breathhold measurements). Peak rCBF during breathhold ranged from 116% to 320% of baseline (left), while PF increase was less pronounced and more frequently showed a dip during early breathhold (right). pCASL: pseudo-continuous arterial spin labeling; rCBF: regional cerebral blood flow; IVIM: intravoxel-incoherent motion MRI; PF: perfusion fraction.
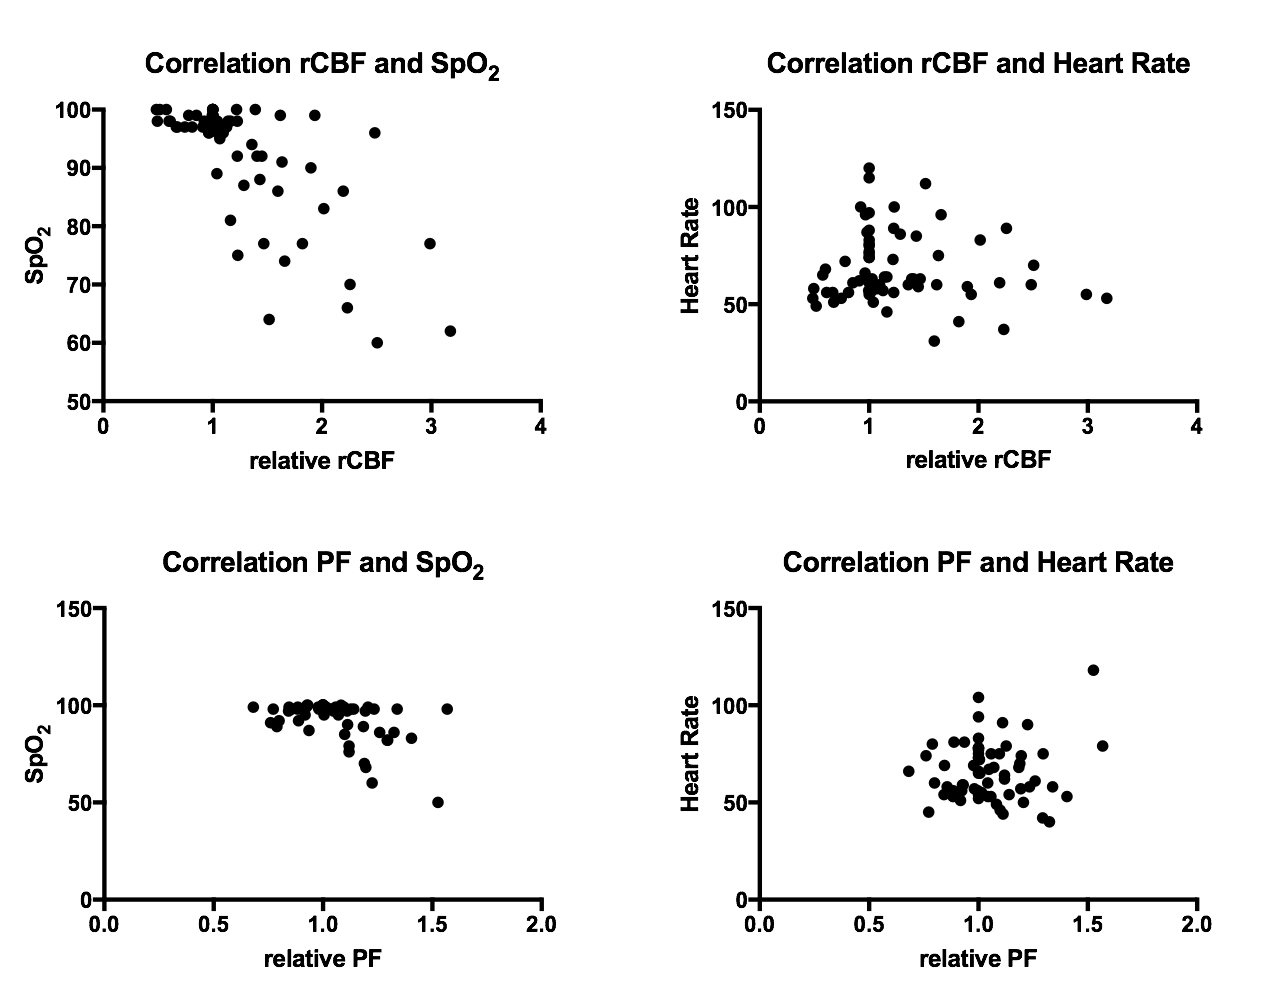
Fig. 4 Relationship of PF and rCBF with SpO2 and heart rate
To compare changes in rCBF and PF all values were set as relative ratios to the baseline value, defined in each experiment as 1. Both relative rCBF and PF showed a strong or moderate correlation with decreasing SpO2 (r=-.64 and =-.42 respectively). Both parameters were non-significantly correlated to heart rate, indicating different mechanisms of action to increase flow. pCASL: pseudo-continuous arterial spin labeling; rCBF: regional cerebral blood flow; IVIM: intravoxel- incoherent motion MRI; PF: perfusion fraction.

Fig. 5 Correlation of perfusion fraction and regional cerebral blood flow
Correlation
between absolute values of PF and rCBF was moderate (r=.39;
P=.0001), which indicates
differences in signal origin.