4734
Superior sagittal sinus venous oxygen saturation based on fully automated MR susceptometry : effects of slice dependent even-odd echo discrepancy and vascular angle correction1Graduate Institute of Biomedical Electronics and Bioinformatics, National Taiwan University, Taipei, Taiwan, 2Department of Medical Research, Taipei Veterans General Hospital, Taipei, Taiwan, 3Department of Radiology, Taipei Veterans General Hospital, Taipei, Taiwan, 4Institute of Brain Science, National Yang-Ming University, Taipei, Taiwan
Synopsis
Venous oxygen saturation (SvO2) for estimation of global cerebral metabolic rate of oxygen is measured using MR susceptometry from the phase information obtained with multi-echo gradient-echo imaging. Automatic selection and segmentation of the superior sagittal sinus is performed with slice dependent even-odd discrepancy to avoid operator dependency. Results from 12 healthy subjects suggested that phase values of the vessel showing minimal even-odd echo discrepancy could be used as a useful information guiding selection of the appropriate vessel segment for SvO2 estimations by taking into consideration the three dimensional vasculature.
Purpose
The venous oxygen saturation (SvO2) level which is essential to evaluate the global cerebral metabolic rate of oxygen 1 could be quantified from the magnetic susceptibility shift between vein and brain tissue with the phase image of gradient echo. 2 However manual estimation of superior sagittal sinus (SSS) parallel segment with main magnetic field (B0) could bias the SvO2 quantification. In this research, automatic selection of SSS and estimation of angle between B0 and SSS based on even-odd echo discrepancy 3,4 are performed on multi-echo gradient echo images to avoid operator dependency. Results of the fully automatic SSS SvO2 quantification using MR susceptometry from 12 healthy subjects is reported.Materials and Methods
The phase values in the SSS are affected by at least two factors: SvO2 and flow in the presence of gradients. In multi-echo gradient-echo imaging with bipolar frequency encoding gradients, constant flow along the frequency encoding direction results in zero contribution to the phase on even echoes only (even echo rephasing). Setting the first echo to be flow compensated changes the situation into odd echo rephasing. Therefore for SSS oriented at an oblique angle to B0, the velocity component along the frequency encoding direction in an axial slice leads to even-odd echo discrepancy in the phase values 3,4. Absence of such phenomena would indicate minimal in-plane flow and hence a parallel SSS segment to B0. A quantification of the even-odd echo discrepancy thus provides a means to identify suitable SSS segment for SvO2 measurements.
The MRI experiments were executed using a 3T MR system (GE with an 8-channel head coil) and data from twelve subjects (nine male and age = 24±3) were included. 3D flow compensated multi-echo gradient echo imaging (6 echoes) of brain centered manually with parallel SSS segment was conducted with the following parameters: TR = 31.4 msec, TE = 5.4 ~ 27.5 msec, matrix= 512×512×26, voxel size = 0.45×0.45×3 mm3, flip angle = 15° and bandwidth = 244 Hz/pixel.
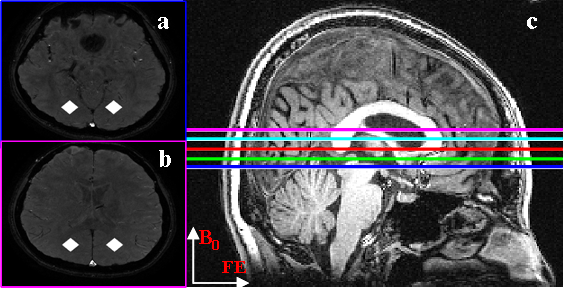
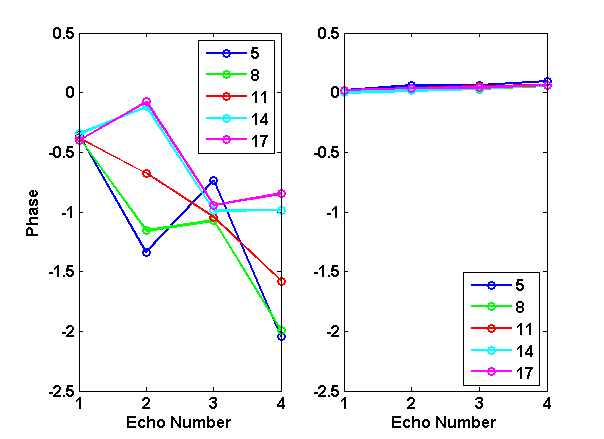
The region of interest (ROI) corresponding to SSS was segmented automatically as voxels showing simultaneous flow-related enhancement on the magnitude images and paramagnetic values on the phase images. The surrounding bilateral parenchyma ROIs (diamond shape; Fig.1) were also extracted automatically as symmetric regions 2 cm away from SSS. Then these ROIs were analyzed for phase values on all slices. The degrees of even-odd echo discrepancy on all slices were probed using Pearson’s correlation coefficient (R2) of SSS phase values versus TE for the first four echoes. The single slice showing maximal R2 was selected to derive SvO2, with residual angular effects viewed on coronal images corrected using literature formula 1.
Results
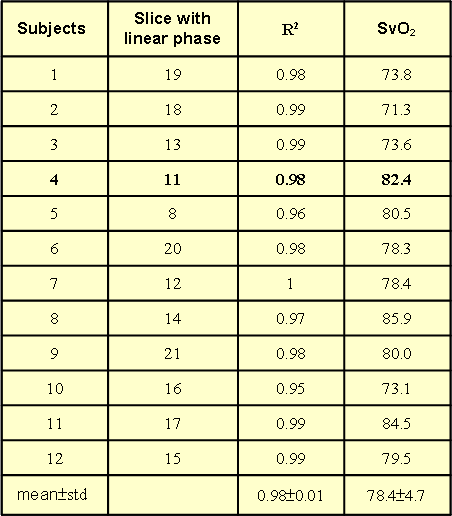
Figure 1 displayed the example images from one subject (4th subject), where it was seen that both SSS and bilateral neighboring parenchyma ROIs were successfully selected automatically (Fig.1a-b). In this case, slice No.11 showed the largest R2 value for SSS phases vs. TE (Fig.2a), whereas the SSS phase of even echoes were decreased for slices at the inferior end (Fig.1c) to slice No.11, and vice versa for slices at the superior end (Fig.2a). The slice dependent even-odd discrepancy found in SSS was absent for the parenchyma ROIs regardless of the slices chosen (Fig.2b). Following automatic selection of the single slice containing the SSS segment parallel to B0, SvO2 of twelve subjects were computed and listed in Table 1. The SvO2 values (78.4±4.7%) were close to but somewhat higher than literature values 1.Discussion
Since SSS is curved in shape, blood flow in SSS projected onto the image slice could lead to in-plane velocity component along the frequency-encoding direction, which causes slice-dependent even-odd echo discrepancy. Instead of developing sophisticated flow compensation schemes for all the echoes simultaneously, our work uses the discrepancy information to automatically identify the SSS segment parallel to B0, such that SSS SvO2 quantification could be achieved without pulse sequence modifications.Conclusion
The proposed automation strategy provides potential benefits for SvO2 quantification based on MR susceptometry taking into consideration stereoscopic vascular curvature to facilitate clinical practice by reducing subjective interruptions. Future works include investigations of different veins with in-plane flow, such as the transverse sinus to improve global SvO2 quantifications.Acknowledgements
The project was supported by research grants of Taipei Veterans General Hospital, Taiwan (V105A-027).References
1. Jain et al., J Cereb Blood Flow Metab, 2010, 1598-1607; 2. Weisskoff et al., MRM, 1992, 375-383; 3. Xu et al., MRM, 2014, 438-445; 4. Li et al., MAGMA, 2015, 347-355.Figures