4733
Inversion Recovery Ultrashort Echo Time Imaging of Short T2 Tissue Components in Ovine Brain: A Sequential D2O Exchange Study1Dept. of Radiology, University of California, San Diego, San Diego, CA, United States
Synopsis
Myelin produces ultrashort-lived MRI signals, and cannot be directly imaged using conventional MRI sequences that typically have TEs of several milliseconds or longer. This study explored the potential of inversion recovery ultrashort echo time (IR-UTE) sequences in direct myelin imaging in an ovine brain D2O exchange model. The IR-UTE signals survived D2O exchange. Myelin T2* was measured to be 200-300 µs both before and after exchange. These results support myelin to be the major source of the ultrashort T2* signals seen on IR-UTE images, and IR-UTE sequence as a tool for assessing myelin loss in multiple sclerosis and other diseases.
Purpose
Myelin produces extremely short-lived signals that cannot be detected using conventional MRI sequences. Inversion recovery ultrashort echo time (IR-UTE) imaging holds the potential to directly detect and measure these signals. This study aimed to explore this potential in ovine brain.Methods
Sample preparation: Five unfixed ~3-mm thick ovine brain specimens containing cerebral hemisphere (n=4) and cerebellum (n=1) were examined before and after exchange with D2O (99.9%, Sigma-Aldrich, St. Louis, MO). Each specimen was immersed in 10 mL D2O, which was refreshed daily.
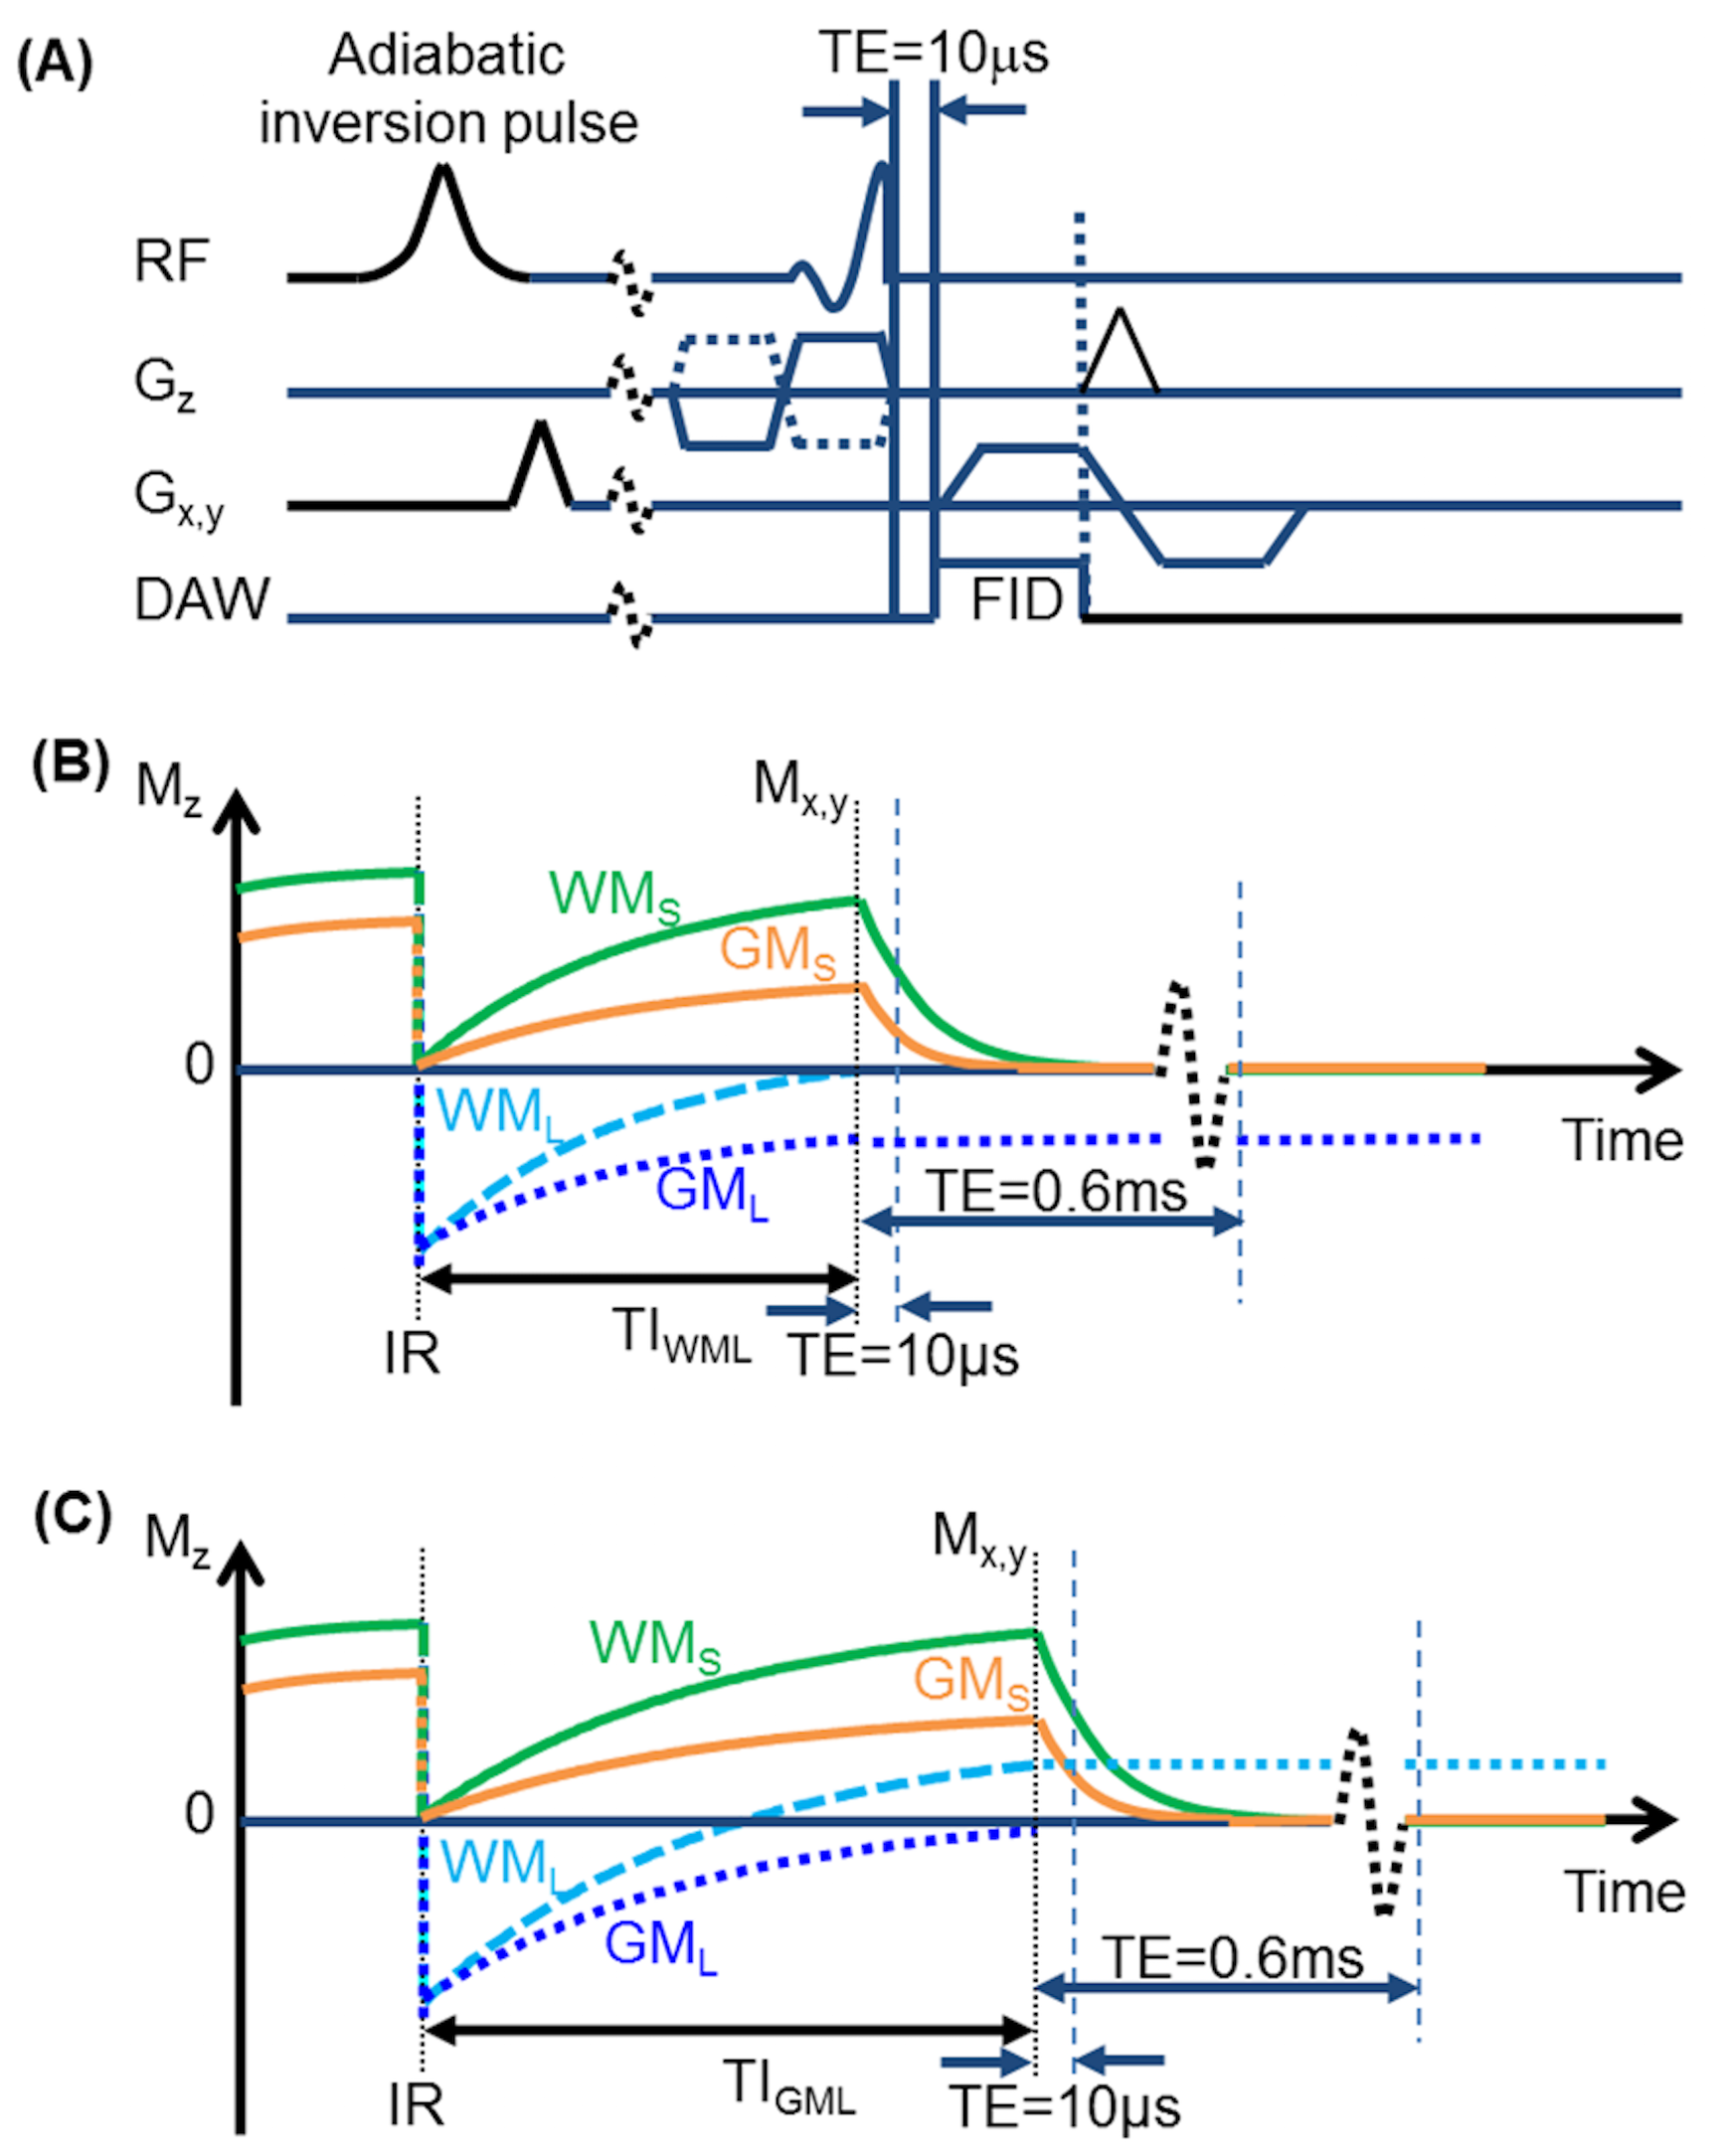
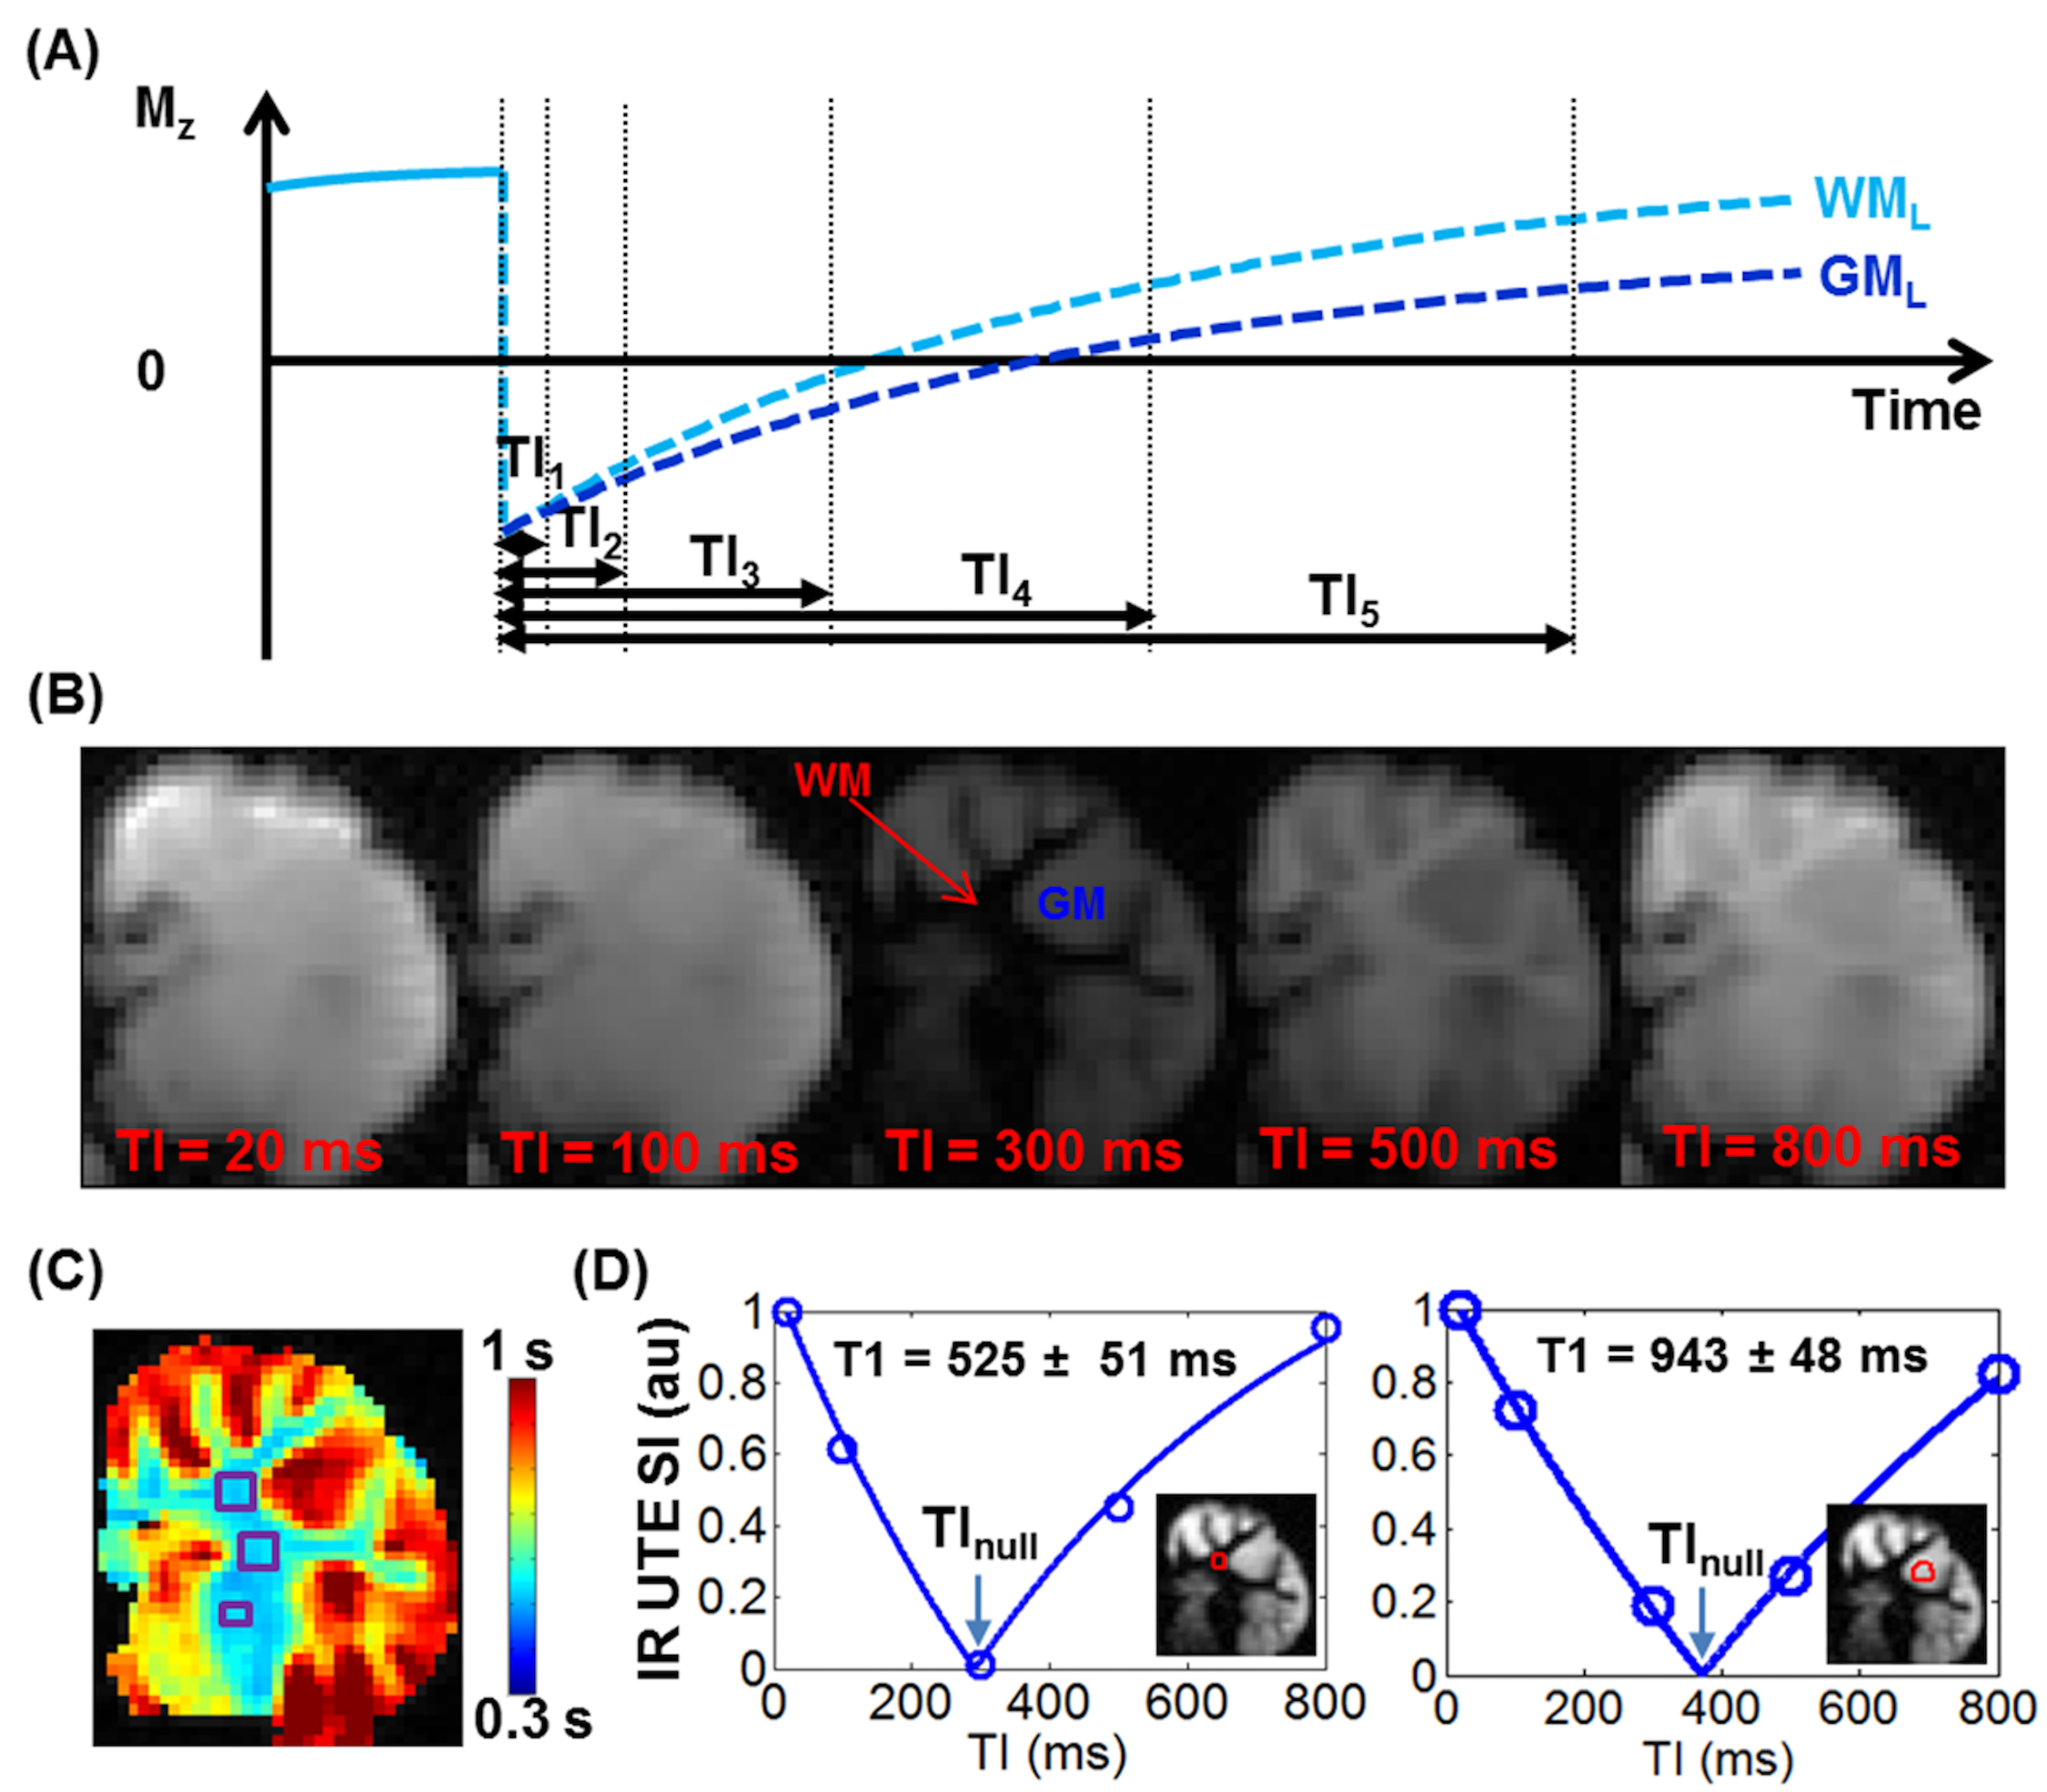
IR-UTE MRI: All specimens were imaged using a GE 3T MRI scanner with a 3-inch receive-only coil. Long T2 signals were measured using a clinical proton density-weighted fast spin echo (PD-FSE) sequence with TR/TE = 8000/13.5 ms. Ultrashort T2 signals were measured using IR-UTE sequences with a minimum TE of 10 µs (Figure 1A).1 To determine the optimal inversion time (TInull) for completely nulling white matter (WM) or grey matter (GM) long T2 signals (WML or GML, Figures 1B-C), IR-UTE images were first acquired with variable inversion times with TR/TE = 1000/2.2 ms to measure WML and GML T1s (Figure 2A). Then at WML or GML TInull, images with TEs of 0.01-4 ms were acquired for measuring the T2*s of WM or GM short T2 tissue components (WMS or GMS).
Data analysis: WML and GML T1s and TInulls, and WMS and GMS T2*s were calculated in each user-defined ROI offline using single-component models in Matlab. Changes in PD-FSE signals, T1 and T2* values were plotted against D2O exchange time.
Results
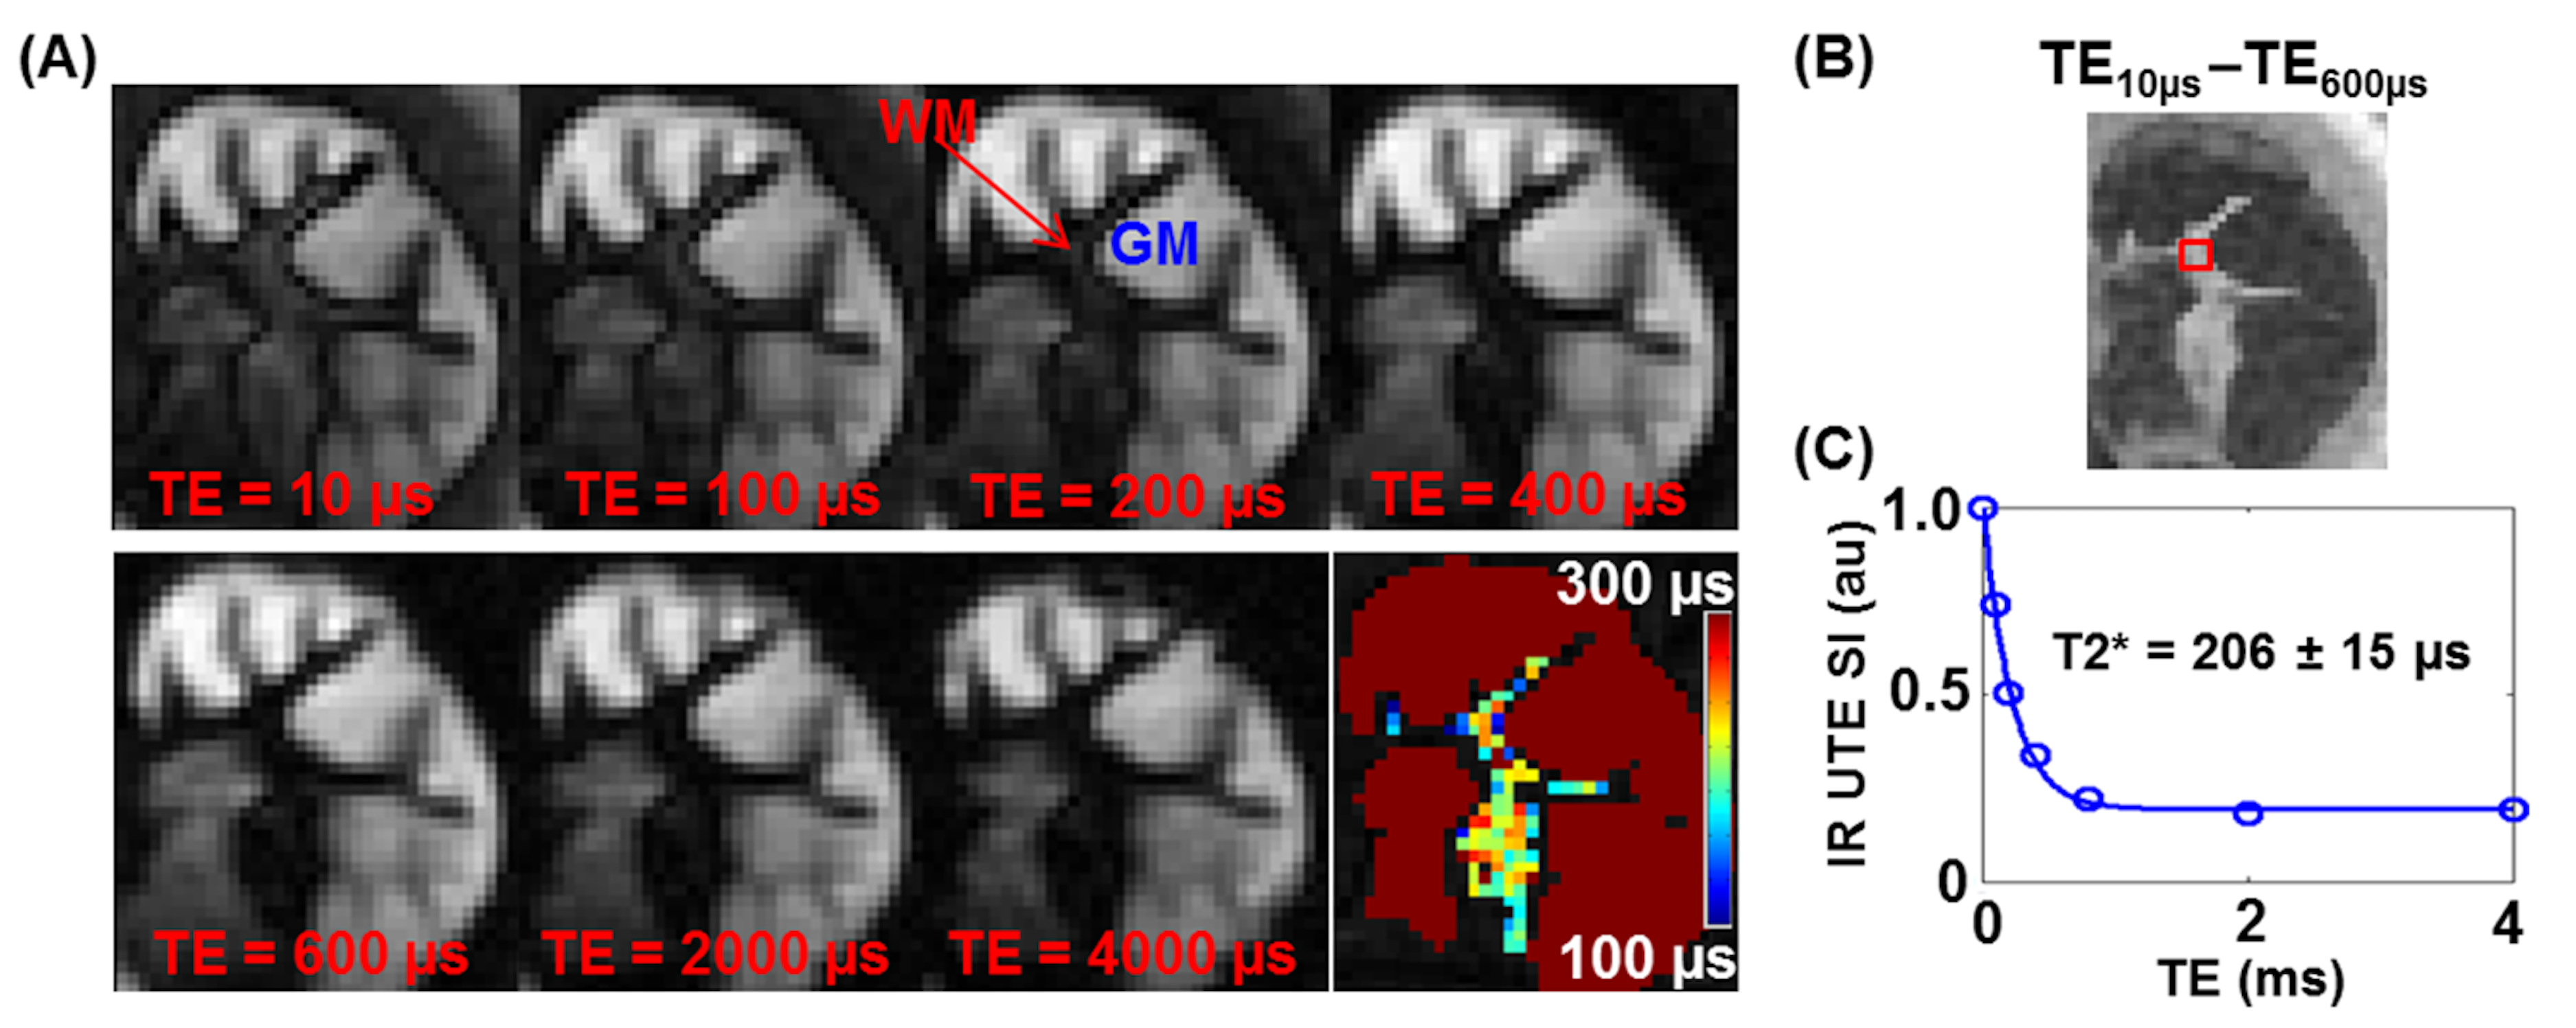
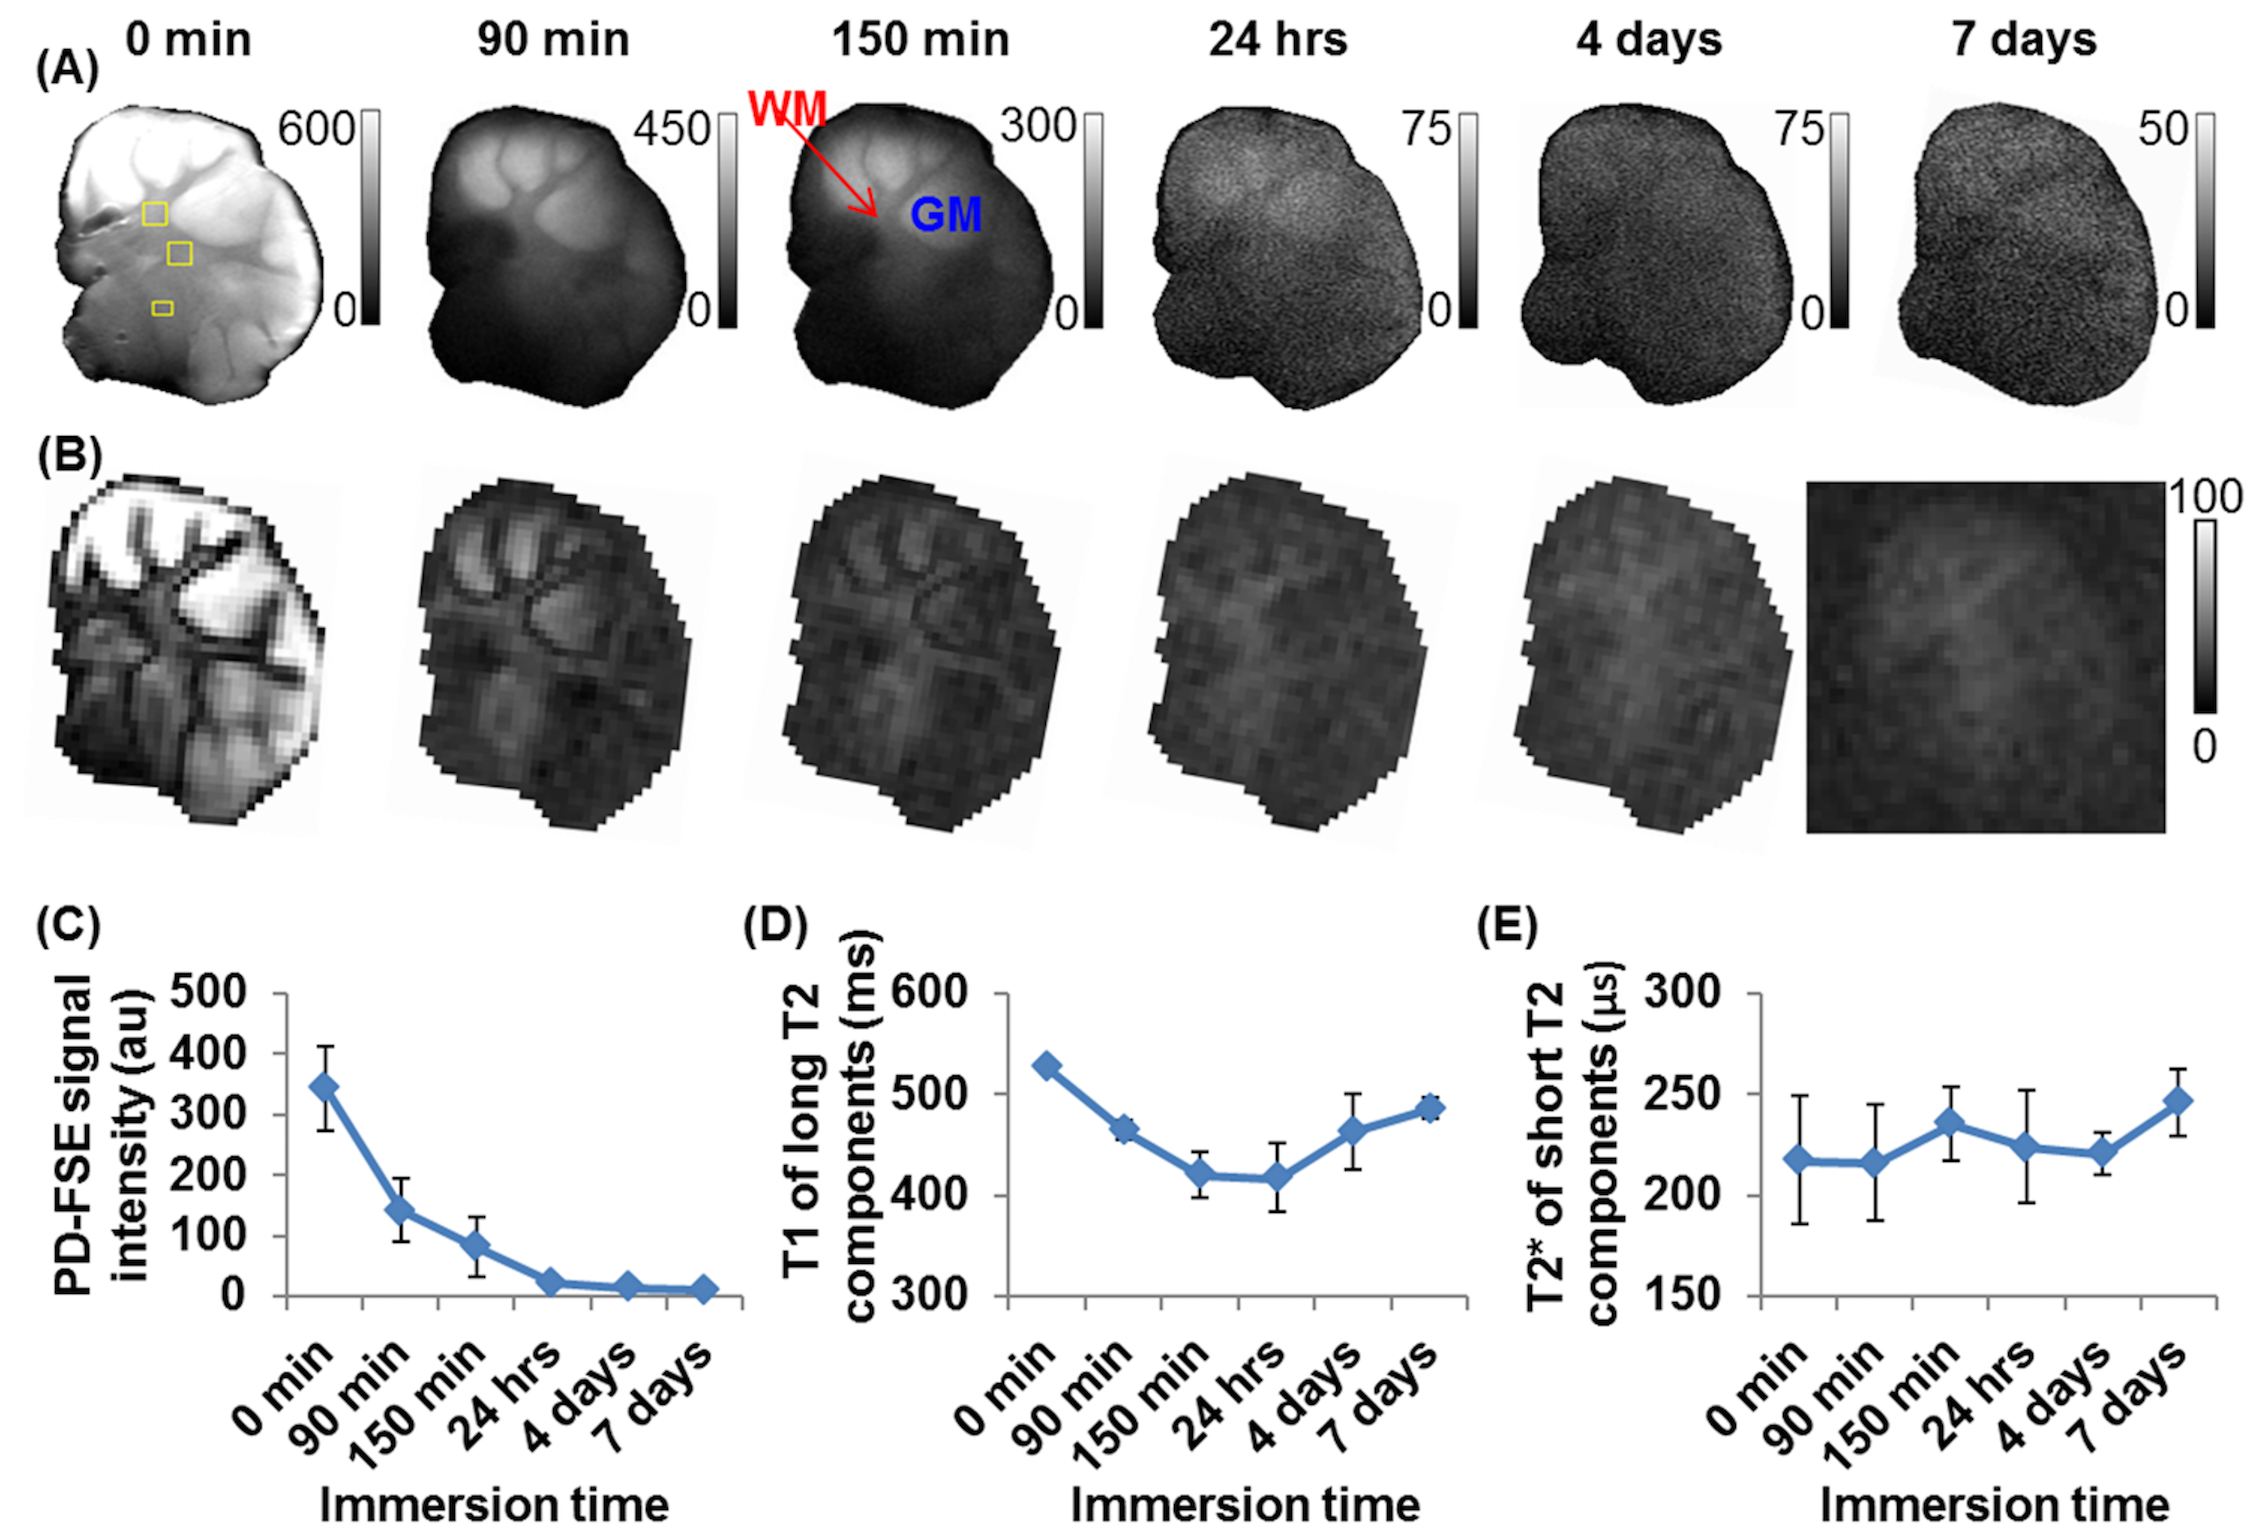
Figures 2-4 show representative results from one cerebral hemisphere specimen. The contrast between GM and WM changed significantly with inversion time (Figure 2B). Before exchange with D2O, WML and GML TInull values were ~300 ms and 370 ms, respectively (Figure 2D), and the WMS T2* was 200-300 ms at WML TInull = 300 ms (Figure 3A, lower panel, right corner). Subtracting the magnitude image of TE0.60ms from that of TE10µs provided positive signal for WM and negative signal for GM (Figure 3B). After 24-hr to 7-day exchange, the specimen showed near-zero PD-FSE signal (Figure 4A&C), but its IR-UTE signal, especially that of the WM, was still higher than background noise (Figure 4B). WML and GML T1s first decreased then increased, resulting in different TInull values. The WMS T2* showed minimal change (Figure 4D), ranging from 197 to 248 µs in all studied cerebral hemisphere specimens (data not shown) at all time points.
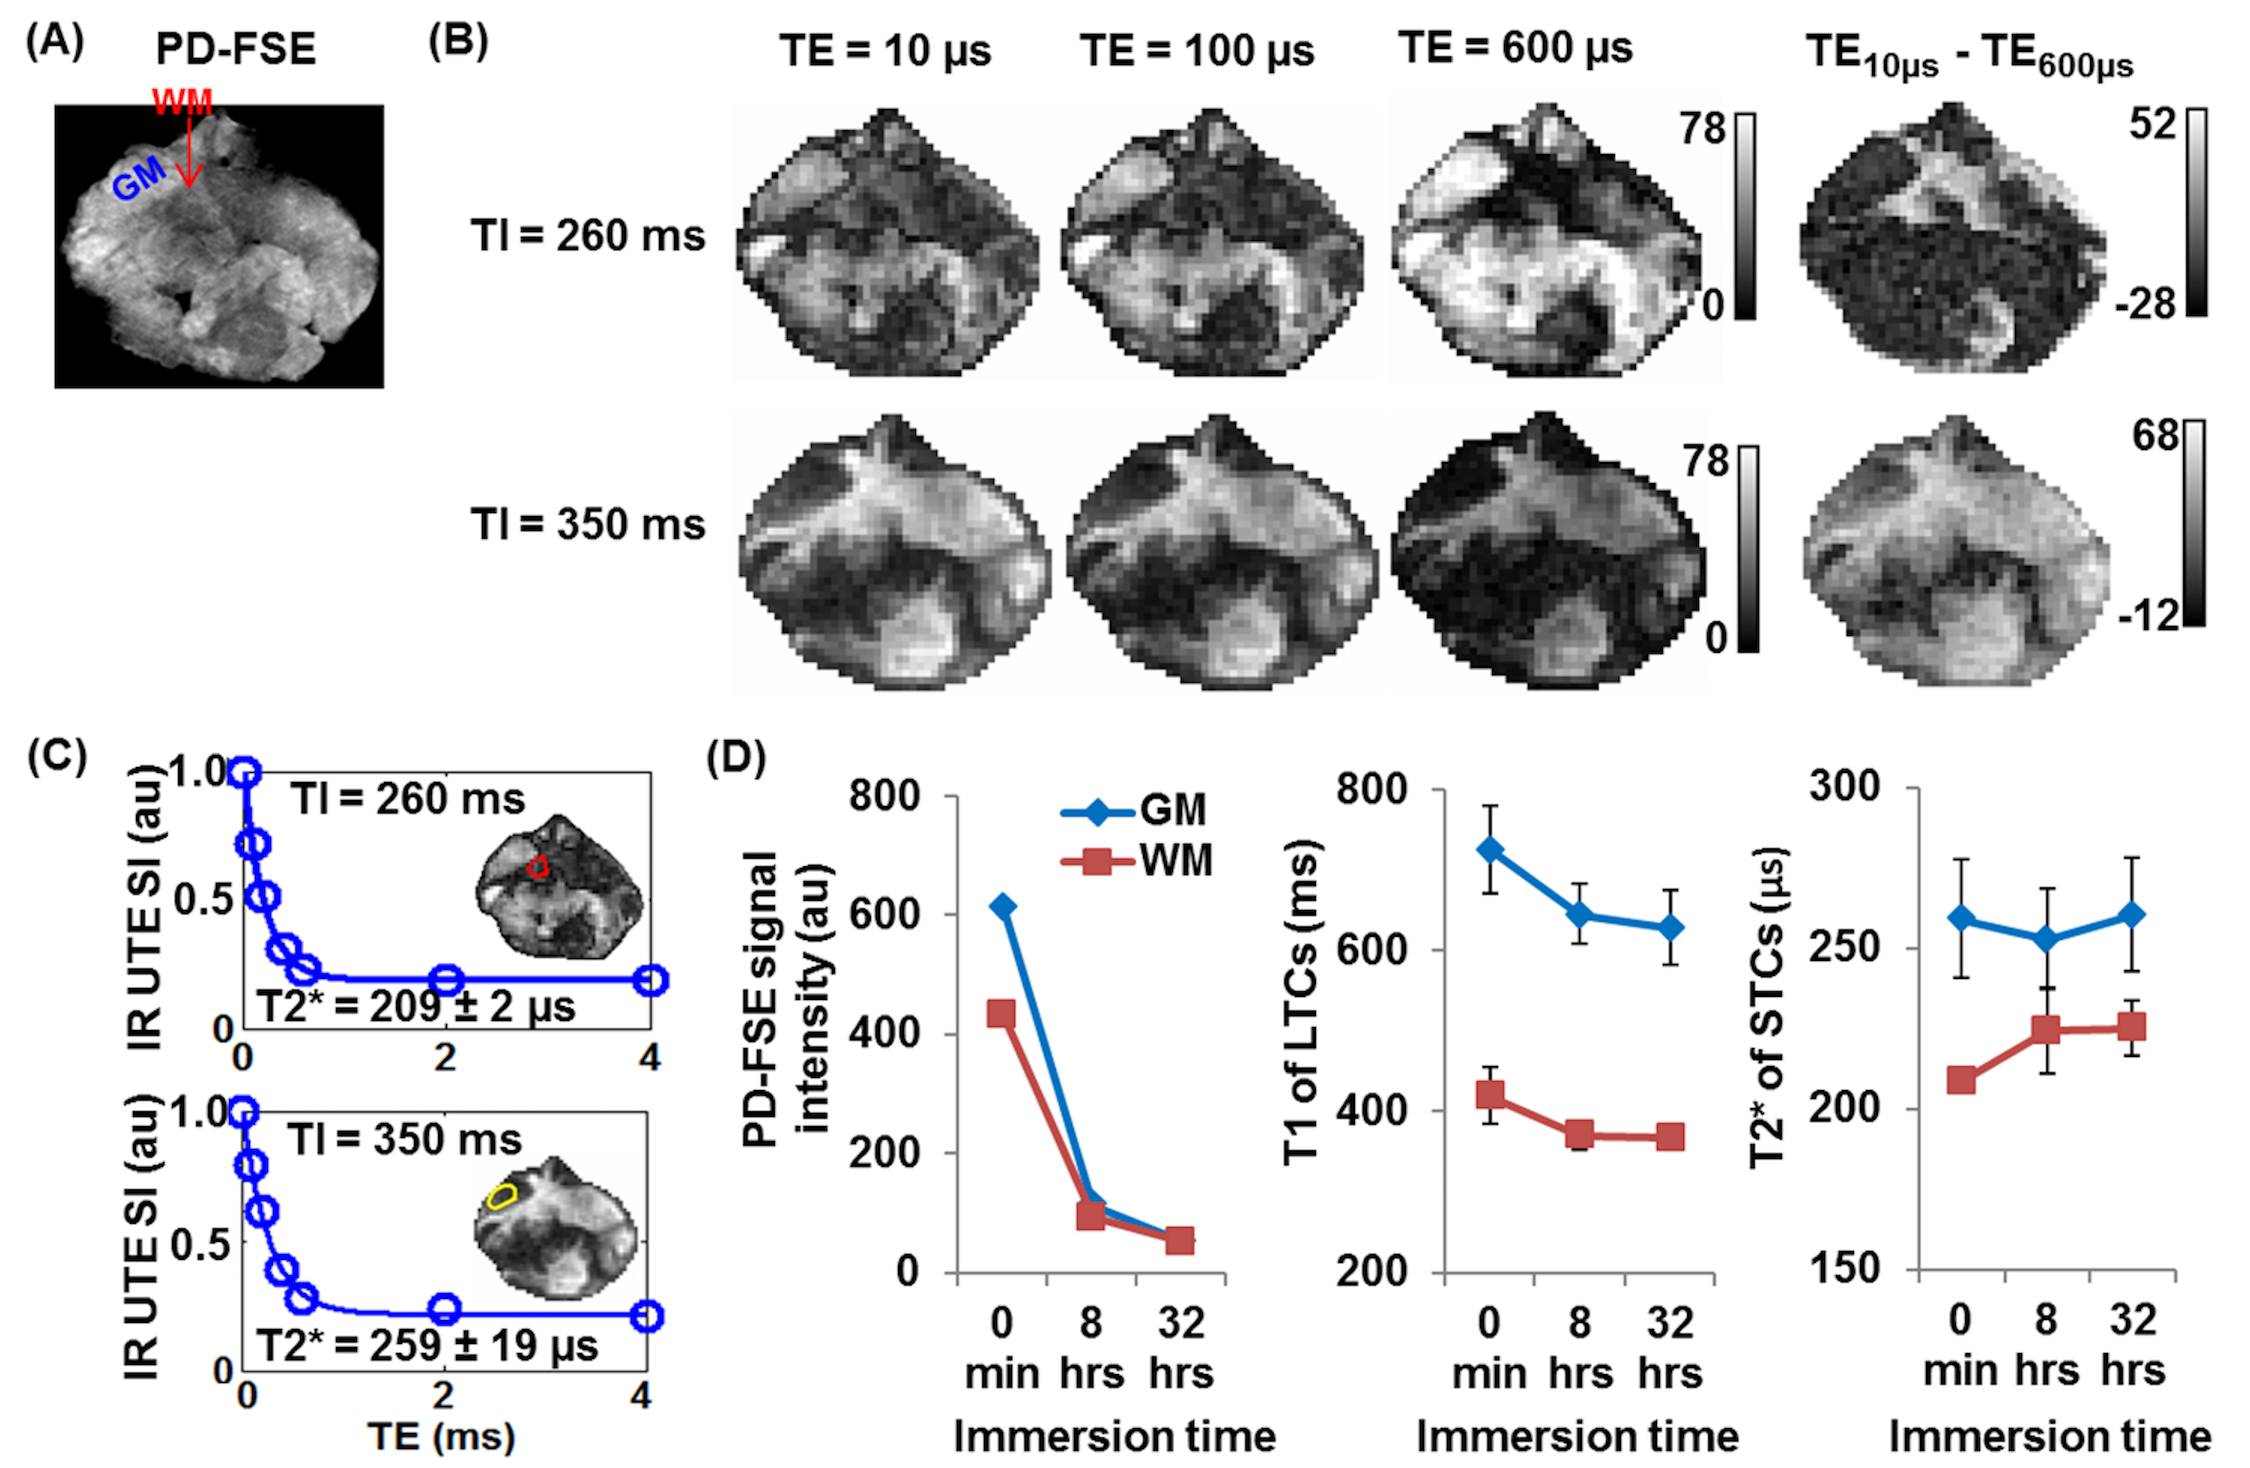
Figure 5 shows results from the cerebellar specimen. At WML TInull (260 ms), the subtraction image (TE10ms–TE0.6ms) provided positive signal in WM and negative signal in GM (Figure 5A). At GML TInull (350 ms), the subtraction image (TE10ms–TE0.6ms) showed positive signals for both WM and GM (Figure 5B). Both the WMS and GMS T2* values remained constant (209 ± 9 µs and 258 ± 4 µs, respectively) before and after exchange.
Discussion
Ultrashort T2 signals (50 µs<T2<1 ms) in myelinated nerves and excised rat spinal cord are thought to primarily originated from myelin lipid protons.2,3 In this study, the source of ultrashort T2 signals in ovine brain was explored. Instead of empirically choosing TInull, TInulls herein were estimated through measuring WML and GML T1s using the same IR-UTE sequences that were used for subsequent ultrashort T2* quantification. This enables accurate nulling of long T2 signals in conditions of tissue T1 change due to different pathological conditions. T1 change after D2O exchange might be caused first by a decrease of long T2 proton fraction, followed by an increase of D2O concentration in tissue. D2O tends to hamper proton longitudinal magnetization relaxation.4 Tissue degradation may also cause T1 increase,5 which is not considered here and needs further investigation.
D2O is not detectable using conventional 1H MRI techniques.6 After prolonged exchange with D2O, the specimens had negligible long T2 PD-FSE signals, but were still detectable on the IR-UTE images. The obtained T2* values (200-300 µs) were constant for both WMS and GMS before and after D2O exchange, and were comparable with those measured in myelin extract powder as well as in mixtures with D2O.7 These results support the view that the IR-UTE signal source is from non-aqueous protons.
Conclusion
The ultrashort T2* signals seen on IR-UTE images are unlikely to be from water protons exchangeable with deuterons in D2O. Their source is more likely to be myelin itself. The IR-UTE sequences may serve as a promising tool for directly imaging myelin loss in WM, as well as in GM.Acknowledgements
The authors acknowledge grant support from the NIH (1R01 NS092650). The authors would like to thank Dr. G.M. Bydder for his valuable inputs on data interpretation and proofreading.References
1. Du J, Ma G, Li S, Carl M, Szeverenyi NM, VandenBerg S, Corey-Bloom J, Bydder GM. Ultrashort echo time (UTE) magnetic resonance imaging of the short T2 components in white matter of the brain using a clinical 3T scanner. NeuroImage 2014;87:32-41.
2. Horch RA, Gore JC, Does MD. Origins of the ultrashort-T2 1H NMR signals in myelinated nerve: a direct measure of myelin content? Magn Reson Med 2011;66(1):24-31.
3. Wilhelm MJ, Ong HH, Wehrli SL, Li C, Tsai PH, Hackney DB, Wehrli FW. Direct magnetic resonance detection of myelin and prospects for quantitative imaging of myelin density. Proc Natl Acad Sci U S A 2012;109(24):9605-9610.
4. Zhong JH, Gore JC, Armitage IM. Quantitative studies of hydrodynamic effects and cross-relaxation in protein solutions and tissues with proton and deuteron longitudinal relaxation times. Magn Reson Med 1990;13(2):192-203.
5. De Guio F, Reyes S, Duering M, Pirpamer L, Chabriat H, Jouvent E. Decreased T1 Contrast between Gray Matter and Normal-Appearing White Matter in CADASIL. Am J Neuroradiol 2014;35(1):72-76.
6. Muller S, Seelig J. In vivo NMR Imaging of Deuterium. J Magn Reson 1987;72(3):456-466.
7. Sheth V, Shao H, Chen J, Vandenberg S, Corey-Bloom J, Bydder GM, Du J. Magnetic resonance imaging of myelin using ultrashort Echo time (UTE) pulse sequences: Phantom, specimen, volunteer and multiple sclerosis patient studies. Neuroimage 2016;136:37-44.
Figures