4731
Visualization of CSF flow using multi spin echo acquisition cine imaging (MUSACI)1Division of Radiology, Department of Medical Technology, Kyushu university hospital, Fukuoka, Japan, 2Department of Clinical Radiology, Graduate School of Medical Sciences, Kyushu University, 3Philips Electronics Japan
Synopsis
This study demonstrates a new CSF flow imaging using multi spin echo acquisition cine imaging (MUSACI). MUSACI can obtain the high resolution CSF flow images more than the conventional phase contrast technique, moreover it is simple method because need not use a labeling pulse such as the time-SLIP technique. MUSACI can provide both morphological and physiologic information regarding CSF flow in a single scan.
Purpose
Hydrocephalus occurs due to abnormalities of the cerebrospinal fluid (CSF) circulation caused by aqueductal stenosis, tumors, etc. Phase contrast MRI (PC-MRI) and time-spatial labeling inversion pulse (time-SLIP) are noninvasive MR techniques that can visualize the CSF circulation.1 The PC-MRI technique is useful for the assessment of the CSF circulation, but an additional sequence is needed for the assessment of morphology.2 On the other hand, the time-SLIP technique enables the visualization of CSF flow using a labeling pulse. However, the evaluation of CSF flow in multiple regions using time-SLIP technique is difficult because only one labelling pulse is applied in a single-slice 2D acquisition.3 In spin echo (SE) technique, the CSF flow is detected by the signal loss due to phase dispersion and flow void depending on its flow velocity and echo time (TE). The purpose of this study was to evaluate the visualization of CSF flow using a novel method named multi spin echo acquisition cine imaging (MUSACI).Methods
The spin dispersion due to spin-phase effect is a change of the precession phase when a proton moves through a magnetic field gradient.4 In x-axis, the proton phase shift ($$$φ$$$) when the resonant frequency of the proton ($$$ω'$$$) moves at constant velocity ($$$v$$$) for time ($$$t$$$) within a gradient having constant magnitude ($$$G$$$) along the x-axis is given by;$$φ=∫ω'dt=∫γGvtdt=γGv∫tdt=(γGvt^2)/2$$
where $$$γ$$$ is the gyromagnetic ratio. This equation demonstrates that the proton phase shift influenced by a moving spin will be proportional to its velocity and the strength of the applied gradient, and the square of the length of time it moves within that gradient. The same respective equation (1) apply to the y- and z-axes.
The flow void phenomenon occurs in only the slice direction. The flow void appears in the condition that satisfy the following equation;$$v≥2d/TE$$
where $$$v$$$ is velocity, and $$$d$$$ is slice thickness. This equation indicates that the flow void readily appears at a higher velocity, however this appearance depends not only on velocity but also on TE. Thus, the use of multi spin echo acquisition allows for cine images of CSF flow because the flow void occurs at a different degree at each TE depending on its velocity.
All images were acquired on a 3T MR scanner (Ingenia 3.0T; Philips Healthcare) using a ds head coil and ds base coil. MUSACI images were acquired in the sagittal plane using 3D multi echo volume isotropic turbo spin echo acquisition (VISTA) with pulse gated. Turbo spin echo (TSE) factor and echo numbers were modified within one pulse wave at each volunteer and clinical case. Other scan parameters were as follows: TR/TE=2RR/7.3+echo number (80 ms step), FOV=240×240 mm2, matrix=416×411, slice thickness=1.2 mm (recon to 0.6 mm), slices=25, total scan time=approx. 5 min.
Results
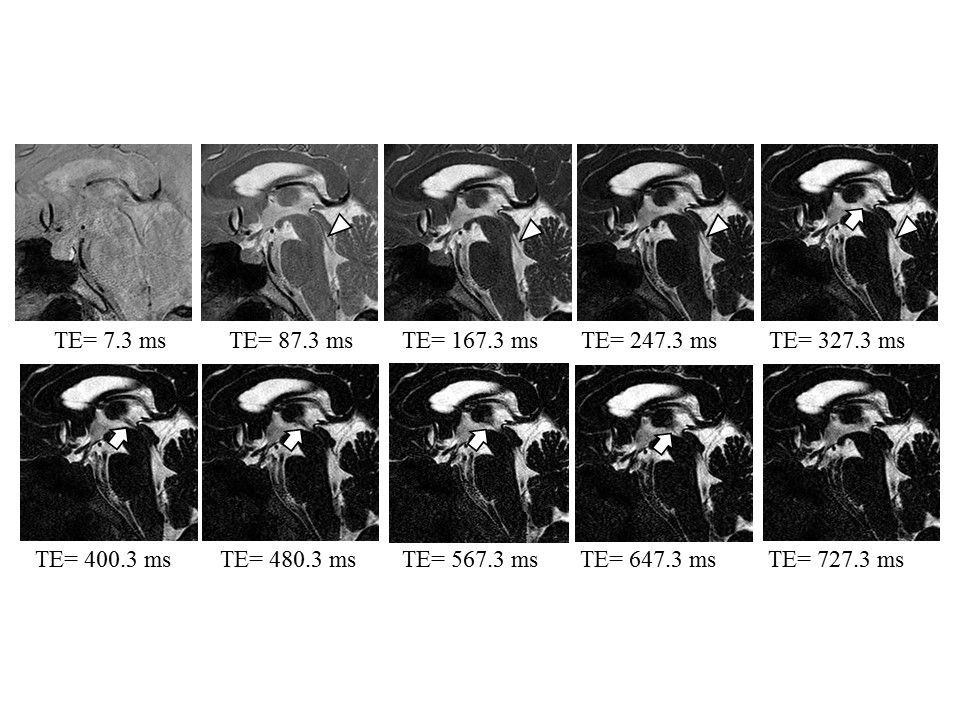
Figure 1 shows a series of midsagittal MUSACI images in a healthy volunteer. The anterograde CSF flow from the aqueduct to the fourth ventricle is observed on the images of TE 87.3 – 327.3 ms (arrow heads), and the retrograde flow from the aqueduct to the third ventricle is observed on the images of TE 327.3 – 647.3 ms (arrows). Moreover, MUSACI is able to image not only a midsagittal section but also the off-midline section for the foramen of Monro in the single 3D volume acquisition.
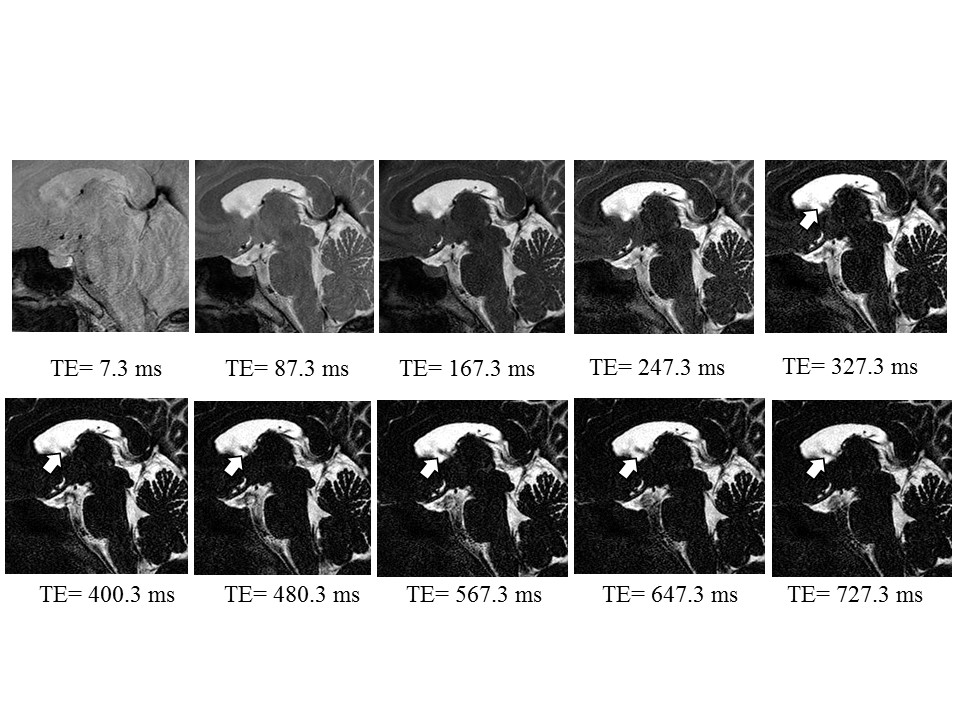
Figure 2 shows a series of MUSACI images at the section of the foramen of Monro. The retrograde CSF flow from the foramen of Monro to the lateral ventricle is observed on the images of TE 327.3 – 727.3 ms (arrows).
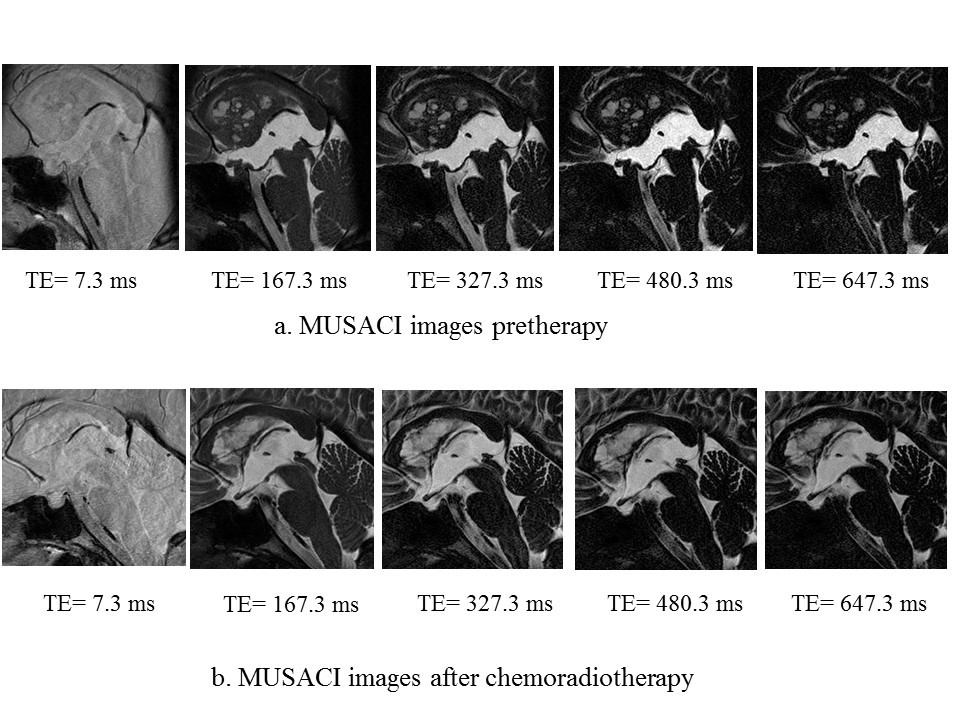
Figure 3 shows a series of midsagittal MUSACI images in a patient with germinoma in the pineal region and multiple disseminations in the lateral ventricles. There was no CSF flow in the third ventricle, aqueduct and the fourth ventricle because of the obstructions by the tumors (Fig. 3a). The MUSACI images acquired after chemoradiotherapy show the recovery of CSF flow from the aqueduct to the third ventricle or the fourth ventricle, and from the foramen of Monro to the third ventricle (Fig. 3b).
Discussion
MUSACI was able to visualize the high resolution CSF flow images in the single 3D volume acquisition. The PC-MRI needs an additional scan for morphological image, but MUSACI is not necessary to additional scan for morphological image. Moreover, MUSACI can visualize of CSF flow in multiple regions in the single 3D volume scan unlike time-SLIP technique.Conclusion
MUSACI can provide both morphological and physiologic information regarding CSF flow in a single scan. This method could be useful in the diagnosis and management of hydrocephalus.Acknowledgements
No acknowledgement found.References
1. Kelly EJ, Yamada S. Cerebrospinal fluid studies and recent advancements. Semin Ultrasound CT MR 37(2):92-9 2016.
2. Algin O, Hakyemez B, Parlak M. Phase-contrast MRI and 3D-CISS versus contrast-enhanced MR cisternography on the evaluation of aqueductal. Neuroradiology 52(2):99-108 2010.
3. Yamada S, Miyazaki M, Kanazawa H et al.. Visualization of cerebrospinal fluid movement with spin labeling at MR imaging: preliminary results in normal and pathophysiologic conditions. Radiology 249(2) 644-652 2008.
4. von Schulthess GK, Higgins CB. Blood flow imaging with MR: spin-phase phenomena. Radiology 157(3):687-95 1985.
Figures