4730
Cross-validation of $$$T_2$$$-prepared bSSFP blood oximetry $$$in$$$ $$$vivo$$$1Department of Radiology, University of Pennsylvania, Philadelphia, PA, United States
Synopsis
Susceptometry-based oximetry is a well-established, robust method for quantifying hemoglobin oxygen saturation (HbO2) in vivo; but the method is somewhat limited by the orientation of the vessel of interest relative to Bo. T2-based oximetry, based on the dependence of blood water T2 on HbO2, provides greater flexibility with respect to vessel geometry. However, the measured T2 critically depends on Bo and sequence-specific imaging parameters. Here, a T2-prepared bSSFP sequence and appropriate calibration curve were used to extract HbO2 at the superior sagittal sinus and the results were compared to susceptometry-based oximetry. The agreement between both methods was excellent with 2% bias.
PURPOSE
Susceptometry-based oximetry is a well-established, robust method that exploits the intrinsic susceptibility of deoxyhemoglobin for quantification of whole-blood oxygen saturation (HbO2). However, the accuracy of the underlying model is limited to vessels oriented <30° from Bo. An alternative method, is based on the dependence of blood water T2 on HbO2, which does not depend on vessel geometry.3 Whole-blood T2, is a function of field strength, inter-refocusing pulse interval of the T2 preparation and sequence-specific parameters, which demand the relationship between T2 and HbO2 to be determined upfront for the particular pulse sequence used. We have recently generated a calibration curve at 1.5T ex vivo for a T2-prepared bSSFP sequence, which offers rapid imaging time, high in-plane resolution and SNR efficiency. Here, we used this setup to measure HbO2 in vivo at the superior sagittal sinus (SSS) and compared these results to those obtained with susceptometry-based oximetry.METHODS
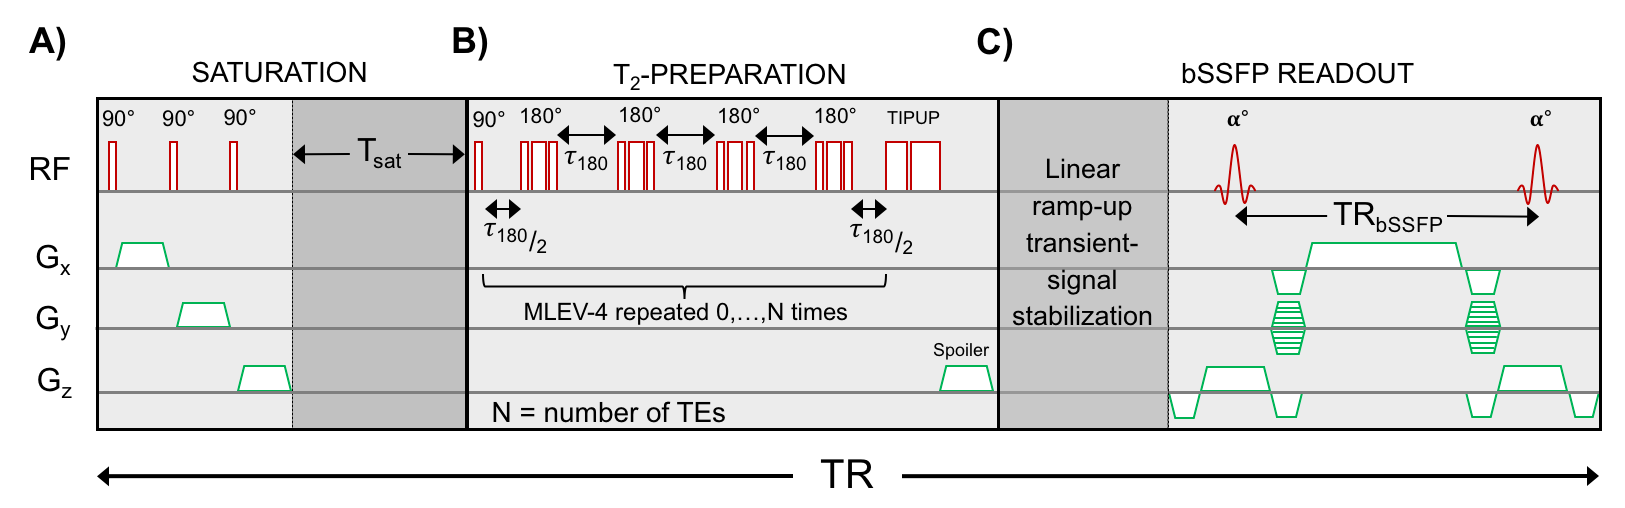
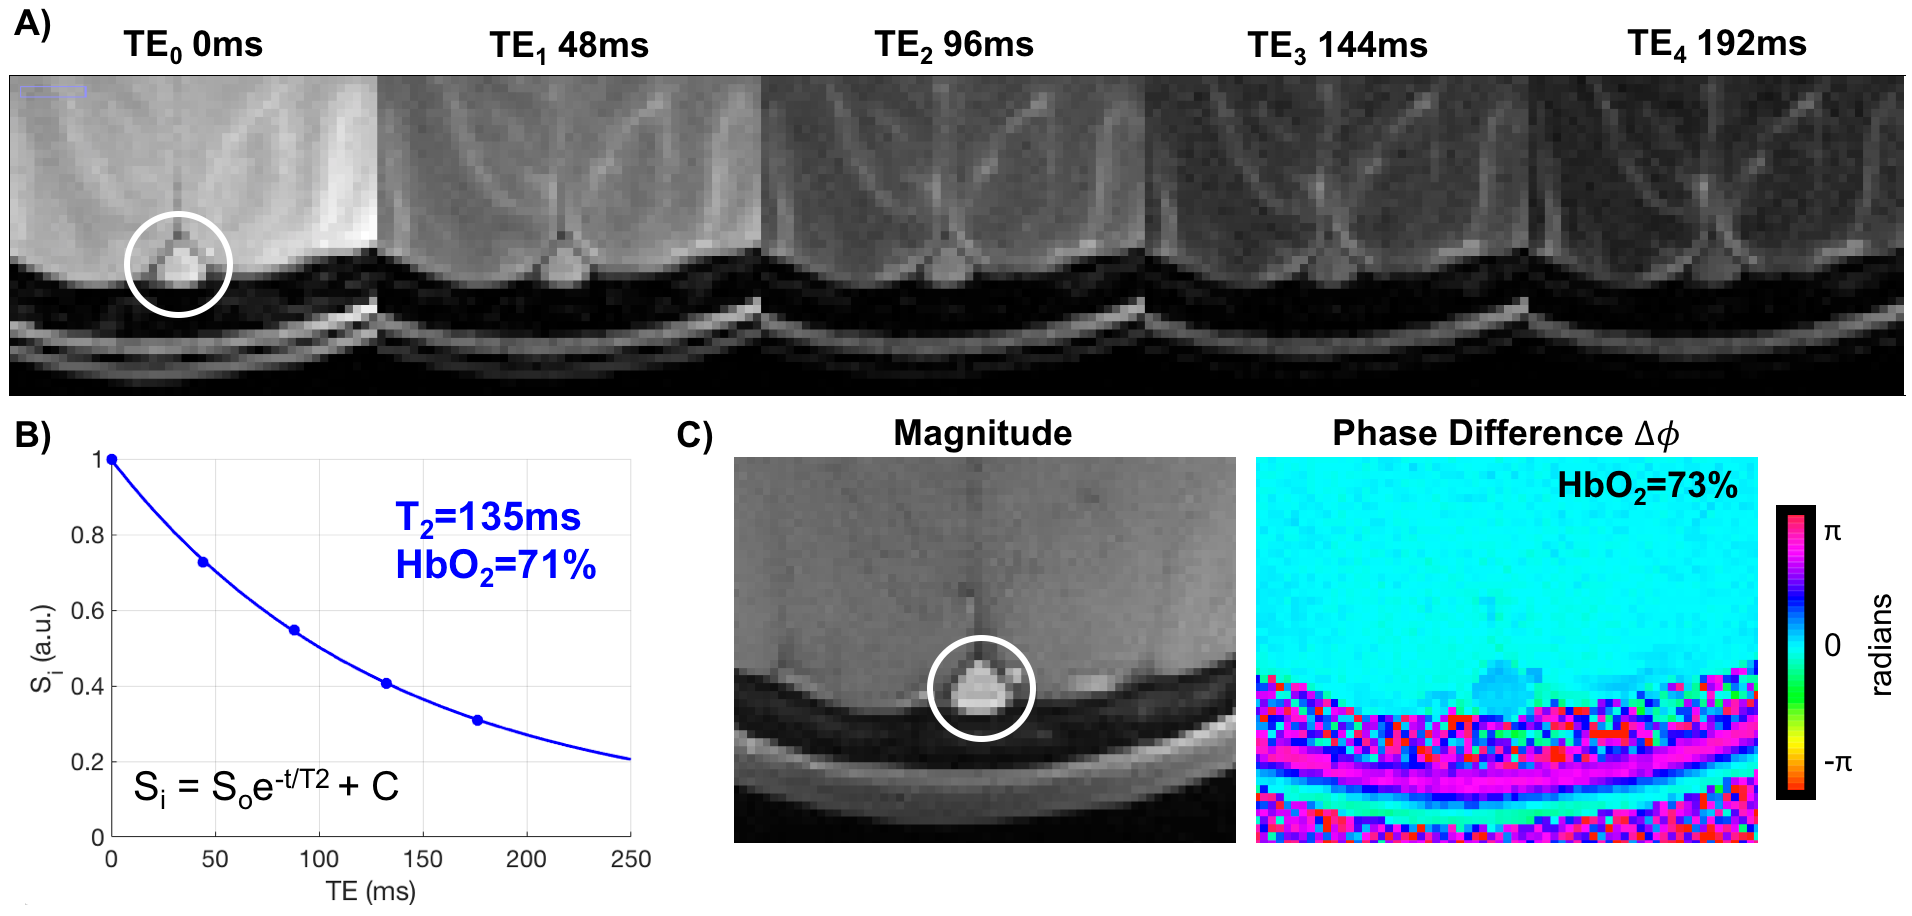
Human volunteers were scanned in a 1.5T scanner (Siemens Avanto) with a 10-channel head coil. Single-slice T2-prepared bSSFP (Fig. 1) were acquired at the SSS to estimate T2 of blood. Imaging parameters: TR=3900ms, T2-preparation TEs=0,48,96,144,192ms, bSSFP TR/TE=3.8/1.9ms, Tsat=3000ms, FOV=128×128mm2, voxel size=1.25×1.25×5mm3, FA=60°, 5 averages, ramp up linear signal stabilization and 14 reference lines prior to half-Fourier acquisition and inter-refocusing pulse interval (τ180) of 12ms. T2 was obtained via a 3-parameter fit to account for the fact that bSSFP transient signal approaches non-zero amplitude.4 Furthermore, TEs were corrected for the time during which the magnetization is stored along z during the composite refocusing pulses (Fig. 1).5 The T2 of blood was then converted to HbO2 using the Luz-Meiboom model as described by Wright et al 6. Constants T2o and K were previously determined in our laboratory for this T2-prepared bSSFP with the above imaging parameters. Extracted HbO2 values were then compared against those from susceptometry-based oximetry: $$$ HbO_2=[1-\frac{(2|Δφ|}{(γ χ_{do} ΔTE B_o (cos^2 θ-1/3) Hct))}] $$$.1 Here, is the average phase difference between intravascular blood and the surrounding tissue,7 is the susceptibility difference (in cgs units) between fully deoxygenated and fully oxygenated erythrocytes, is the inter-echo spacing of the gradient-echo sequence used,1 is the angle of the SSS with respect to Bo and Hct is the hematocrit. T2-based HbO2 values were then compared against those estimated via susceptometry-derived HbO2 as the independent variable. Imaging parameters: TR=50ms, TE1=6.4ms, TE2=11.9ms, FOV=128×128mm2, voxel size=1×1×5mm3, FA=17°. Furthermore, in order to examine the robustness of T2-prepared bSSFP to blood flow velocity in vivo, the latter was measured in the SSS with MRI phase-contrast. Imaging parameters: TR=21.1ms, TE=6.5ms, FOV=200×200mm2, voxel size=0.625×0.625×5mm3, VENC = 30cm/s, and FA=15°. Intraclass correlation coefficient (ICC), Bland-Altman and paired t-tests were used to evaluate the agreement between both oximetry methods.RESULTS
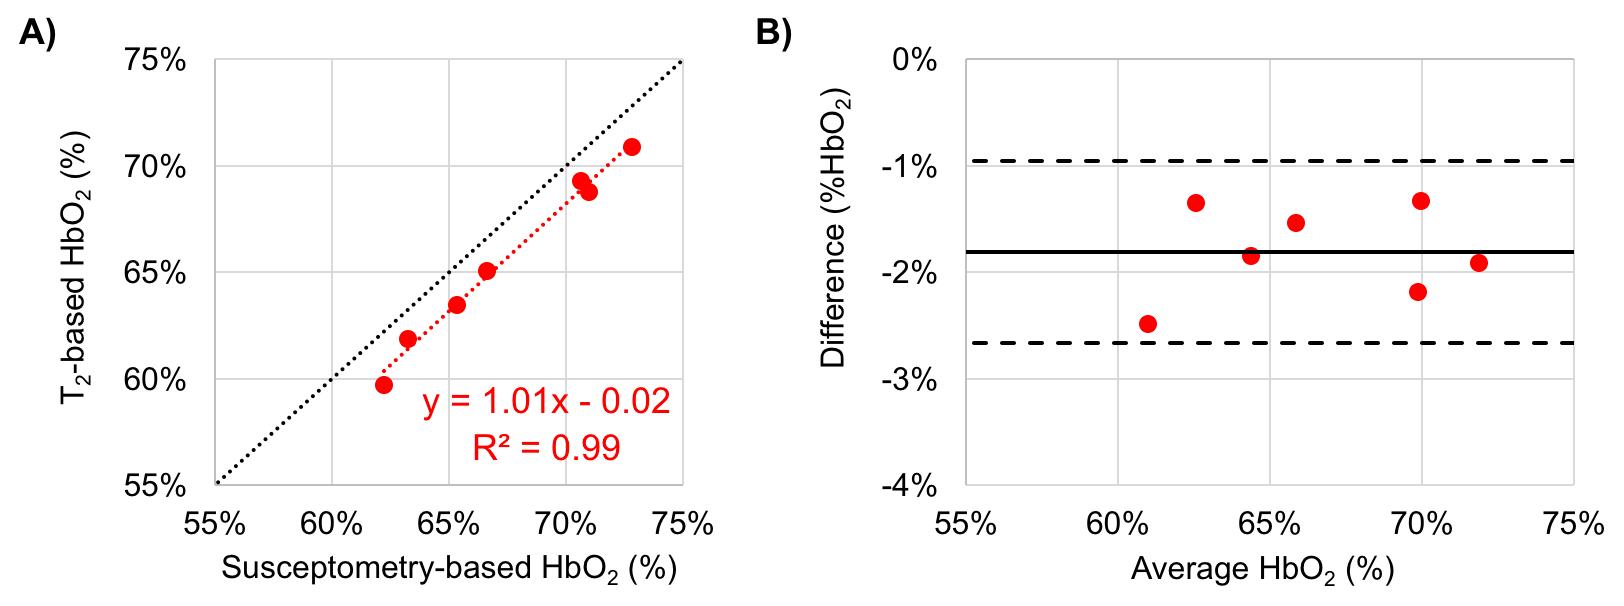
Seven healthy young volunteers (39.8±3.1 years old, 4 male) participated in this study. The values of T2o and K used were 169ms and 17.6Hz, respectively. Average HbO2 at the SSS was 65±4% and 67±4% via T2-and susceptometry-based oximetry, respectively (Fig. 2). In Fig. 3A the data from the two methods are plotted against each other. We notice that all T2-based SvO2 values are below the line of identity suggesting a slight bias. The latter is confirmed by the Bland-Altman plot (Fig. 3B), which yielded a mean difference (SvO2T2 – SvO2Susc) of -2.0% (±1.7%). Nevertheless, the ICC of 0.935 (p=0.001) suggests remarkable agreement between the two oximetric methods.DISCUSSION AND CONCLUSIONs
Good agreement was found between T2-prepared bSSFP oximetry and susceptometry-based oximetry in the SSS. This vessel was selected because it is relatively straight and runs roughly parallel to Bo with participants supine in the MRI scanner. Further, the model had previously been evaluated both experimentally2 and numerically.8 However, cerebral oxygen metabolism is tightly regulated, which limits the range of baseline SvO2 values. Nonetheless, results suggest that T2-prepared bSSFF is a reliable and accurate technique to extract HbO2 in vivo. Further work is required to examine the performance of the method over a wider range of oxygen saturations at anatomic locations where susceptometry is not practical.Acknowledgements
NIH grants U01-HD087180 and K25 HL111422.References
1. Fernandez-Seara MA, Techawiboonwong A, Detre JA, Wehrli FW. MR susceptometry for measuring global brain oxygen extraction. Magn Reson Med. 2006;55:967-73.
2. Jain V, Langham MC, Wehrli FW. MRI estimation of global brain oxygen consumption rate. J Cereb Blood Flow Metab. 2010;30:1598-607.
3. Thulborn KR, Waterton JC, Matthews PM, Radda GK. Oxygenation dependence of the transverse relaxation time of water protons in whole blood at high field. Biochim Biophys Acta. 1982;714(2):265-70.
4. Akçakaya M, Basha TA, Weingärtner S, Roujol S, Berg S, Nezafat R. Improved quantitative myocardial T2 mapping: impact of the fitting model. Magn Reson Med. 2015;74:93-105.
5. Foltz WD, Stainsby JA, Wright GA. T2 accuracy on a whole-body imager. Magn Reson Med. 1997;38:759-68.
6. Wright G, Hu B, Macovski A. Estimating oxygen saturation of blood in vivo with MR imaging at 1.5T. Magn Reson Med. 1991;1:275-83.
7. Jain V, Abdulmalik O, Propert KJ, Wehrli FW. Investigating the magnetic susceptibility properties of fresh human blood for non invasive oxygen saturation quantification. Magn Reson Med. 2011;86:863-67.
8. Li C., Langham MC, Epstein CL, Magland JF, Wu J, Gee J, Wehrli FW. Accuracy of the cylinder approximation for susceptometric measurement of intravascular oxygen saturation. Magn Reson Med. 2012; 67:808-13.
Figures