4729
Cardiac-induced pulsatility of blood flow resolved in sub-millimeter cerebral veins using phase contrast MRI at 7 Tesla1CUBRIC, School of Psychology, Cardiff University, Cardiff, United Kingdom, 2Siemens Healthcare Ltd, Frimley, Caberley, United Kingdom
Synopsis
We report the first measurement of venous flow pulsatility in cerebral veins with sub-millimeter diameters using phase contrast MRI. This work exploits the increased signal and finer spatial resolution available at 7 Tesla, over lower field strengths. We suggest that the observed venous pulsatility is a passive response to intracranial pressure changes caused by arterial pulsatility. These measurements may be applied to pathology in which there is compromised venous flow, extending such investigations to the smaller cerebral veins and offering a better understanding of the temporal dynamics of cerebral venous flow.
Introduction
Pulsatility in cerebral veins is thought to be a passive process, reacting to intracranial pressure changes arising due to arterial pulsatility. This normal process may be compromised in some pathologies, such as normal pressure hydrocephalus1. Non-invasive measurements of venous pulsatility have the potential to provide insight to such pathologies. Phase contrast MRI (pcMRI) is a powerful tool for measuring blood velocity in cerebral blood vessels and venous pulsatility has been observed previously2. However, so far, these studies of venous pulsatility have been limited to large cerebral veins, such as the superior sagittal sinus and jugular veins. Applying these measurements to smaller cortical veins would allow subtler changes to be studied and a better understanding to be gained of the functional consequences of venous pulsatility at the tissue level. Our study makes use of the increased signal to image at finer spatial resolution at 7 Tesla. We assess whether venous pulsatility can be resolved in veins with sub-millimeter diameters.Methods
Image acquisition: Six subjects (4 female/2 male; 26-38 years) participated in this study. Measurements were performed on a whole-body 7T research MR-system (Siemens Healthcare GmbH, Erlangen, Germany), with a 32-channel head receive/volume transmit coil. A T2*-weighted 3D FLASH image (1mm isotropic, TR/TE = 23/11ms) was acquired for slice planning and identification of cerebral veins (hypointense) and arteries (hyperintense). Two sets of cardiac-gated pcMRI data (venc = 50cm/s through slice, single slice, 3 averages per cardiac phase) were acquired over an acquisition window 100ms shorter than the subject’s average cardiac period, approximately 40 phases of the cardiac cycle. Prospective cardiac gating was performed using a photoplethysmogram placed on the subject’s finger. The first pcMRI was positioned perpendicular to the superior sagittal sinus (1x1x40mm; 256mm FOV; TR/TE = 19.1/5ms). The second pcMRI was acquired at finer voxel resolution (0.6x0.6x5mm; 192mm FOV; TR/TE = 19.3/5ms), positioned perpendicular to a small medial-posterior cortical vein, draining into the superior sagittal sinus, selected for being straight over the extent of the image volume.
Analysis: Cerebral blood vessels were segmented using the magnitude of the pcMRI and their diameter was estimated manually. Each vessel was categorized as superior sagittal sinus, vein or artery based on the T2*-weighted FLASH image. Cardiac cycle resolved velocity time-courses were calculated from the phase of the pcMRI.
Results
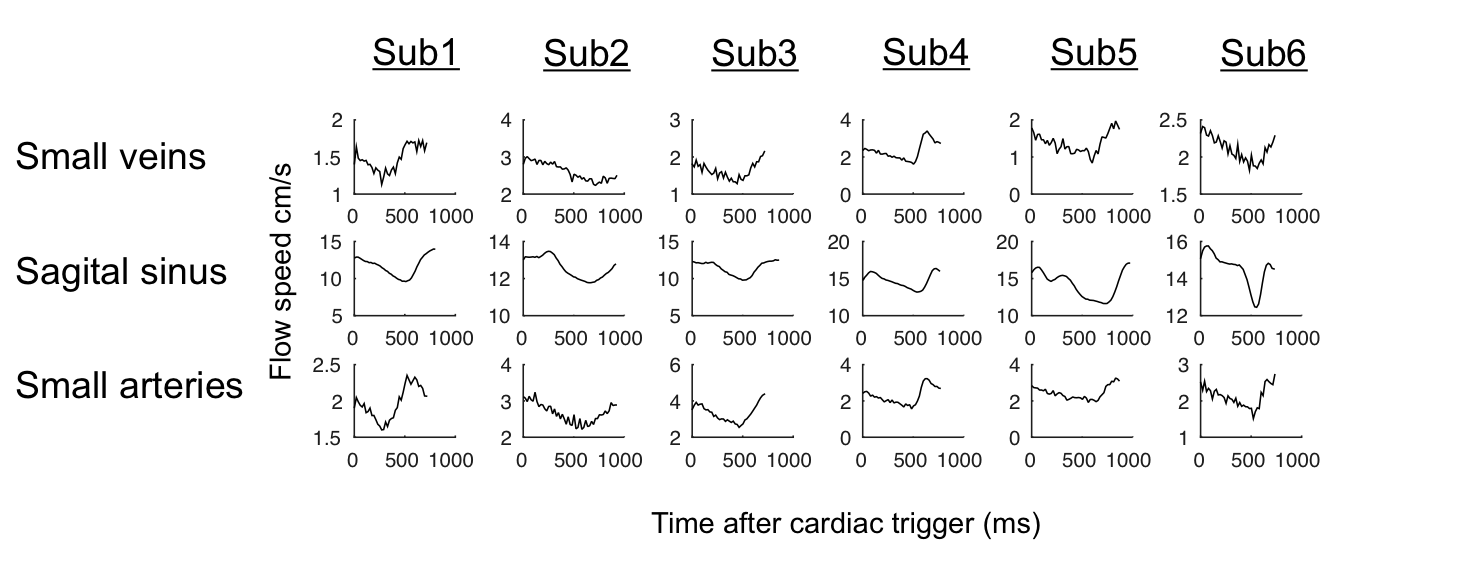
Cardiac cycle time-locked pulsatility was observed in a range of veins, including at least one sub-millimeter diameter vein in each subject. The cardiac cycle time-course for an example 0.6 mm diameter vein is shown in Figure 1, as well as example images. Figure 2 shows the shape of the pulsatile time-course, comparing small veins, the superior sagittal sinus and small arteries. The small vein time-course is similar to that of the small arteries, whereas the sagittal sinus time-course is delayed by approximately 50ms (p<0.05) with respect to small arteries.Discussion
The similar pulsatile time-courses between small veins and small arteries are consistent with a passive mechanism causing venous pulsatility, due to venous volumes decreasing in response to arterial volume increase and transient rise in intracranial pressure. A delayed sagittal sinus time-course is consistent with waves of pulsatile flow propagating downstream from the pulsatile small veins. We used a simple method for segmenting blood vessels, based on thresholding the magnitude of the pcMRI. We chose not to use more sophisticated methods, which use the characteristic signal of pulsatility for segmentation3, since these signals were the objective of our study and we did not want to bias our results. Future work will incorporate these methods into our measurement. Our measurements feature variability in delay across subjects due to the anatomical distance between the finger photoplethysmogram and the cerebral vasculature. Future work will assess whether using an electrocardiogram for cardiac gating would provide a less variable delay than the photoplethysmogram. Further, our technique may benefit from the increased coverage available with a 3D acquisition, as demonstrated recently by Schuchardt et al.4.Conclusion
We report the first MRI-based observations of pulsatility in sub-millimeter diameter cerebral veins. This approach makes use of the increased signal and finer spatial resolution available at 7 Tesla.Acknowledgements
No acknowledgement found.References
1. Greitz D. Radiological assessment of hydrocephalus: new theories and implications for therapy. Neurosurg Rev. 2004;27:145–65.
2. Stoquart-ElSankari S, Lehmann P, Villette A, et al. A phase-contrast MRI study of physiologic cerebral venous flow. J Cereb Blood Flow Metab. 2009;29:1208-1215.
3. Alperin N and Lee S. PUBS: Pulsatility-based segmentation of lumens conducting non-steady flow. Magn Reson Med. 2003;49(5):934-944.
4. Schuchardt F, Schroeder L, Anastasopoulos C, et al. In vivo analysis of physiological 3D blood flow of cerebral veins. Eur Radiol. 2015;25:2371–2380.
Figures
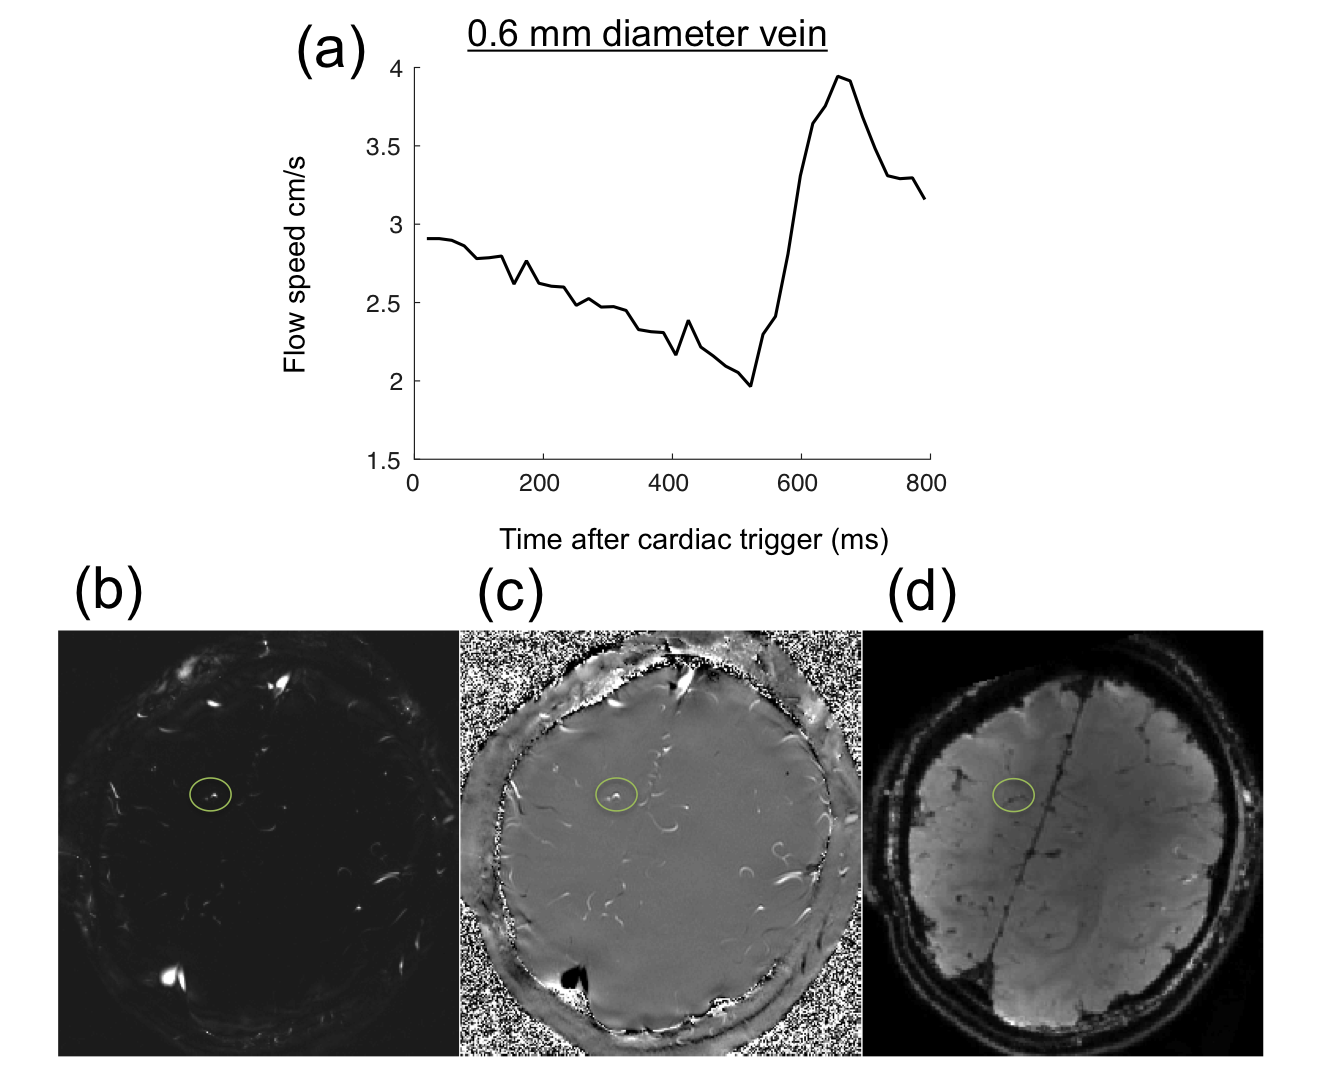
Figure 1: (a) Cardiac cycle synchronized blood flow time-course for an example cerebral vein, with 0.6mm diameter.
Bottom row: Showing the vein’s position on (b) the magnitude pcMRI image, (c) the phase pcMRI image and (d) the T2*-weighted FLASH image, re-sliced to the same orientation as the pcMRI.