4725
Automatic Quantification of Haematoma and Surrounding Oedema in MRI of Acute Spontaneous Intracerebral Haemorrhage: Preliminary Results for the TICH-2 MRI Sub-study1Division of Clinical Neuroscience, University of Nottingham, Nottingham, United Kingdom, 2Department of Neuroradiology, Nottingham University Hospitals, United Kingdom, 3Department of Radiology, Royal Derby Hospital, United Kingdom, 4Department of Medicine, National University of Malaysia, Malaysia, 5Imaging Department, Leicester Royal Infirmary, United Kingdom, 6Department of Medical Physics and Clinical Engineering, Nottingham University Hospitals, United Kingdom
Synopsis
In this work, we propose to take advantage of improved contrast seen on magnetic resonance (MR) images of patients with acute spontaneous intracerebral haemorrhage (SICH), and introduce an automated algorithm for haematoma and oedema segmentation from these images. To our knowledge, there is no previously proposed segmentation technique for SICH that utilises MR images directly. The method is based on k-means clustering of image intensities for haematoma segmentation and voxel-wise dynamic thresholding of hyper-intensities for oedema segmentation. Preliminary results using the Dice score metric to measure segmentation overlaps between labellings yielded by the proposed algorithm and five different expert raters show that our technique has the potential to be an effective way to automatically delineate haematoma and perihaematoma oedema extent directly from MR images.
Purpose
Segmentation of haematoma and surrounding oedema in spontaneous intracerebral haemorrhage (SICH) provides a tool to evaluate inflammatory response1-3. Manual delineation in studies with large number of patients is time-consuming and, thus, not routinely performed. Therefore, we propose an automatic method for the segmentation of both haematoma and oedema from MRI of patients with SICH. It can be applied in multi-centre clinical trials and is evaluated using patient data from the MRI sub-study of the main TICH-2 trial4.Methods
We utilise 2-dimensional T2, T2*-GRE and FLAIR sequences and a 3-dimensional T1 sequence. All images are linearly rescaled to have intensities in the [0,1000] range, taking the 99th-percentile of all intensities greater than the median as top cut-off point. The T2, T2*-GRE and FLAIR sequences are then rigidly registered to their corresponding T1. We also create a whole-brain mask and a white matter-grey matter (WM-GM) mask by using labels from the Colin27 template5.
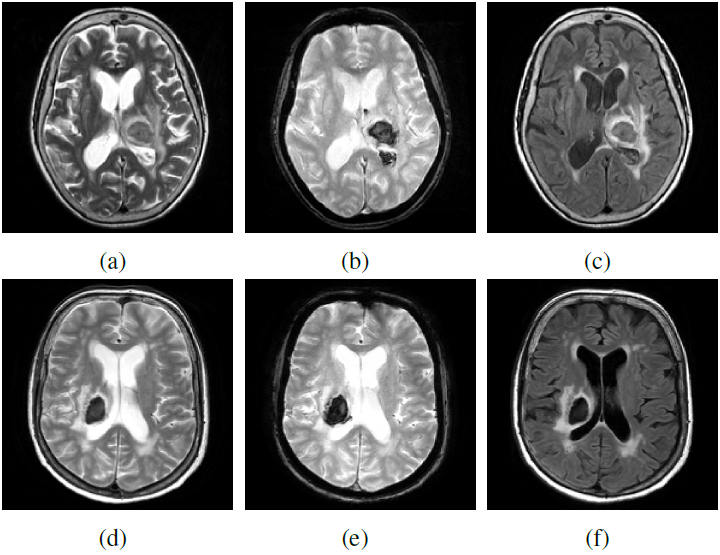
For haematoma segmentation, we observe that these regions appear hypo-intense in T2*-GRE, and hypo- or iso-intense in T2 and FLAIR (see Figure 1). Hence, we propose to classify the intensities in the T2*-GRE image and combined T2-FLAIR sequences into clusters. We extract patches of 3x3x3 voxels and 3x3x3x2 voxels around each of the T2* GRE and T2-FLAIR voxels within the WM-GM mask, respectively. We then apply a deterministic k-means algorithm6-8 independently to both patch datasets. Here, we have a number of T2*-GRE clusters $$$C^{T2^*}_{i}$$$ and a number of T2-FLAIR clusters $$$C^{T2-FLAIR}_{j}$$$. Each cluster has connected components $$$C^{T2^*}_{i,p}$$$ and $$$C^{T2-FLAIR}_{j,q}$$$, respectively. We seek the two overlapping connected components (one from each set of clusters) that best represent haematoma in terms of size and shape. Therefore, we take the T2* GRE intensity cluster with the lowest mean $$$C^{T2^*}_{min}$$$ and select from its connected components the one that satisfies:
$$C^{T2^*}_{best}=\underset{i}{\arg\max}\;\mathbf{S}(C^{T2^*}_{min,i}),\qquad i=1...P$$
$$\mathbf{S}(x)=|x|\cdot\left(\frac{|x|}{|\mathbf{B}(x)|}\right)^{2}=\frac{|x|^{3}}{|\mathbf{B}(x)|^{2}}$$
where $$$P$$$ is the number of connected components of $$$C^{T2^*}_{min}$$$, $$$\mathbf{B}(x)$$$ is the minimal bounding-box containing $$$x$$$, and $$$|x|$$$ corresponds to the volume of $$$x$$$. Once $$$C^{T2^*}_{best}$$$ is computed, we select from the T2-FLAIR cluster connected components $$$C^{T2-FLAIR}_{j,q}$$$ the one that corresponds to:
$$C^{T2-FLAIR}_{best}=\underset{j,q}{\arg\max}\;\mathbf{S}(C^{T2^*}_{best}\bigcap C^{T2-FLAIR}_{j,q}),$$
The final haematoma segmentation is $$$C^{T2-FLAIR}_{best}$$$, followed by 3 morphological dilations, 3D hole-filling, and 3 morphological erosions.
For oedema segmentation, we determine a threshold of hyper-intensities$$$\mathit{T}=\mu_{robust}+3\sigma_{robust}$$$ in the FLAIR image, by computing the robust intensity statistics $$$\mu_{robust}$$$ and $$$\sigma_{robust}$$$ using the Minimum Covariance Determinant (MCD) estimator9. A hyper-intensity binary map is then computed.
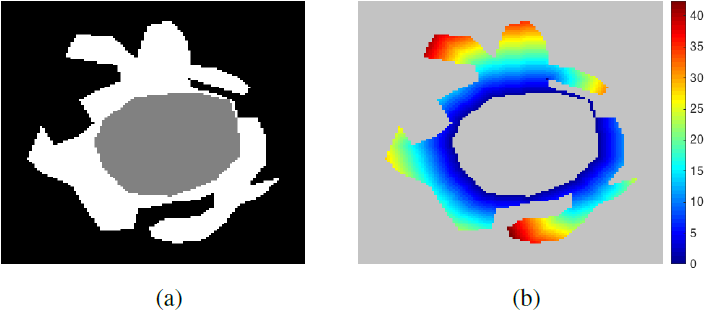
Voxels in the binary map of hyper-intensities do not only represent oedema, buy may also correspond to leukoaraiosis. To alleviate this issue, we restrict possible oedema voxels to the ones that are close to the haematoma and are located in regions of low probability of leukoaraiosis. We first compute the geodesic quasi-euclidean distance from every voxel in the hyper-intensity map to the haematoma, using the algorithm described in10 (see Figure 2). This yields a voxel-wise geodesic distance map $$$\mathcal{D}$$$. Secondly, a voxel-wise white matter lesion weight map $$$\mathcal{L}$$$ is calculated by transforming a small vessel disease (SVD) probability map11. This yields a native space SVD probability map $$$\mathcal{S}$$$. We then set $$$\mathcal{L}$$$ as:
$$\mathcal{L}=\left(1+\frac{\mathcal{S}}{max(\mathcal{S})}\right)^{2}.$$
Thirdly, a voxel-wise hyper-intensity threshold map $$$\mathbf{T}$$$ that takes into account both distance to the haematoma and leukoaraiosis weight is computed as:
$$\mathbf{T}=\mathit{T}\cdot\frac{(\mathcal{D}\cdot\mathcal{L})+\lambda}{2\lambda},$$
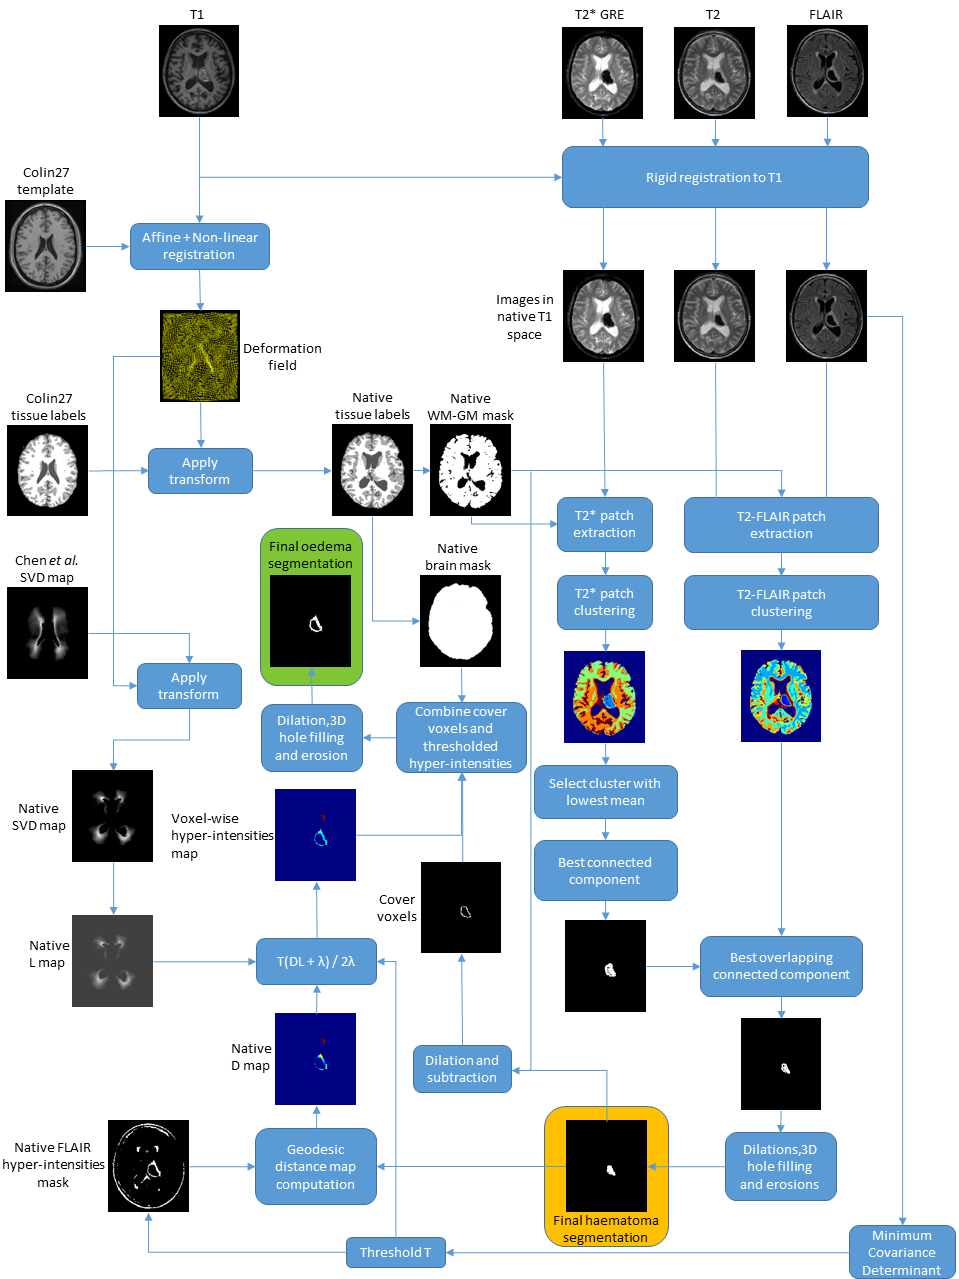
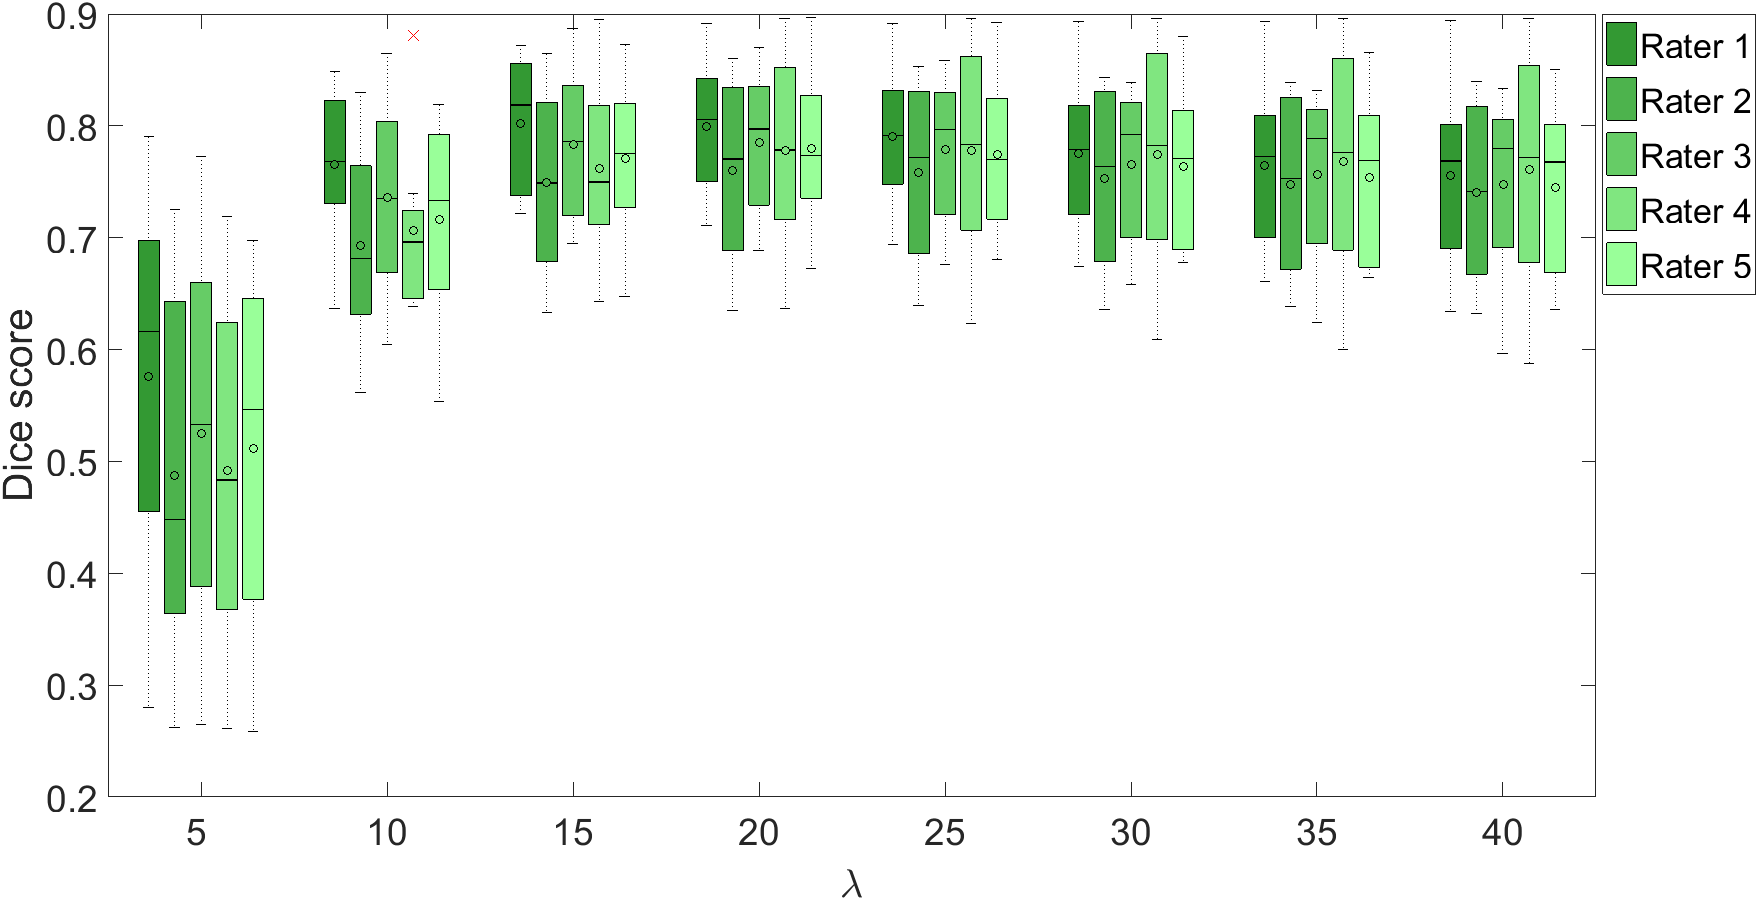
where $$$\lambda>0$$$ is a scalar parameter that controls the steepness of $$$\mathbf{T}$$$ around the haematoma. We define an initial oedema segmentation as all voxels in the whole-brain mask which have a FLAIR intensity greater than $$$\mathbf{T}$$$ at the corresponding location. We also incorporate the cover voxels in the segmentation, i.e., voxels which belong to the morphological dilation of the haematoma segmentation, but not to the haematoma itself. Finally, a morphological dilation, 3D hole-filling, and morphological erosion are performed to obtain the final result. The full workflow of the proposed method is depicted in Figure 3.
Results
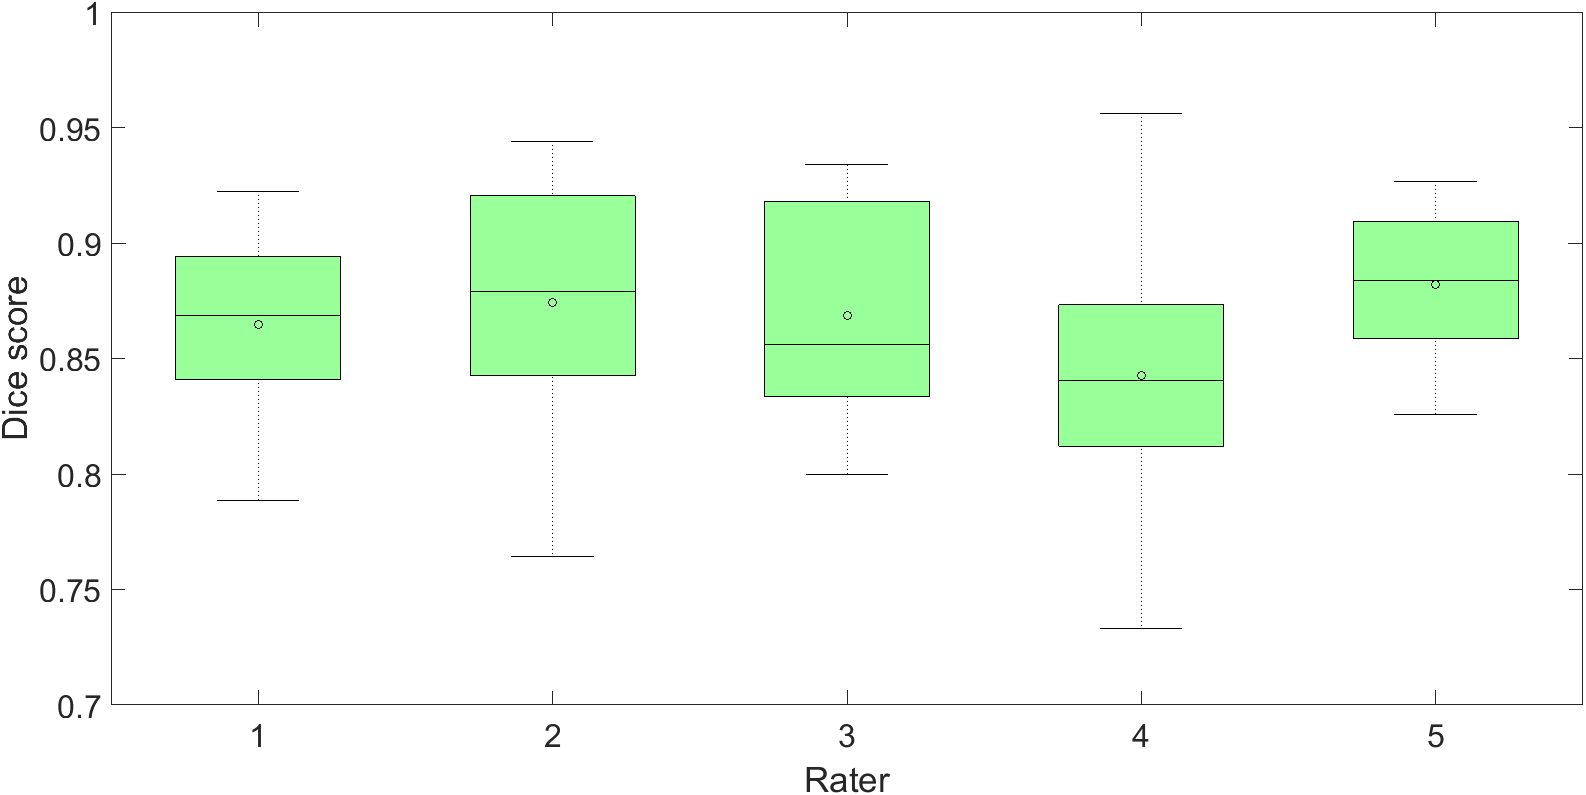
We compare our method to manual delineations performed by 5 expert raters on 8 patients. Figures 4 and 5 show the results for haematoma and oedema segmentation (for different $$$\lambda$$$) in terms of Dice12 overlaps, respectively. The lowest median Dice scores for haematoma and oedema ($$$\lambda=20$$$) are 0.84 and 0.77, respectively.Conclusion
We propose a fully automated algorithm for segmentation of haematoma and oedema from MRI of patients with SICH. We have performed a thorough evaluation of the proposed method. Promising results when comparing to 5 different expert manual delineations on 8 patients demonstrate that our algorithm has the potential to be a useful preprocessing tool for subsequent volumetric assessment of SICH in the context of multi-centre clinical trials using MRI data.Acknowledgements
The TICH-2 MRI sub-study is funded by the British Heart Foundation under grant number PG/14/96/31262.
The TICH-2 main study is funded by the National Institute of Health Research Health Technology Assessment (NIHR HTA) UK under project code 11_129_109.
The authors would like to thank Liang Cheng of Imperial College London, who kindly provided the small vessel disease probability map used in this work.
References
1. Y. Fu, J. Hao, N. Zhang, L. Ren, N. Sun, Y.-J. Li, Y. Yan, D. Huang, C. Yu, and F.-D. Shi, “Fingolimod for the treatment of intracerebral hemorrhage: A 2-arm proof-of-concept study,” JAMA neurology, vol. 71, no. 9, pp. 1–10, 2014.
2. K. Krishnan, S. Mukhtar, J. Lingard, A. Houlton, E. Walker, T. Jones,N. Sprigg, R. Dineen, P. Koumellis, A. Adami, A. Casado, P. Bath, and J. Wardlaw, “Performance characteristics of methods for quantifying spontaneous intracerebral haemorrhage: data from the Efficacy of Nitric Oxide in Stroke (ENOS) trial,” Journal of neurology, neurosurgery, and psychiatry, vol. 86, no. 11, pp. 1258–66, 2015.
3. K. Krishnan, P. Scutt, L. Woodhouse, A. Adami, J. Becker, E. Berge, L. Cala, A. Casado, V. Caso, C. Chen, H. Christensen, R. Collins, A. Czlonkowska, R. Dineen, J. Gommans, P. Koumellis, K. Lees, G. Ntaios, S. Ozturk, S. Phillips, S. Pocock, A. De Silva, N. Sprigg, S. Szatmari, J. Wardlaw, and P. Bath, “Glyceryl trinitrate for acute intracerebral hemorrhage: Results from the Efficacy of Nitric Oxide in Stroke (ENOS) trial, a subgroup analysis,” Stroke, vol. 47, no. 1, pp. 44–52, 2016
4. N. Sprigg, K. Robson, P. Bath, R. Dineen, I. Roberts, T. Robinson, C. Roffe, D. Werring, R. Al-Shahi Salman, S. Pocock, L. Duley, T. England, D. Whynes, A. Ciccone, A. Laska, H. Christensen, S. Ozturk, R. Collins, D. Bereczki, J. Egea-Guerrero, Z. Law, A. Czlonkowska, D. Seiffge, and M. Beredzie, “Intravenous tranexamic acid for hyperacute primary intracerebral hemorrhage: Protocol for a randomized, placebo-controlled trial,” International journal of stroke, vol. 11, no. 6,pp. 717–723, 2016.
5. C. Holmes, R. Hoge, L. Collins, R. Woods, A. Toga, and A. Evans, “Enhancement of MR images using registration for signal averaging,” Journal of computer assisted tomography, vol. 22, no. 2, pp. 324–333,1998.
6. J. MacQueen, “Some methods for classification and analysis of multivariate observations,” in 5th Berkeley Symposium on Mathematical Statistics and Probability, vol. 1, pp. 281–297, 1967.
7. J. Hartigan and M. Wong, “Algorithm AS 136: A k-means clustering algorithm,” Applied statistics, vol. 28, no. 1, pp. 100–108, 1979.
8. T. Su and J. Dy, “In search of deterministic methods for initializing K-means and Gaussian mixture clustering,” Intelligent Data Analysis,pp. 1–42, 2007.
9. P. J. Rousseeuw, “Least median of squares regression,” Journal of the American Statistical Association, vol. 79, no. 388, pp. 871–880, 1984.
10. P. Soille, Morphological image analysis: Principles and applications. Springer Science & Business Media, 2 ed., 2013.
11. L. Chen, T. Tong, C. Ho, R. Patel, D. Cohen, A. Dawson, O. Halse, O. Geraghty, P. Rinne, C. White, T. Nakornchai, P. Bentley, and D. Rueckert, “Identification of Cerebral Small Vessel Disease Using Multiple Instance Learning,” in Medical image computing and computer assisted intervention (MICCAI), 2015.
12. L. Dice, “Measures of the amount of ecologic association between species,” Ecology, vol. 26, pp. 297–302, 1945.
Figures