4724
Semi-automatic Analysis of Carotid Plaque Composition from Multicontrast Magnetic Resonance ImagingChien-Yuan Eddy Lin1,2, Ai-Chi Chen1, Liang-Yu Shyu3, Yen-Chien Wu4, David Yen-Ting Chen4, Ying-Chi Tseng4, and Chi-Jen Chen4
1GE Healthcare, Taipei, Taiwan, 2GE Healthcare MR Research China, Beijing, People's Republic of China, 3Biomedical Engineering Department, Chung Yuan Christian University, Chungli, Taiwan, 4Department of Radiology, Taipei Medical University - Shuang Ho Hospital, New Taipei City, Taiwan
Synopsis
Accurate tracking of plaque composition would be very useful clinically to determine the status of atherosclerosis and to understand the potential risk under myocardial infraction, stroke, and peripheral vascular disease. We developed a semi-automatic software to evaluate the carotid plaque types using four contrast-weighted MRI (pre- and post-contrast T1-weighted, time-of-flight, T2-weighted). Working with the proposed software with the minimal operator input reduces the process time of plaque component identification and minimizes the possibility of random and systematic errors. As a result, proposed software is capable of assisting the radiologist/clinician in imaging interpretation and decision-making in managing carotid artery atherosclerosis.
Purpose
Atherosclerosis and its thrombotic complications are the leading cause of death and disability in developed countries1. The resultant plaque may grow to obstruct the lumen or to disseminate material into the blood stream and may cause myocardial infarction, stroke, and peripheral vascular disease2. Accurate tracking of plaque composition in vivo would be very useful clinically to determine the status of atherosclerosis. Multicontrast MRI has been proven to be capable of detecting plaque morphology such as plaque size/thickness and plaque tissue composition (lipid/necrotic cores, dense and loose fibrous matrix, hemorrhage and calcifications)3. However, the lack of a harmonized processing pipeline contributing to the quantitative analysis of plaque components with the less inter-operator bias to minimize the possibility of random and systematic errors. In this work, we described a semi-automatic software for analyzing the plaque morphology that can automatically classify different carotid atherosclerotic lesion types once operator determined the location of vessel walls from multicontrast MRI.Methods
Sixteen atherosclerosis patients were imaged in a 3T clinical scanner (Discovery MR750, GE Healthcare, Milwaukee, USA) using an 8-channel brain coil as the signal detection and whole body coil for RF transmission. A multicontrast protocol was applied for visualizing carotid arteries at matched slice coverage and resolution (FOV=16 cm, thickness=3 mm, 256x256 matrix): time of flight (TOF), Pre-and post-contrast T1-weighted (T1W and T1W+C, respectively) imaging, T2-weighted (T2W) imaging. Fat suppression function was enabled at T1W and T2W images for reducing signal from subcutaneous fatty tissues. Other parameters for the imaging sequences were as follows: (1) 2D fast spin-echo sequence with the preparation of double-inversion recovery for T1W and T1W+C (TR/TE=1 R-R/6 ms), for (2) T2W (TR/TE=2 R-R/48 ms); (3) 3D TOF SPGR sequence was used for detecting flow-related enhancement (TR/TE=21/2.2ms, FA=20). Proposed analysis software was developed in C++ environment. Plaque composition can be automatically classified to four categories (lipid, calcification, fibrosis, and hemorrhage) in accordance with the multiple image contrast and the change of signal intensity as table 1 shown3, once the operator contours the vessel lumen and outer wall boundaries. Fibrous tissue can be distinguished from other three components according to the enhanced ratio of T1W+C, while calcification tissue was isolated due to its low signal at all MR imaging. Hemorrhage and lipid tissue can be identified from each other according to their different TOF signal level (hyperintense and isointense, respectively). The accuracy in the classification of plaque type by developed program showed an excellent agreement with a experienced radiologist. As our testing, using developed program for analyzing the plaque morphology with minimal operator input, more than 34% process time was saved.Results and Discussions
Three of 16 cases were recruited for demonstrating the identifications of plaque components using proposed process software (Figure 1). Vessel wall and lumen were contoured by operator according to multicontrast MRI and labeled as blue and red color, respectively. Several information was displayed at resultant page (Figure 1b) once executing the process. Firstly, the histogram analysis of the vessel wall thickness in the 16 radial directions was plotted. Secondly, the area of vessel wall and lumen as well as four plaque components were exhibited. Lipid was identified as main component and labeled as yellow color in Case A with the area of 34.77 mm2 (blue, green, and pink color for calcification, fibrosis, and hemorrhage, respectively), because the ratio of T1W+C SSR (1.2) and T1W SSR (1.8) is smaller than 1 (denote as “-“ at T1W+C) and TOF signal found to be isointense (Figure 1a top-row and 1b). In addition, the area of vessel lumen (9.08 mm2) and wall (41.31 mm2) are also provided from proposed program (Figure 1b). In Case B, decrease or no signal change of TOF and T1W was found, while enhanced signal of T2W and the ratio of T1W+C and T1W were observed. Fibrous tissue labeled as green color (area=21.3 mm2) was main component of Case B. Inhomogeneous MRI signal was observed at thickened vessel wall in Case C. Calcification (blue) and hemorrhage (pink) tissues were identified at Case C with the areas of 8.11 mm2 and 21.09 mm2, respectively.Conclusion
Our developed process program has been proven to be capable of semi-automatically classifying the plaque components and measuring the size of vessel wall and lumen from multicontrast MRI. This program working with reduced operator input minimizes the possibility of random and systematic errors and reduces the process time in clinical diagnosis. Furthermore, it can be used as a training tool or standard for new entrant diagnosis practice.Acknowledgements
No acknowledgement found.References
1. M. Naghavi, et al., "From vulnerable plaque to vulnerable patient: a call for new definitions and risk assessment strategies: Part I," Circulation, vol. 108, pp. 1664-72, Oct 7 2003.
2. J. M. Cai, et al., "Classification of Human Carotid Atherosclerotic Lesions With In Vivo Multicontrast Magnetic Resonance Imaging," Circulation, vol. 106, pp. 1368-1373, 2002.
3. C. Yuan, et al., "MRI of atherosclerosis in clinical trials," NMR Biomed, vol. 19, pp. 636-54, Oct 2006.
Figures
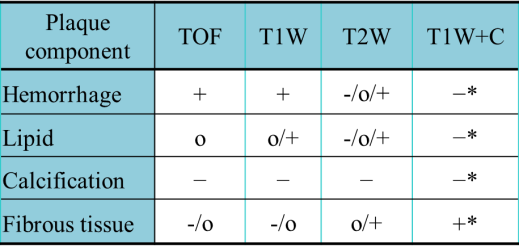
Table1. Plaque
characterization with multiple contrasts MRI. Relative MR signal intensity (SI)
to that of the sternocleidomastoid muscle (SM).
(+): hyper-intense; (O): iso-intense; (−): hypo-intense;
(*): The ratio of T1W+C SSR (SI-to-SM ratio) and T1W
SSR (>1 denote +).
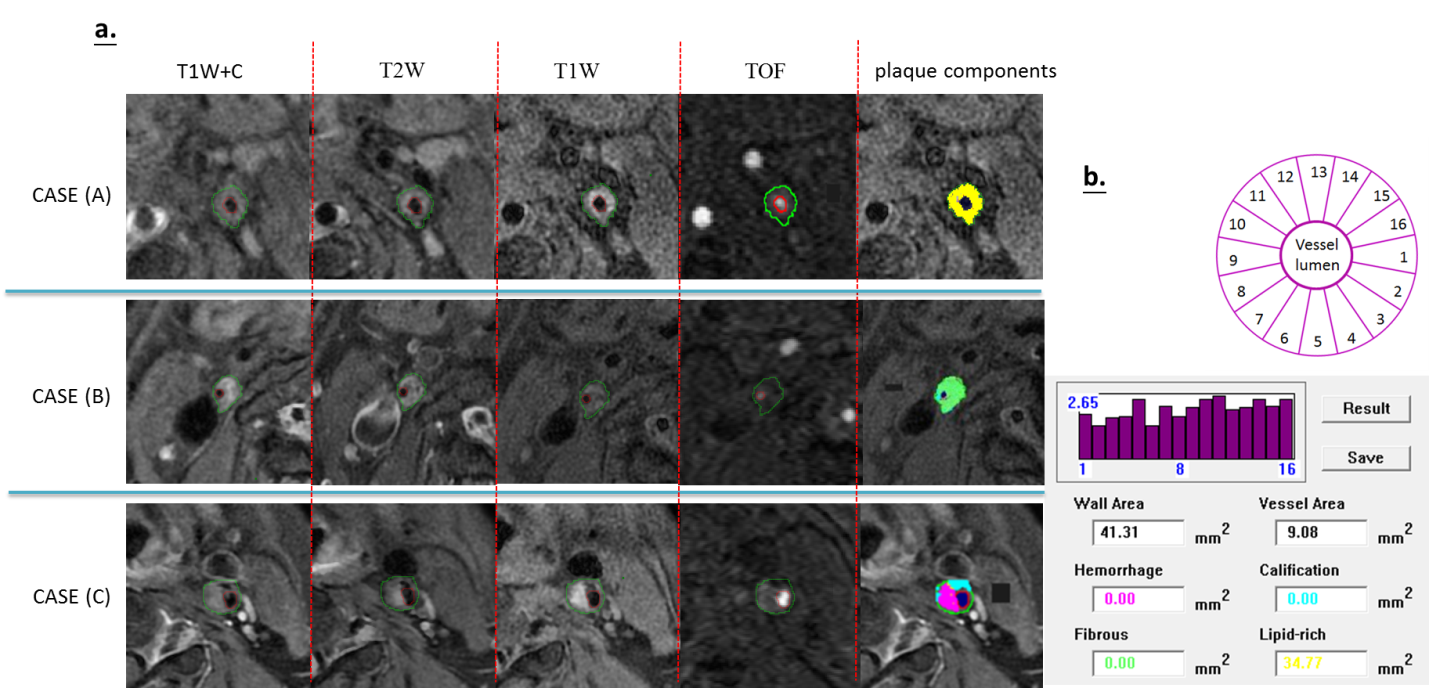
Figure 1. Three cases of plaque component identification using developed
program. a. Multicontrast MRI (TIW+C、T2W、T1W and TOF) of carotid atherosclerotic lesions. b. Graphic
user interface and resultant page of developed program.