4723
Susceptibility based characterization of brain arteriovenous malformations1Department of Neuroradiology, Universityhospital Heidelberg, Heidelberg, Germany, 2Department of Radiology, German Cancer Research Center (DKFZ), Heidelberg, Germany, 3Department of Medical Physics in Radiology, German Cancer Research Center (DKFZ), Heidelberg, Germany, 4Physikalisch-Technische Bundesanstalt (PTB), Braunschweig und Berlin, Germany
Synopsis
Brain arteriovenous malformations (bAVM) are congenital lesions detected incidentally or following symptomatic events like hemorrhage, seizure or headache. In bAVM patients, the most feared complication is intracranial hemorrhage with a general risk ranging between 2-4%1 and further functional and hemodynamic characterization of bAVMs may improve risk assessment and ultimately aid in patient management2, 3. In this study, bAVMs have been investigated using quantitative susceptibility mapping and phase contrast based flow measurements. Susceptibility across the bAVM nidus is studied in relation to flow characteristics.
PURPOSE
To characterize bAVMs based on intrinsic susceptibility and flow velocity.METHODS
The study was conducted in accordance with the Declaration of Helsinki. Institutional review board approval was obtained and all subjects provided written informed consent.
Five untreated patients with bAVM (16-54 years; mean age 33.2±14.4 years) were scanned on a 3 T whole-body MR system (Magnetom Skyra, Siemens Healthcare, Erlangen, Germany) with a 32-channel head-matrix coil. Among other sequences a 3D phase-contrast gradient echo (3D-PC-GRE) sequence with velocity encoding and a fully flow-compensated 3D GRE were acquired. Sequence parameters are shown in Table1.
To generate quantitative susceptibility maps (QSM), phase images from different coils were combined using the vendor-provided adaptive combine method4. Brain masks were generated from the magnitude images using FSL-BET (Brain Extraction Tool)5. Phase images were unwrapped using a Laplacian-based phase unwrapping6 and the background field was removed with V-SHARP7 (with kernel size up to 25 mm). Susceptibility maps were calculated in Matlab (The MathWorks, Inc., Natick, MA, USA) using the iLSQR method6, 8. Susceptibility maps were referenced with cerebrospinal fluid from the atrium of the lateral ventricles.
3D-PC-GRE images were co-registered to flow-compensated GRE magnitude images using affine registration in FSL-FLIRT.9 Each bAVM nidus was segmented on 3D-PC-GRE datasets (Fig.1) using the Medical Imaging Interaction Toolkit.10, 11 Susceptibility and flow velocity values were calculated with FSL as mean values over each mask. Mean nidal flow velocity was calculated with a lower threshold at 10 cm/s for noise reduction. Arterial bAVM feeders were assessed on digital subtraction angiography (DSA) and identified on 3D-PC-GRE datasets. To determine the maximal inflow velocity ROIs were drawn over each feeding vessel and the mean of measured maxima was calculated. The QSM dataset of each nidal volume was segmented into 5 bins covering the whole susceptibility range from lowest to highest susceptibilities in equal steps. Susceptibility based histograms were generated for each patient using Matlab and mean flow velocity was calculated for each bin on 3D-PC-GRE (Fig.1).
RESULTS
The results shown are preliminary results of an ongoing study. The mean nidal volume of the bAVMs included was 5.5±4.9 cm³ (range:0.4cm3-11.6 cm³) with Spetzler-Martin grading scores between 1 and 3. Based on DSA examination, included bAVMs displayed superficial venous drainage only.
Susceptibility histograms show the distribution of susceptibility within the nidal volume. In 3 patients the highest volume is centered around the arithmetic mean susceptibility. In patients 2 and 3 the main fraction of susceptibility respectively lies in the higher and lower histogram range (Fig.1).
Fig.2 visualizes the nidal susceptibility gradient between arterial inflow and venous outflow (a) and the distribution of intranidal flow (b) in 3D a visualization.
Fig.3(a) shows mean nidal susceptibility in relation to mean nidal flow velocity. Mean nidal susceptibility was ‑20.0± 2.3 ppb (range: -2.5 to -39.3 ppb). Mean nidal flow velocity across all bAVMs was 17.0± 3.0 cm/s (range:11.6-20.5 cm/s). Mean maximal inflow velocity of feeder vessels was 60.4±17.3 cm/s (range:31.0-93.9 cm/s). Fig.3 (b) relates mean nidal flow velocity to maximal inflow velocity and shows that nidal mean velocities are below maximal inflow velocity in each patient. Fig.3 (c) compares the difference between mean nidal flow velocity and maximal inflow velocity (∆ velocity) to nidal volume.
DISCUSSION
QSM allows the determination of bAVM susceptibility and can be used to determine intravascular blood oxygenation levels.12-14 Although bAVMs are defined by an absent capillary bed, a gradient of diminishing blood oxygenation between arterial nidal inflow and venous nidal outflow can be postulated.15 This gradient is visualized using QSM in Fig.2(a). Possibly due to varying vessel diameters flow velocity visualization in Fig.(2b) does not depict a similar gradient.
The individual susceptibility gradient histograms across each nidal volume depict whether a bAVM is mainly occupied by relatively arterial or venous blood and may be an indicator of an asymmetric, proximal or distal nidal location of main deoxygenation. General nidal resistance to flow in bAVMs has been shown to depend on the cross-sectional area of nidal vessels and total nidal volume.16 Results of this study indicate a similar link between nidal volumes and ∆ velocity (Fig.3(c)) and increase plausibility of flow measurements.
Relatively high flow velocities (Fig.1) and thus a relatively small cross-sectional area of nidal vessels in a location of main deoxygenation may raise confidence in localizing a focally high resistance to flow within the nidal volume.15, 17
CONCLUSION
Results of this study indicate that the combination of QSM and MRI flow measurements may aid to improve assessment of bAVM characteristics.Acknowledgements
References
1. Stapf C, Mast H, Sciacca RR, et al. Predictors of hemorrhage in patients with untreated brain arteriovenous malformation. Neurology 2006;66:1350-1355.
2. Hademenos GJ, Massoud TF. Risk of intracranial arteriovenous malformation rupture due to venous drainage impairment. A theoretical analysis. Stroke 1996;27:1072-1083.
3. da Costa L, Wallace MC, Ter Brugge KG, O'Kelly C, Willinsky RA, Tymianski M. The natural history and predictive features of hemorrhage from brain arteriovenous malformations. Stroke 2009;40:100-105.
4. Prock T, Collins DJ, Dzik-Jurasz AS, Leach MO. An algorithm for the optimum combination of data from arbitrary magnetic resonance phased array probes. Phys Med Biol 2002;47:N39-46.
5. Smith SM. Fast robust automated brain extraction. Hum Brain Mapp 2002;17:143-155. 6. Li W, Wu B, Liu C. Quantitative susceptibility mapping of human brain reflects spatial variation in tissue composition. Neuroimage 2011;55:1645-1656.
7. Li W, Avram AV, Wu B, Xiao X, Liu C. Integrated Laplacian-based phase unwrapping and background phase removal for quantitative susceptibility mapping. NMR Biomed 2014;27:219-227. 8. Li W, Wang N, Yu F, et al. A method for estimating and removing streaking artifacts in quantitative susceptibility mapping. Neuroimage 2015;108:111-122.
9. Patenaude B, Smith SM, Kennedy DN, Jenkinson M. A Bayesian model of shape and appearance for subcortical brain segmentation. Neuroimage 2011;56:907-922.
10. Maleike D, Nolden M, Meinzer HP, Wolf I. Interactive segmentation framework of the Medical Imaging Interaction Toolkit. Comput Methods Programs Biomed 2009;96:72-83.
11. Nolden M, Zelzer S, Seitel A, et al. The Medical Imaging Interaction Toolkit: challenges and advances : 10 years of open-source development. Int J Comput Assist Radiol Surg 2013;8:607-620. 12. Jain V, Abdulmalik O, Propert KJ, Wehrli FW. Investigating the magnetic susceptibility properties of fresh human blood for noninvasive oxygen saturation quantification. Magnetic Resonance in Medicine 2012;68:863-867.
13. Haacke EM, Tang J, Neelavalli J, Cheng YCN. Susceptibility mapping as a means to visualize veins and quantify oxygen saturation (vol 32, pg 663, 2010). Journal of Magnetic Resonance Imaging 2011;33:1527-1529.
14. Fan AP, Evans KC, Stout JN, Rosen BR, Adalsteinsson E. Regional quantification of cerebral venous oxygenation from MRI susceptibility during hypercapnia. Neuroimage 2015;104:146-155. 15. Sakadzic S, Mandeville ET, Gagnon L, et al. Large arteriolar component of oxygen delivery implies a safe margin of oxygen supply to cerebral tissue. Nat Commun 2014;5:5734.
16. Shakur SF, Valyi-Nagy T, Amin-Hanjani S, et al. Effects of nidus microarchitecture on cerebral arteriovenous malformation hemodynamics. J Clin Neurosci 2016;26:70-74.
17. Federspiel WJ, Popel AS. A theoretical analysis of the effect of the particulate nature of blood on oxygen release in capillaries. Microvasc Res 1986;32:164-189.
Figures
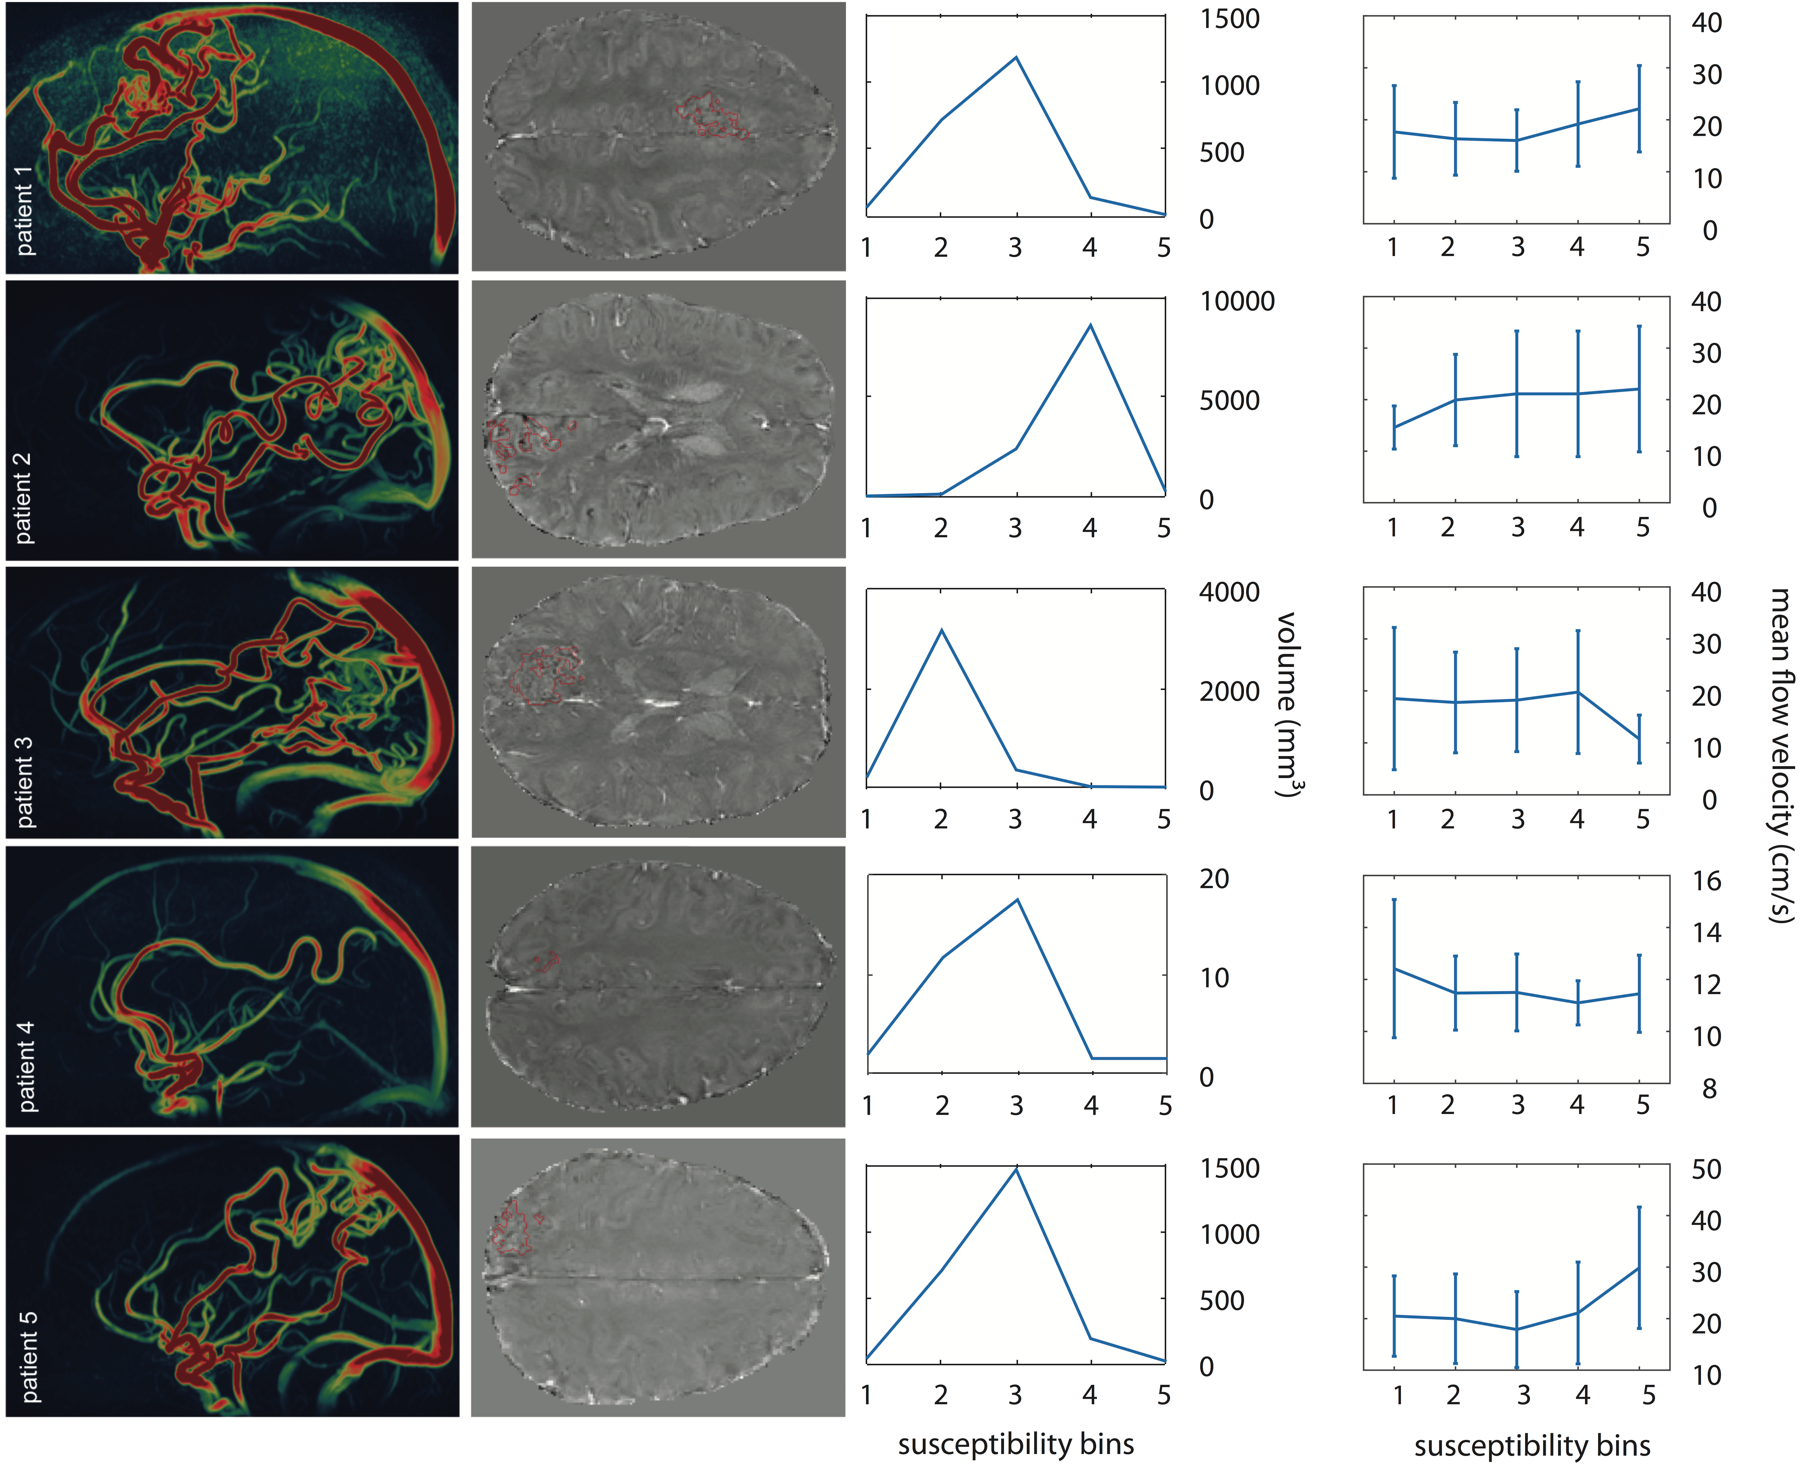
Figure 1
3D-PC-GRE based sagittal maximum intensity projections of patient 1 to 5 in the left column. Axial susceptibility maps of the cerebrum with red masks demarcating each bAVM nidus in the middle left column. Susceptibility based histograms for each nidus are shown in the middle right column and mean flow velocity for each bin is depicted in the right column.
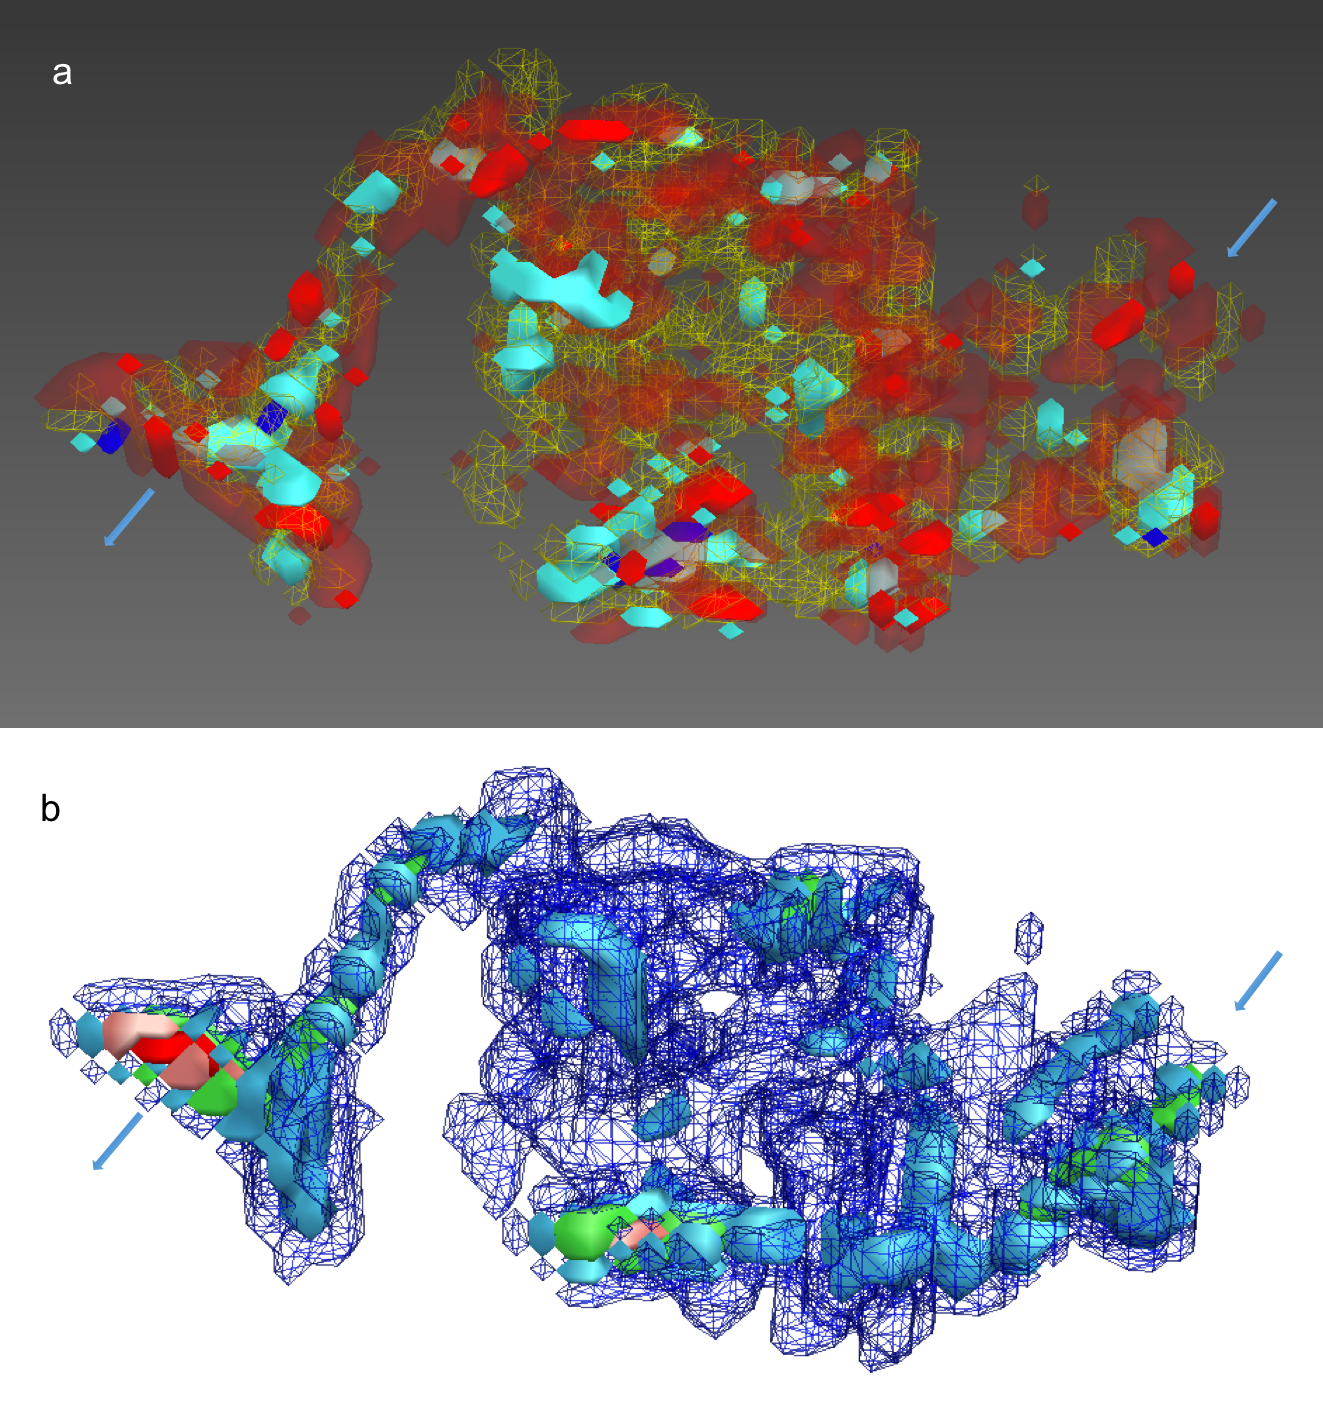
Figure 2:
Nidal 3D visualization based on (a) susceptibility and (b) flow-velocity. Red to blue color encoding is used for lower to higher susceptibilities respectively (a) and blue to green and red for rising flow-velocity (b).
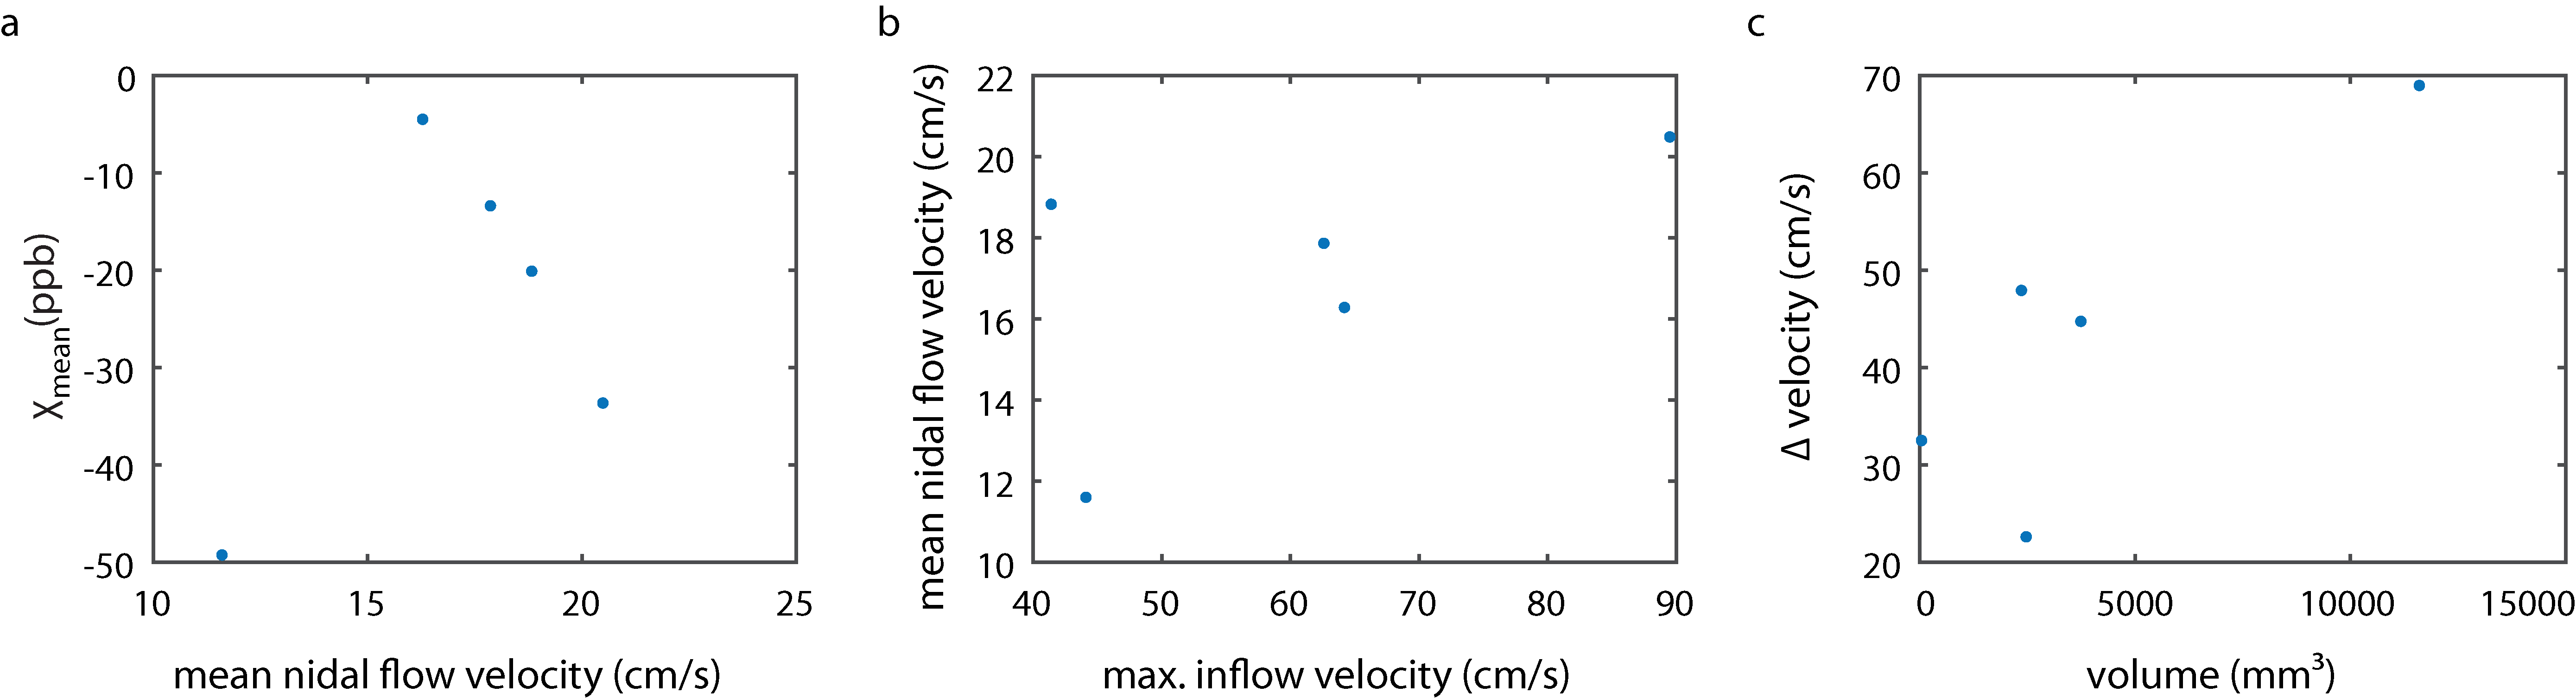
Figure 3:
Scatterplots depicting mean nidal susceptibility in relation to mean nidal flow velocity of each patient (a), the mean nidal flow velocity in relation to maximal inflow velocity (b) and the difference between mean nidal flow velocity and maximal inflow velocity (∆ velocity) compared to total nidal volume (c).
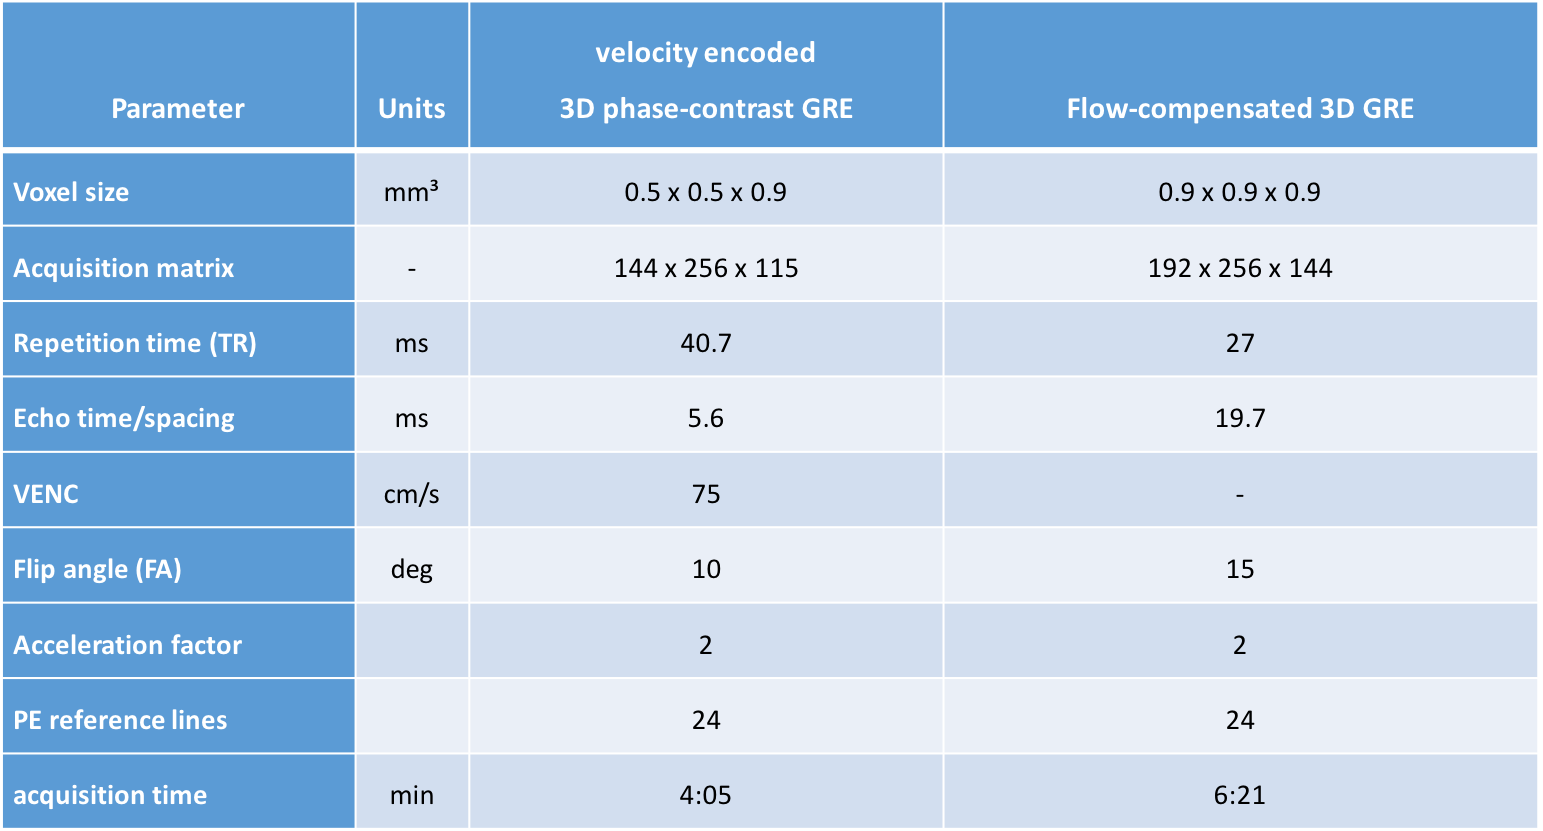
Table 1:
Sequence parameters