4715
Development of a clinically useful cerebrovascular stress test using CO2 and BOLD-MRI1Institute of Medical Sciences, University of Toronto, Toronto, ON, Canada, 2Department of Physiology, University of Toronto, Toronto, ON, Canada, 3Department of Anaesthesia and Pain Management, University Health Network, Toronto, ON, Canada, 4Joint Department of Medical Imaging and the Functional Neuroimaging Laboratory, University Health Network, Toronto, ON, Canada
Synopsis
Current methods of measuring cerebrovascular reactivity (CVR) have shown promise for aiding in clinical diagnosis and management of patients with various neurovascular diseases. However, CVR measurement is currently limited to a research setting and transition to clinical utility requires a universal standardized measurement method. Using BOLD-MRI CO2 measured CVR, we present experimentally developed concepts for standardization and post processing, which have the potential to provide a clinically useful brain stress test.
Purpose
To identify the optimal parameters for a clinically useful stress test to assess cerebrovascular physiology and pathophysiology by administering CO2 and monitoring BOLD-MRI.
Introduction
CVR is the cerebral blood flow (CBF) response to a vasoactive stimulus. CVR can be measured using CO2 as a vasoactive stimulus and the BOLD signal, as a surrogate for the CBF response. This functional test identifies the hemodynamic significance of an observed vascular stenosis, an indication of an enhanced risk of stroke and dementia1,2. However the literature is replete with a wide array of CO2 and other stress tests, making it impossible to universally define detection thresholds for abnormal CVR3, or even interpret gross abnormal findings in a single patient. Consequently, the main objective of this work was to apply basic physiologic principles to systematically optimize the stressor, set down suggested standardized measurement parameters for CVR testing, and, most importantly, normalize the test data from an individual subject by comparison to that of a healthy cohort.Methods and Results
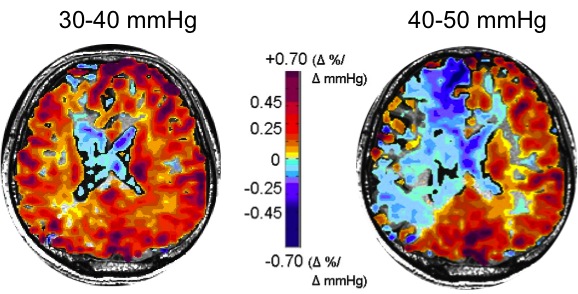
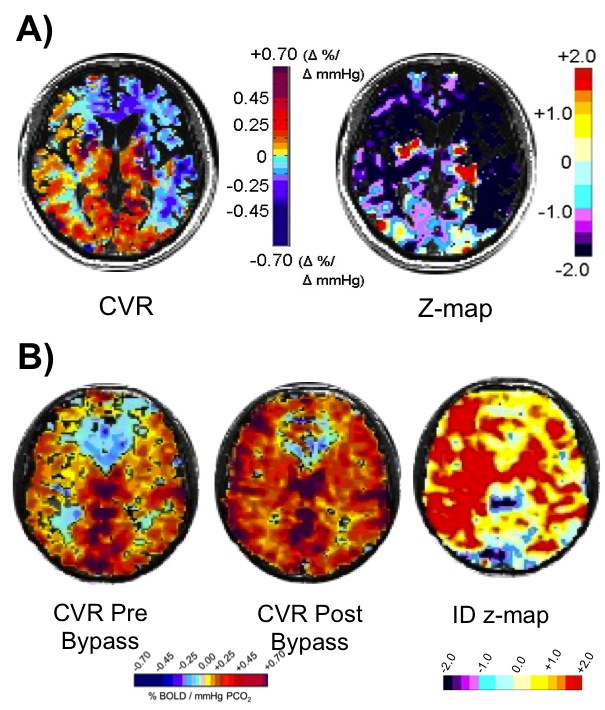
CVR tests were performed over several studies in 150 healthy individuals and 250 patients with steno-occlusive disease. The initial experiments explored the physiology and pathophysiology of CBF responses to CO2 challenges, and identified the optimal amplitude and pattern of CO2 administration to detect redistributions of blood flow in the presence of cerebrovascular lesions. We found the optimal amplitude of CO2 change to be 10-15 mmHg above resting (Figure 1)4. By assembling standardized CVR tests from normal subjects into an atlas, we were able to score an individual subject’s CVR data, voxel-by-voxel, relative to the normal range, to create CVR z-maps (Figure 2A)5. Similarly, generating an atlas containing the normal test-retest CVR range to generate CVR Interval Difference z-maps (Figure 2B)6 scores the probability of a significant change in CVR over time in a patient. Finally, we show that standardized CVR tests can discriminate between lesions that are hemodynamically significant and those that are not, or that are compensated for by collateral blood flow.Discussion and Conclusions
We describe a comprehensive, standardized, vasoactive stimulus, and post-processing designed for a clinically useful CVR brain stress test. The data generated is interpretable with respect to underlying physiology and pathophysiology. This approach is designed to maximize the probability of identifying abnormality within a single patient, differences between cohorts, and significant changes in a single patient over time. In addition, normalization to a standard atlas allows comparison of data between institutions to enables multicenter trials.Acknowledgements
No acknowledgement found.References
1. Ogasawara, K., et al. (2002). Cerebrovascular reactivity to acetazolamide and outcome in patients with symptomatic internal carotid or middle cerebral artery occlusion: a xenon-133 single-photon emission computed tomography study. Stroke. 33(7):1857-1862.
2. Silvestrini, M., et al. (2011). The role of carotid atherosclerosis in Alzheimer's disease progression. J Alzheimers Dis. 25(4):719-726.
3. Blair, G. W., et al. (2016). Magnetic resonance imaging for assessment of cerebrovascular reactivity in cerebral small vessel disease. A systematic review. J Cereb Blood Flow Metab. 36(5):833-41.
4. Sobczyk, O., et al. (2014). A conceptual model for CO2-induced redistribution of cerebral blood flow with experimental confirmation using BOLD MRI. NeuroImage. 92(0):56-68.
5. Sobczyk, O., et al. (2015). Assessing cerebrovascular reactivity abnormality by comparison to a reference atlas. J Cereb Blood Flow Metab. 35(2): 213-220.
6. Sobczyk, O., et al. (2016). Identifying significant changes in cerebrovascular reactivity to carbon dioxide. AJNR Am J Neuroradiol. 37(5):818-24.
Figures