4713
Analysis of capillary permeability index and stiffness variation during Ischemic Stroke: A first step towards evaluation of compressibility and neurodegenerative changes in Brain MRE1GE Healthcare, Bangalore, India, 2GE Healthcare, India, 3GE Healthcare, Milwaukee, WI, United States
Synopsis
Evaluation of compressibility and neurodegenerative changes is critical for planning the therapy for ischemic stroke disorders. A key factor that was not analyzed till date is the capillary permeability of blood-brain-barrier (BBB) perturbations and localized mechanical degenerative changes inside the infarct region during ischemic stroke. Our results clearly indicate a decrease in stiffness of stroke-affected infarct tissue. CPI was observed to be less in the weak BBB regions.The results demonstrate through CP and stiffness maps that extent of tissue integrity that is degraded inside the infarcted region can be assessed efficiently
Introduction
Assessment of compressibility and neurodegenerative changes is critical for treatment planning during ischemic stroke disorders. Over the years, researchers have employed the techniques like perfusion and MRE for investigating the degree of tissue damage. These studies mainly rely on fractional plasma volume, forward leakage, and non-regional elasticity measures [1,2]. Though the outcome of these research works seems promising, a key factor that was not analyzed till date is the capillary permeability of blood-brain-barrier (BBB) perturbations and localized mechanical degenerative changes inside the infarct region during ischemic stroke. Additionally, very minimal information is available about the capillary permeability index (CPI) during BBB breakdown and the localized regional dependent mechano-viscoelastic variations. In this study, we have analyzed the individual contributions of CPI of BBB and mechano-viscoelastic variations of the localized infarct region.
Methods
We use a MRE and perfusion based multi voxel technique [3], by adjusting the cost function of the balanced rectangular gradients on a brain phantom. Level set segmentation approach was used to analyze the localized infarct region [4]. Mean stiffness (kPa) and CPI (%) were used as metrics for infarct and BBB respectively. The BBB was mathematically modeled. The mean stiffness (SM) of arteries in the infarct region were analyzed by equation (1). SM =2δ/2(β1γ + β2γ +γβ3 γ- 3) (1)
γ is the stiffening parameter, β is the shear ratio due to compressibility; δ shear modulus Further, the stiffness of the investigated tissue was assigned different color code by modifying the LUT based on the local frequency estimation inversion (LFE) algorithm. The basis behind using LFE algorithm was to add the local estimation minima and instantaneous values of the spatial frequency for each slice to infer estimates of local region based mechano-viscoelastic variation. This variation is captured by equation (2). Average Regional Viscoelastic Change (%) = 2δ/γ (βγ-1 - βγ/2+1) (2)
Next, the CPI was computed as a metric to assess the strength of BBB. Since the BBB breakdown is directly related to stroke, it is highly important to investigate the strength of BBB breakdown from contrast scans because we see leakage which is due to breakdown of this membrane. KTrans has been instrumental in providing volume transfer. However, KTrans is different form permeability [5]. In our study, we try to analyze the individual contributions of capillary permeability map using CPI and it is computed by equation (3).
CPI=(∮ 0rV(x,y,z(x,y).Ndx dy〗)/CBF (3)
In equation (3), the surface integral is cost function used to cover the total surface of the capillary leakage during BBB breakdown, i.e., the integral of the are under the concentration curve is a vector field in the direction of N. The capillary permeability map was computed for each time series slice and summed up vectorially to obtain the total CPI.
Results
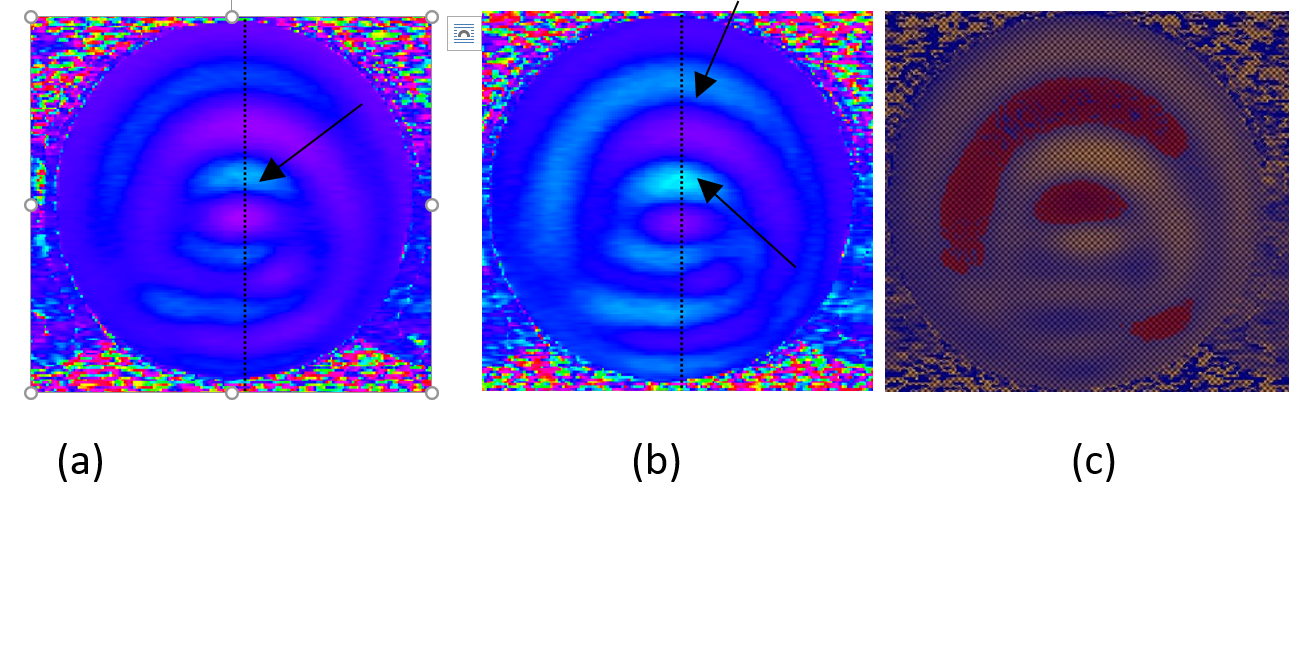
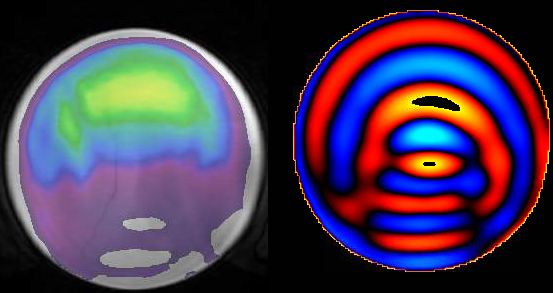
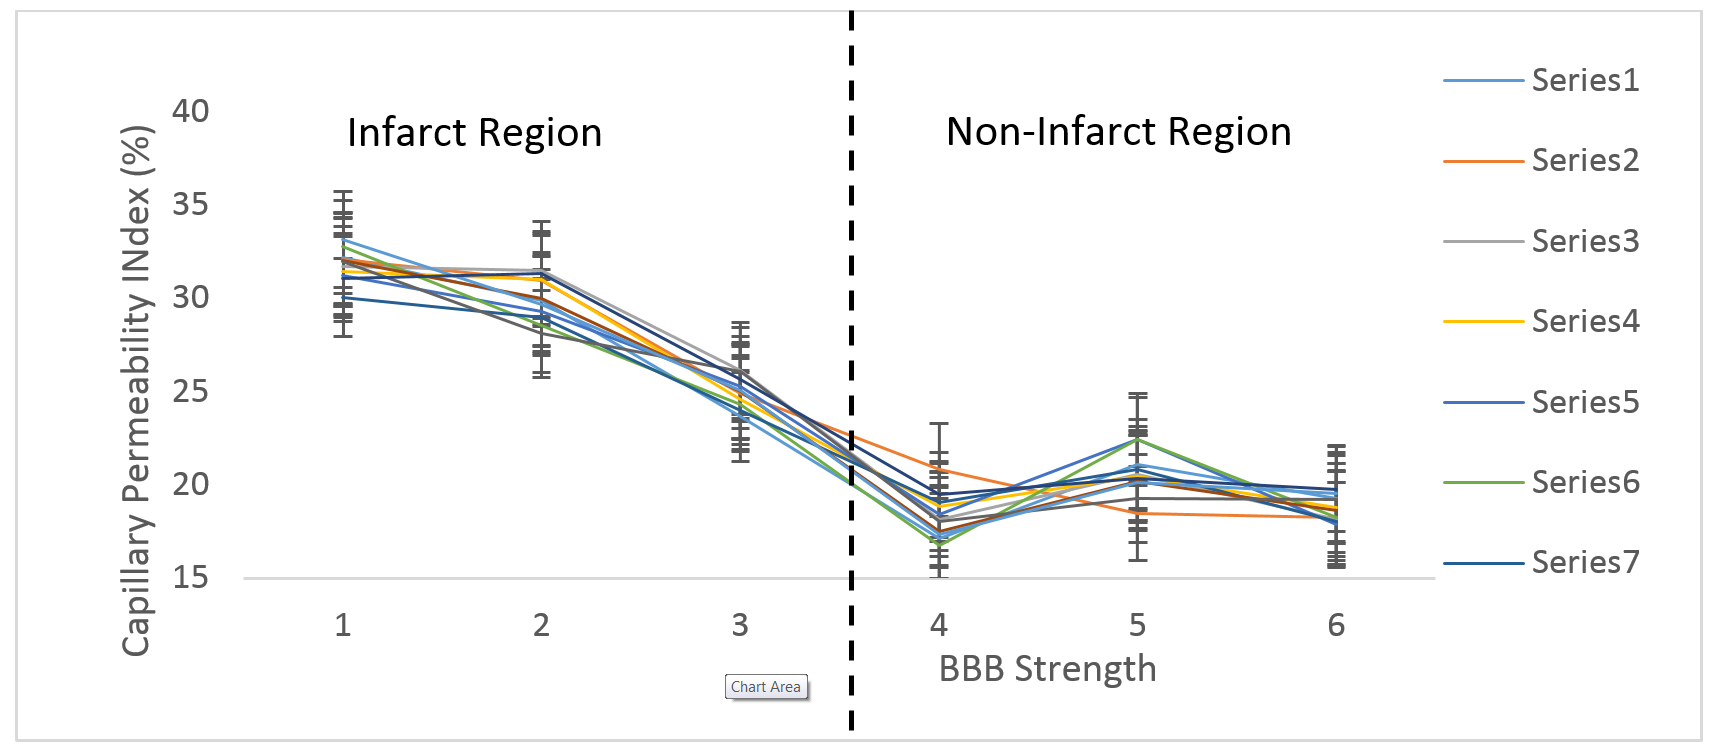
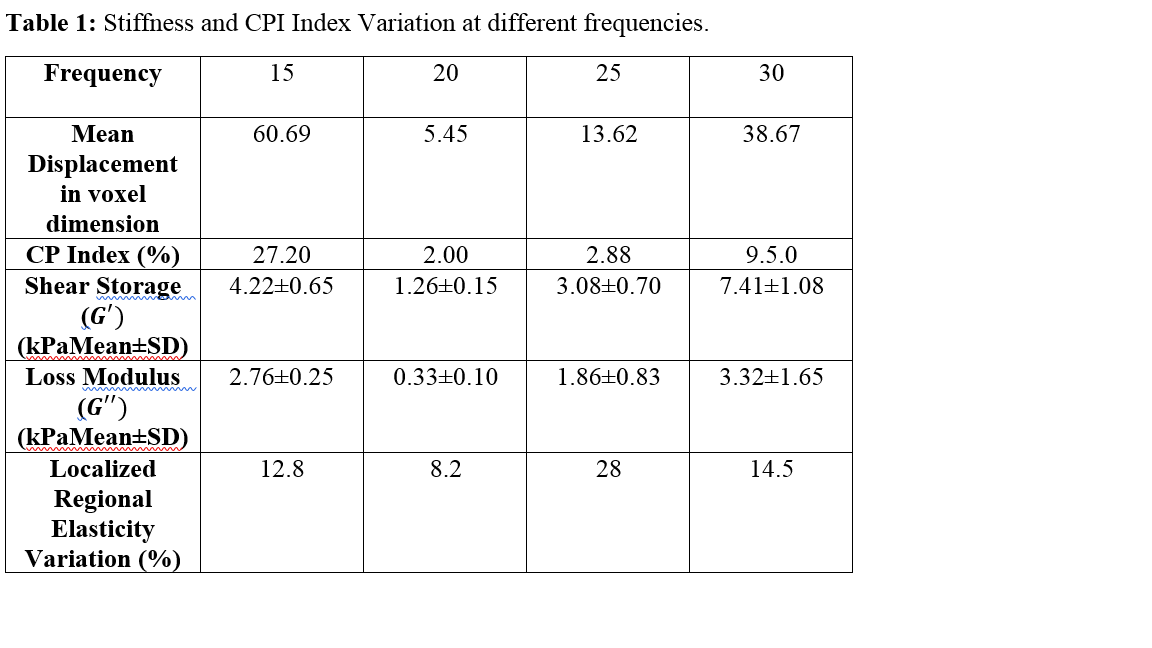
The displacement map of voxels extracted from time series image at 30 and 45 Hz show the regional dependent elasticity changes that are highlighted by arrow (Fig 1a and 1b). Fig.1c depicts the CP map overlay on the stiffness map highlighting the BBB leakage. Fig1d depicts the wave and overlay images.The combined information of BBB leakage and decrease in mean stiffness reveals that local region of infarct has undergone stiffness loss (i.e., no since no significant post-compressibility change observed) and BBB breakdown. Further, CP map shows that during stroke the BBB is disrupted. The disruption can be observed through increased permeability (Fig. 1e). The highest CPI was observed to be 34% at the weak BBB indicating that BBB is on the verge of breakdown. Further, the mean tissue displacement was found to be highest at a shear wave frequency of 15 Hz(60.69) and least at 20 Hz (5.45). The localized region based elasticity variation was highest at 25Hz (28%) and least 20Hz (8.2%).
Discussion
Our results clearly indicate a decrease in stiffness of stroke-affected infarct tissue. The loss of stiffness was in the range between 0.33 and 4.70 kPa compared to previous feasibility study on stiffness of stroke MRE [6], and the CPI was observed to be less in the weak BBB regions. However, quantification of regional dependent elasticity changes needs to be further investigated. Limitations of this study include performing our measurements on MRE of stroke patient.Conclusion
There is very little knowledge on the capability of MRE on ischemic stroke. CPI and stiffness may be used as metrics for analyzing localized region compressibility and degenerative changes of brain tissues during stroke. The results demonstrate through CP and stiffness maps that extent of tissue integrity that is degraded inside the infarct region can be assessed efficiently.Acknowledgements
The authors would like to thank Dr. Ramesh Venkatesan, Principal Engineer, GE Helathcare for his insightful comments and suggestions.References
[1] R. Muthupillai, Science 1995, 269: 1854-7.
[2] O. Rouviere, M. Yin, et al. 2006, Radiology 240(2): 440-8.
[3] L. Huwart, 2006, NMR Biomed 19(2): 173-9.
[4] Papazoglou et al. Phys Med Biol.2009;54:2229-2241.
[5] S. Hirsch et al, 2010, ISMRM.
[6] M. Yin, 2007, ISMRM.
Figures