4708
Improved Visualization and Measurement of Intracranial Aneurysmal Walls: Comparison between 7T and 3T Black-blood MRI.1State Key Laboratory of Brain and Cognitive Science, Beijing MR Center for Brain Research, Institute of Biophysics, Chinese Academy of Sciences, Beijing, People's Republic of China, 2Biomedical Imaging Research Institute, Cedars-Sinai Medical Center, Los Angeles, CA, United States, 3Department of Radiology and Biomedical Imaging, University of California San Francisco, San Francisco, CA, United States, 4Department of Interventional Neuroradiology, Beijing Neurosurgical Institute and Beijing Tiantan Hospital, Beijing, People's Republic of China, 5Xuanwu Hospital, Beijing, People's Republic of China, 6University of Chinese Academy of Sciences, Beijing, People's Republic of China, 7Siemens Shenzhen Magnetic Resonance Ltd., Shenzhen, People's Republic of China
Synopsis
Black-blood MRI (BB-MRI) has been used to evaluate the walls of intracranial aneurysms at both 3T and 7T. However, there is no quantitative comparison between the two field strengths in terms of delineation quality of aneurysmal wall by using BB-MRI. In this study, we analyzed black-blood images acquired from the same group of patients at both 7T and 3T. Higher wall-to-lumen signal ratio (WLSR) and lower inside wall thickness (IWT) were obtained from 7T black-blood images. Our results suggest that 7T BB-MRI can provide improved visualization and measurement of intracranial aneurysmal walls.
Introduction
Preliminary studies suggest that black-blood MRI (BB-MRI) may be a useful technique for evaluating patients with intracranial aneurysms. While most of the previous BB-MRI studies in this application were performed on 3T systems, 7T has also been used1. However, there is no head-to-head comparisons of the wall thickness of intracranial aneurysms between 7T and 3T2. In this study, we quantitatively evaluated the image quality of intracranial aneurysms acquired by 7T and 3T MR scanners from the same patients.Methods
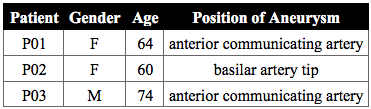
Three patients with intracranial aneurysms participated in this study with informed consent. Data were collected on a 7T research system (Siemens, Erlangen, Germany) equipped with a Nova 32-channel head coil, and on a 3T MAGNETOM Prisma MR scanner (Siemens, Erlangen, Germany) equipped with a 64-channel head coil during the same day. Subjects underwent TOF-MRA and BB-MRI at 7T, and BB-MRI only at 3T. Their basic information is listed in Table 1.
An optimized prototype SPACE (sampling perfection with application-optimized contrasts using different flip-angle evolution) sequence was used to acquire black-blood images. The following parameters were used in SPACE at 7T: TR/TE = 1200ms/16ms, FOV = 181x181mm2, GRAPPA = 3, voxel size = 0.40x0.40x0.40mm3, ETL (Echo Train Length) = 50, and time of acquisition (TA) = 10:29min. The parameters of SPACE at 3T were: TR/TE = 900ms/15ms, FOV = 170x170mm2, GRAPPA = 2, voxel size = 0.53x0.53x0.53mm3, ETL = 52, and TA = 8:10min. At 7T, 3D TOF-MRA was used to locate the aneurysm and reveal its geometry, with TR/TE = 18ms/4.96ms, FA = 24°, FOV = 210 x 164 mm2, voxel size = 0.33x0.33x0.40mm3, and TA = 9:16min.
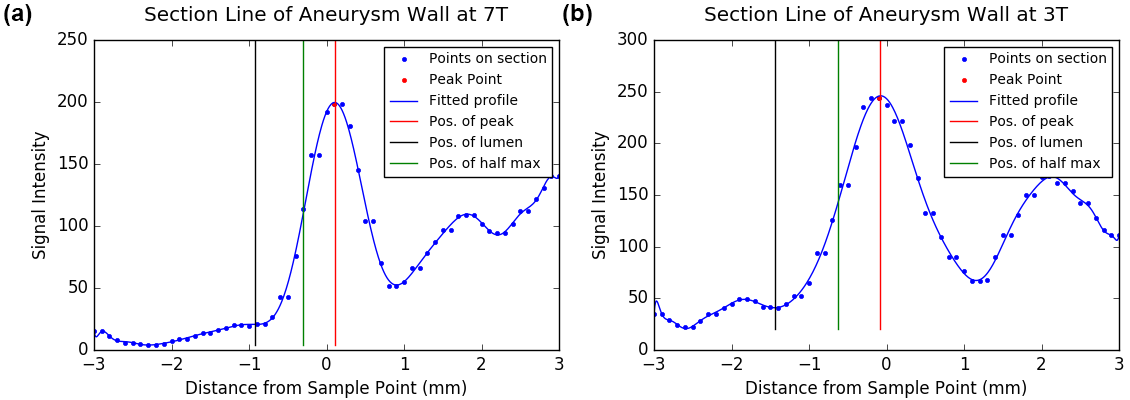
The black-blood images were interpolated to achieve a resolution of isotropic 0.10mm. For every aneurysm, three sections with different perspectives were reconstructed to better visualize the aneurysmal wall. The inside wall thickness (IWT) was measured as the half width at half maximum of the inside aneurysmal wall on the polynomial fitted profile (see Fig.1), and thus the outer high signal of cerebrospinal fluid or brain parenchyma would minimally influence the measurement. The wall-to-lumen signal ratio (WLSR) was calculated with the peak values of the wall and the lumen.
Results
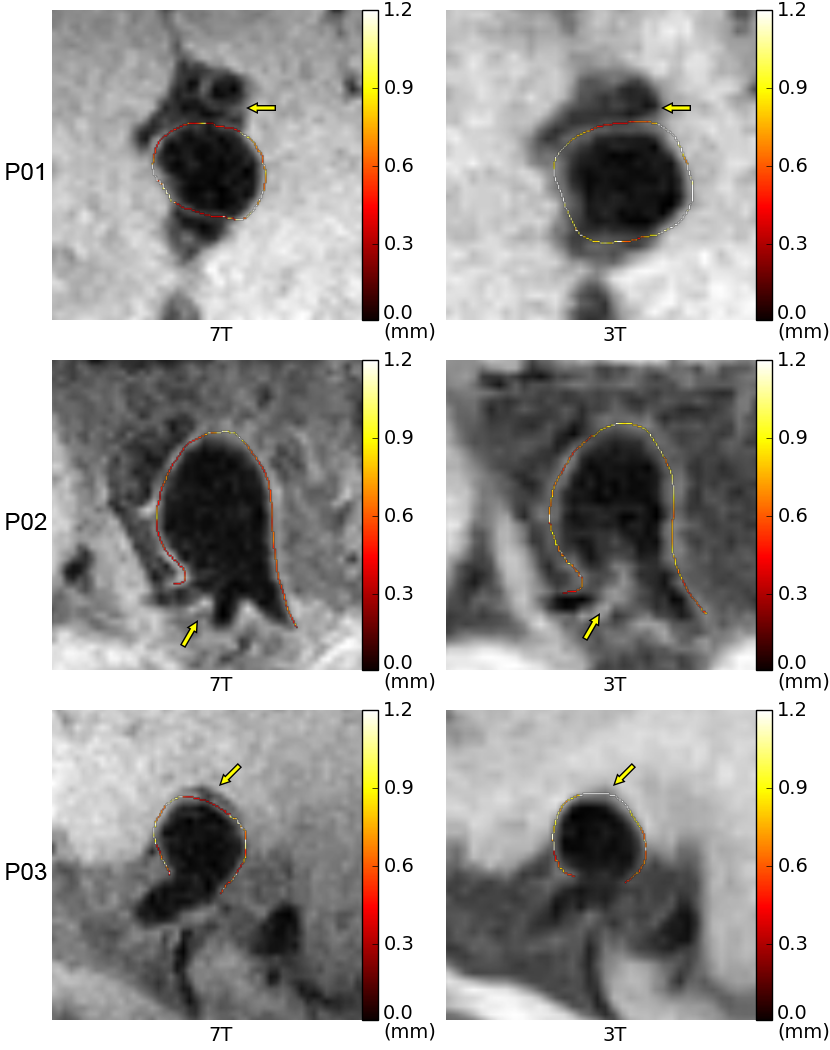
The section lines of the walls were compared between 7T and 3T in Fig. 1, at the same position on the aneurysm of P02. Fig.2 showed typical section views of the three aneurysms. In P01, the wall of a vessel near the aneurysm and its gap to the aneurysm were clearly imaged by 7T BB-MRI, while these were blurred in the 3T image. In P02, the blood signal at the aneurysm’s neck was poorly suppressed in 3T BB-MRI. The parent vessels and its orifices could only be observed in the 7T image. In P03, the peripheral space of the aneurysm only appeared on the high-resolution 7T image, but not on the 3T image.
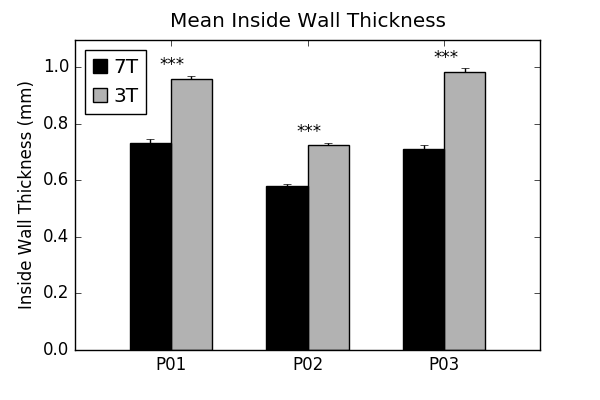
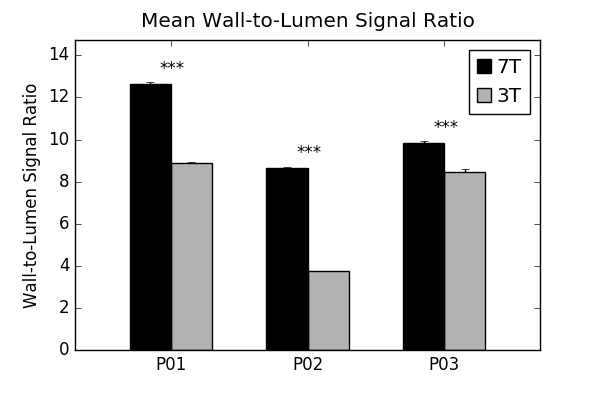
In all the sections with IWT values superimposed in Fig. 2, lower IWT values were achieved on high-resolution 7T BB-MRIs, which was confirmed by the statistics in Fig. 3. In Fig. 4, the images acquired by 7T exhibited higher WLSRs than 3T, demonstrating better contrast obtained by 7T BB-MRI for aneurysmal wall imaging.
Discussion
The higher resolution of 7T BB-MRI substantially reduced the partial-volume effect and provided clearer depiction of fine structures near the aneurysms. In P03, 7T BB-MRI captured the peripheral space of the aneurysm and made it possible to find the lower IWT values at the dome of the aneurysm. Moreover, higher spatial resolution and SNR of 7T BB-MRI produced sharper profiles and lower IWT values of aneurysmal wall than 3T, making it easier to find locations with unusual thickness.
Furthermore, the dephasing process is faster at 7T than at 3T, so the blood signal is darker on 7T BB-MRI images. At the neck of an aneurysm, two or more parent arteries have orifices and turbulence typically occurs. The blood flow with incomplete dephasing at 3T BB-MRI may cause lower WLSR and makes it hard to observe the structure of the parent arteries.
The protocol of BB-MRI still needs optimization to enhance the contrast between aneurysmal wall and brain parenchyma, and avoid the fake high IWT measurement.
Conclusion
We compared BB-MRI images of intracranial aneurysms in the same group of patients between 7T and 3T. 7T BB-MRI with higher resolution provides sharper profiles of the aneurysmal walls, better-suppressed signals of the lumen, and reveals finer structures around the aneurysms. The lower IWT and higher WLSR prove that 7T BB-MRI is an ideal imaging modality for the study of intracranial aneurysmal walls.Acknowledgements
This work was supported in part by Chinese MOST grants (2015CB351701, 2012CB825500), NSFC grant (91132302), and CAS grants (XDB02010001, XDB02050001).References
1. Blankena, R., Kleinloog, R., Verweij, B. H., van Ooij, P., Ten Haken, B., Luijten, P. R., ... & Zwanenburg, J. J. M. (2016). Thinner regions of intracranial aneurysmal wall correlate with regions of higher wall shear stress: A 7T MRI Study. American journal of neuroradiology.
2. Zhu, C., Haraldsson, H., Tian, B., Meisel, K., Ko, N., Lawton, M., ... & Saloner, D. (2016). High resolution imaging of the intracranial vessel wall at 3 and 7 T using 3D fast spin echo MRI. Magnetic Resonance Materials in Physics, Biology and Medicine, 1-12.
Figures