4703
Cortical thickness and morphometric volumes derived from Multi-Echo MPRAGE scans acquired with different head coils1Center for Brain Science, Harvard University, Cambridge, MA, United States, 2Athinoula A. Martinos Center for Biomedical Imaging, Massachusetts General Hospital, Charlestown, MA, United States
Synopsis
Variations in modern head-coil design lead to sensitivity differences, changes in intensity profiles, and image SNR. As morphometric analysis is based on automated analysis of image intensity and contrast variations, such variation of head coil may be expected to provide variation in morphometric results. We investigated the morphometric results from MEMPRAGE scans on subjects scanned in pairs of different head coils. We saw very limited variation in basic morphometric results from subjects scanned on the same day in different head coils. Cortical thickness variations are generally less than 50 µm, although some larger values were observed in portions of the temporal lobe. Larger differences were observed in volumes of small sub-cortical structures. These structures often have high variability in repeat measurements. However, intensity and SNR variations between coils are often most felt in the deeper regions of the brain, perhaps contributing to wider variation for these structures.
Introduction
Automated MRI-derived measurements of human brain volumes from anatomical scans provide novel insights into normal and abnormal neuroanatomy, but few studies have probed the effects of sequence-dependent parameters on these measurements.1 The multi-echo MPRAGE (MEMPRAGE) sequence reduces signal distortion by using a higher bandwidth and averaging multiple echoes to recover SNR while using variable T2* decays to enhance contrast, and hence, cortical segmentation.2 To follow changes longitudinally, or to combine disparate scans into large groups for disease or impact study, researchers are often faced with the problem of upgrading technology, in particular improvements in parallel-array head coils in recent years. Here we investigate the morphometric results from MEMPRAGE scans on subjects scanned in pairs of different head coils on an older and a new scanner.Methods
All measurements were performed using a 3.0 T MRI scanner (Siemens Tim Trio or Siemens Prisma). 11 subjects (mean: 28.0 years, 6 female) were scanned on the Tim Trio in sessions where the product 12 and 32-channel head coils were used. 10 of 11 subjects were retested on a different day within a 1-6 week period, so a total of 21 pairs of scans using the 2 head coils were obtained. Retest variation in individual subjects was not considered here. 7 other subjects (mean: 31.6 years, 4 female) were scanned on a Prisma, where the product 20, 32 and 64-channel head coils were trialed in one session. Each session included a MEMPRAGE acquired with recommended Freesurfer parameters with each head coil (6:03 min, TR/TI = 2530/1200 ms, matrix 256×256×176, resolution = 1 mm iso (no partial fourier), parallel imaging acceleration = 2, pre-scan normalize enabled). Images were analyzed using FreeSurfer,3 after the pairs of scans from each subject were aligned using the FreeSurfer robust registration tool.4 An automated parcellation of the cortex, subcortical and white matter structures was performed. The 33 cortical regions of the Desikan-Killiany atlas were combined into five principal cortical lobes for simpler analysis.5 Correlation and Bland-Altman difference plots were made for the thickness and volume of each principal cortical lobe determined from each scan, and for the volume of key sub-cortical structures. Surface-based plots were made to show regions of thickness difference.Results
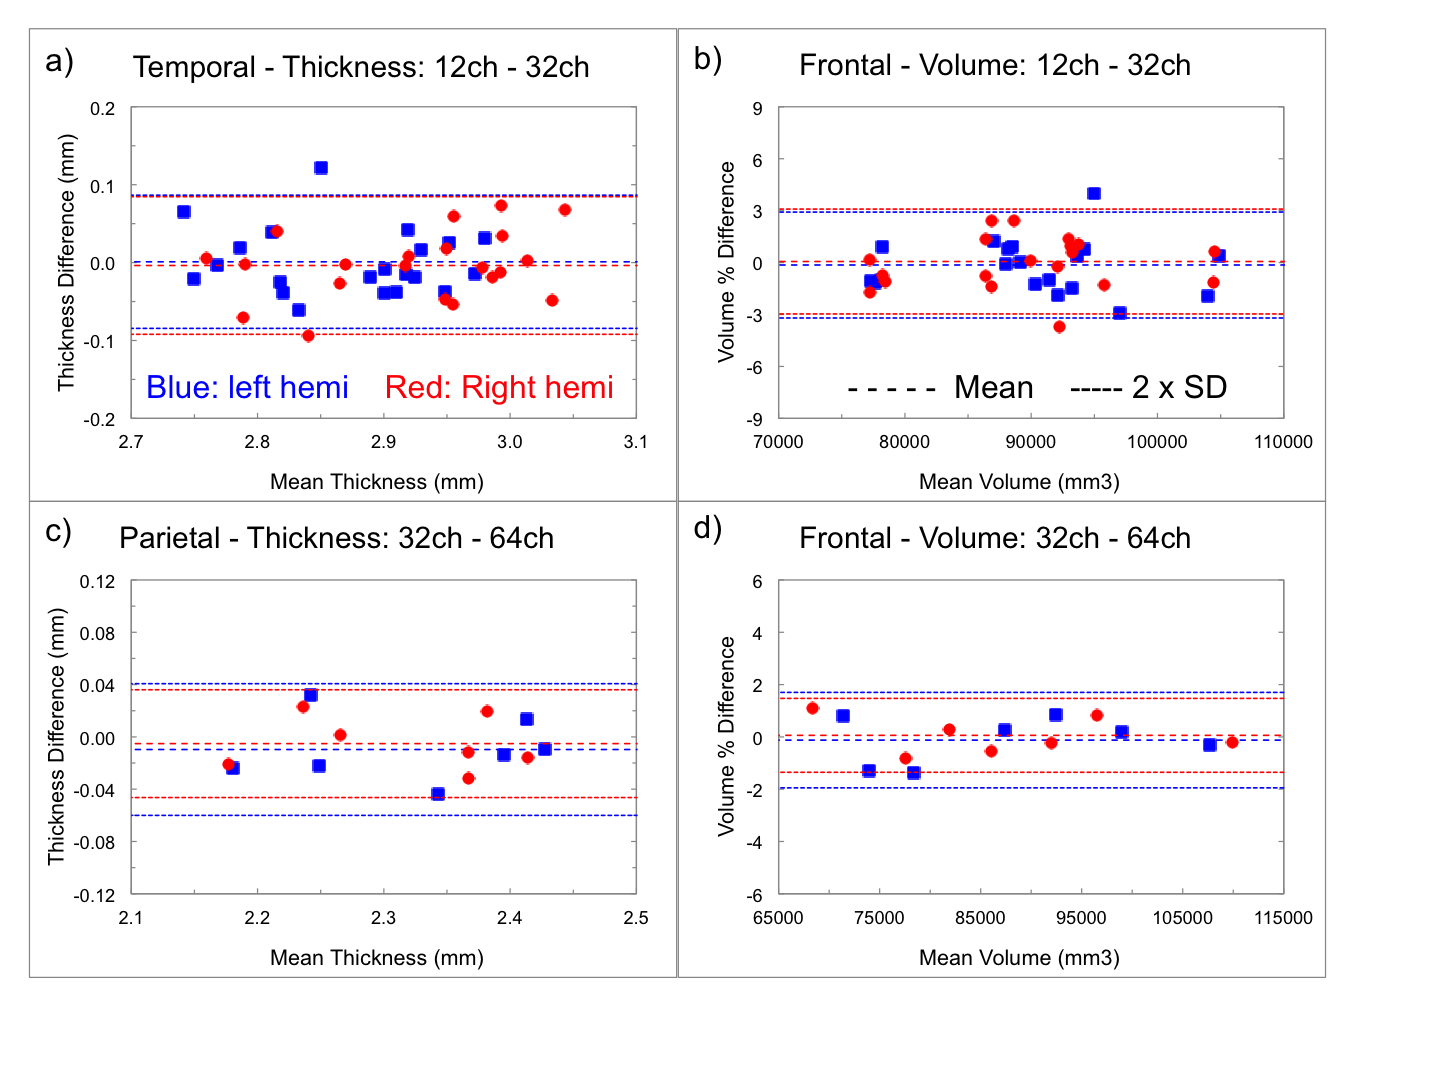
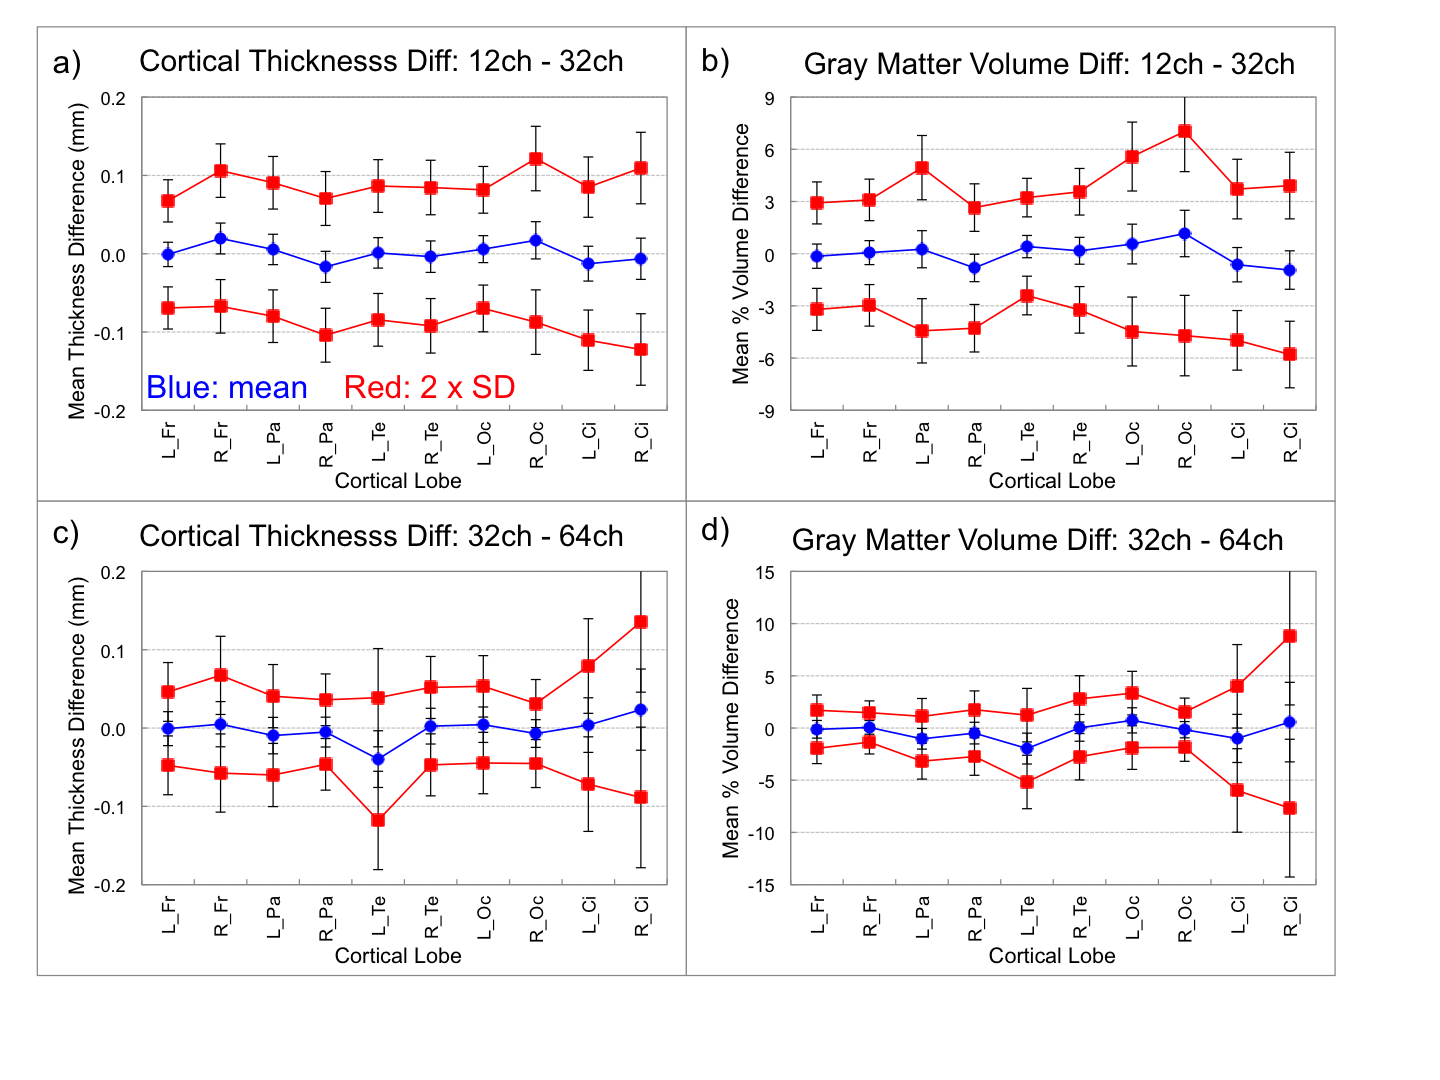
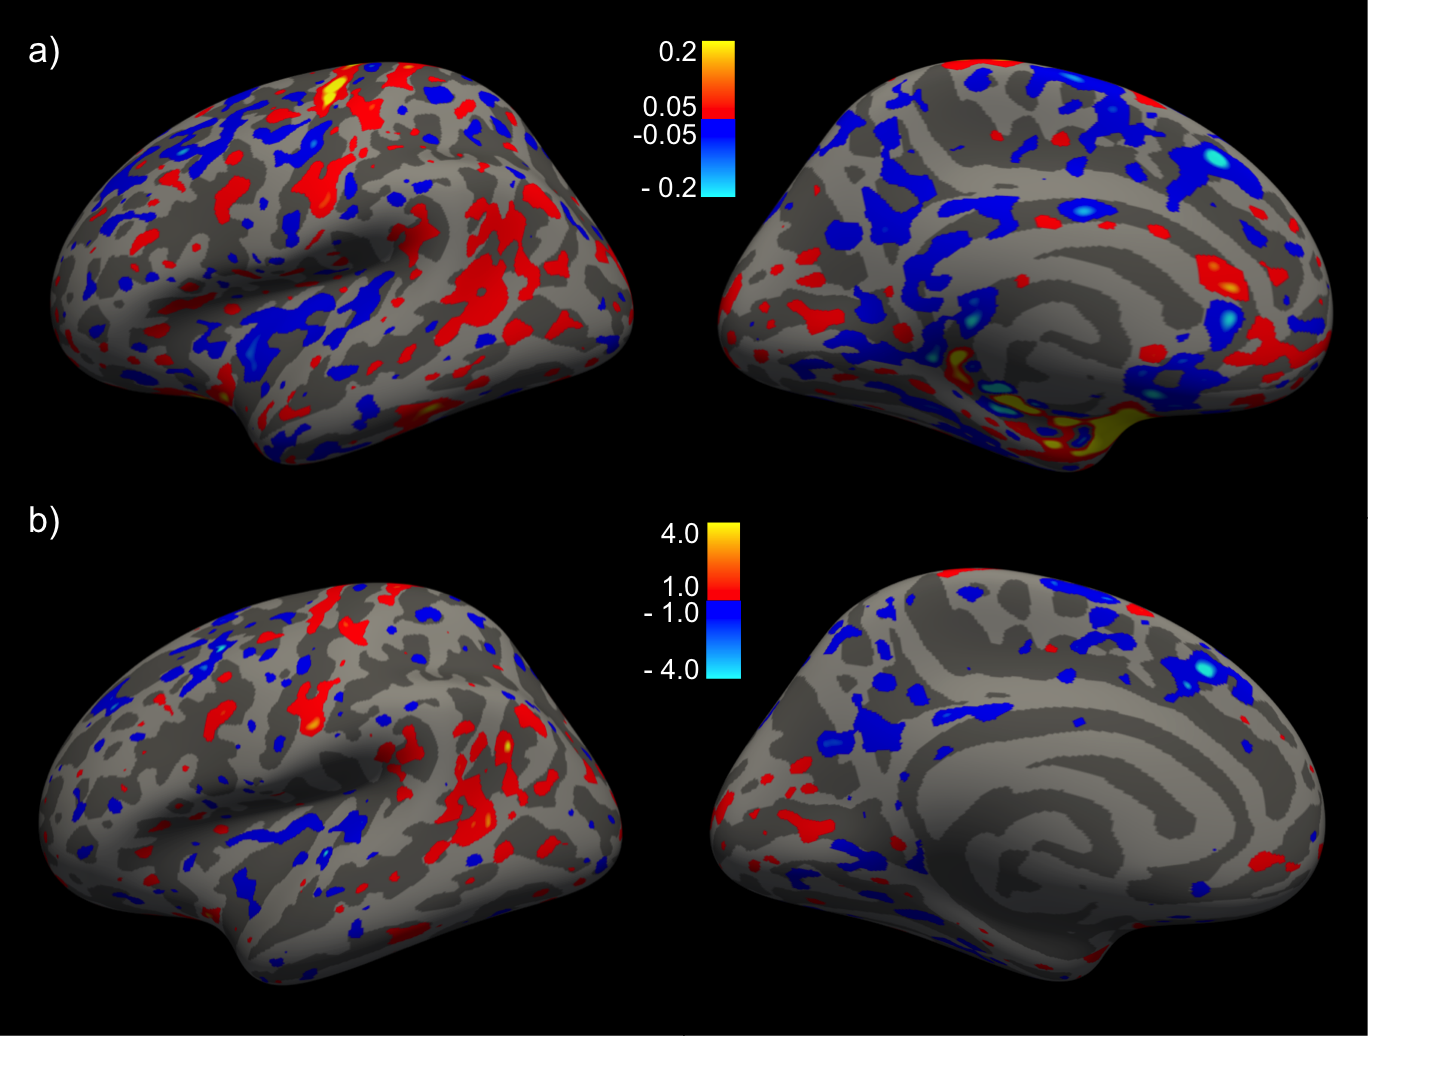
Difference-analyses were performed on all 21 pairs of 12ch and 32ch scans acquired on the same day, and on all 7 pairs of 32ch and 64ch scans acquired on the same day. The 20ch coil on the Prisma was not considered at this time. Example Bland-Altman plots for the Trio and Prisma scans are shown in Fig. 1. The difference analyses for the cortex are summarized in Fig. 2. For both the Trio and Prisma scans, the cortical thickness differences for the full lobes are mostly less than 20 µm, gray-matter volume differences are mostly less than 1%. The sub-cortical volume measurements show a slightly wider range, up to 4%, due to the small size of the some of these structures. Bland-Altman slopes were usually within ~ -0.1 – 0.1, indicating no bias with measurement value. Thickness differences from the Trio scans, plotted on the surface, are shown in Fig. 3.Discussion
Variations in modern head-coil design lead to sensitivity differences, changes in intensity profiles, and image SNR. However, coil choice may be made based on the physical design and how it fits subject’s heads, whether glasses are needed for visual stimulation/displays during the session, or simply availability. The large number of options for head coils now means inevitable variation in multi-site studies, or when data is pooled from existing public sources for new analysis. As morphometric analysis is based on automated analysis of image intensity and contrast variations, such variation of head coil may be expected to provide variation in morphometric results. The results show very limited variation in basic morphometric results from subjects scanned on the same day in different head coils. Cortical thickness variations are generally less than 50 µm, although in the 12ch v 32ch comparison, larger values are observed in portions of the temporal lobe - however the differences are not significant (Fig. 3b). Its possible the use of intensity normalization results in increased noise (or lower SNR) in the temporal regions, leading to the small bias in those regions. Where caution is required is in estimates of volumes of small sub-cortical structures. These structures often have high variability in repeat measurements, due to their small size and reduced contrast differences.6 However, intensity and SNR variations between coils are often most felt the deeper regions of the brain, perhaps contributing to wider variation for these structures.Acknowledgements
Harvard Center for Brain Science; NIH Shared Instrumentation Grant S10OD020039; NIH Grants P41-RR14075, U24-RR021382References
1. Wonderlick, J.S. et al., ‘Reliability of MRI-derived cortical and subcortical morphometric measures: Effects of pulse sequence, voxel geometry, and parallel imaging’, NeuroImage, 2009:44;1324-1333.
2. van der Kouwe, A.J.W. et al., ‘Brain morphometry with multiecho MPRAGE’, NeuroImage, 2008:40:559–569.
3. Fischl, B, ‘Measuring the thickness of the human cerebral cortex from magnetic resonance images’, Proc. Natl. Acad. Sci. USA, 2000;97:11050-11055.
4. Reuter, M., ‘Highly Accurate Inverse Consistent Registration: A Robust Approach’, NeuroImage, 2010;53;1181-1196.
5. surfer.nmr.mgh.harvard.edu/fswiki/CorticalParcellation
6. Mair, R.W. et al., ‘Quantitative Comparison of Morphometric Data from Multi-Echo MPRAGE Variable Acceleration and Different Head Coils’, Proceedings ISMRM 2013;21:947.
Figures