4701
Grey matter atrophy measured in-vivo with 9.4T MRI in the experimental autoimmune encephalomyelitis mouse model of multiple sclerosis1Department of Radiology, University of Calgary, Calgary, AB, Canada, 2Hotchkiss Brain Institute, University of Calgary, Calgary, AB, Canada, 3Department of Clinical Neurosciences, University of Calgary, Calgary, AB, Canada, 4Experimental Imaging Center, University of Calgary, Calgary, AB, Canada
Synopsis
Grey matter atrophy has become a clinically relevant marker of progressive disability in multiple sclerosis (MS). To better study atrophy in MS, mouse models that have grey matter loss are needed. A possible candidate is the experimental autoimmune encephalomyelitis (EAE) mouse model. We used high-resolution magnetic resonance imaging (MRI) and atlas-based regional volumetrics to measure the volumes of 62 structures in the brains of EAE mice, 66 days post-induction. We identified atrophy in 19 structures including the cortex, cerebellum, striatum, thalamus, hippocampus, and corpus callosum. Using MRI we can study atrophy in this inflammatory model of MS.
Purpose
Grey matter (GM) atrophy is now known to play an important role in multiple sclerosis (MS) alongside inflammation and demyelination. GM atrophy has been associated with disease progression, physical disability, and cognitive impairment.1-3 As a result, atrophy has become one of the most clinically relevant markers of permanent damage and disability in MS.4 To better study and treat atrophy, there is a need for animal models that feature both neuroinflammation and atrophy. One potential model is experimental autoimmune encephalomyelitis (EAE), which is commonly used to study neuroinflammation. Previous work has shown that EAE mice experience atrophy in the cerebral cortex and cerebellum at long-term disease duration5 similar to MS patients.6,7 While promising, we do not know how widespread the atrophy is in EAE, or if additional GM structures that feature atrophy in MS, like the hippocampus,6,7 are also affected. Additionally, we do not know if white matter (WM) structures also feature atrophy. We used high-resolution magnetic resonance imaging (MRI), a Bruker cryoprobe, and atlas-based regional volumetrics to determine the extent of atrophy in the brains of EAE mice at long-term disease.Methods
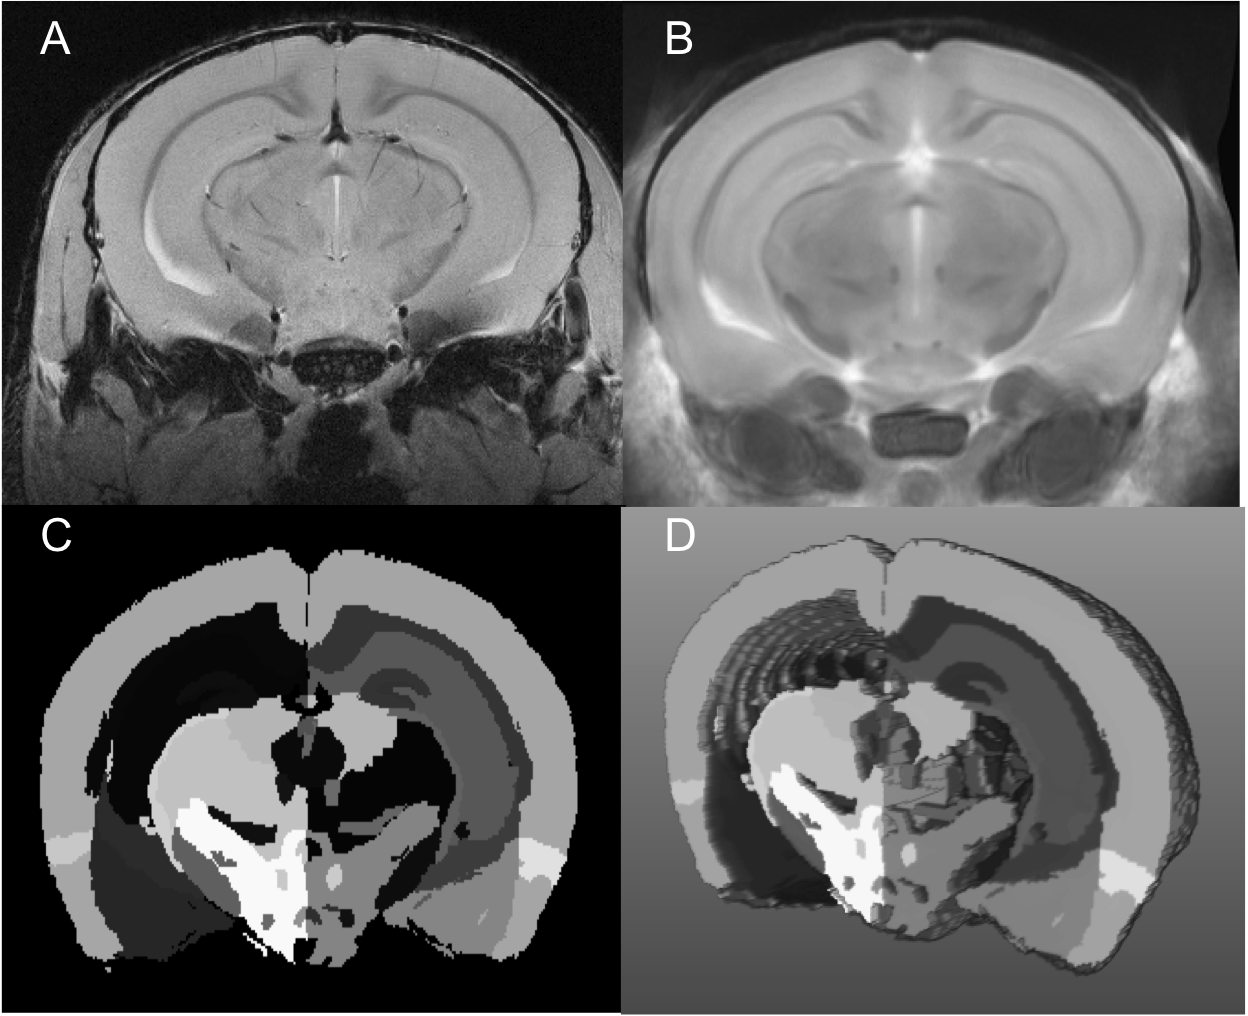
Female C57BL/6 mice were induced with EAE as described.8 Motor disability and disease severity were assessed using a 15 point scoring system based on individual limb paralysis.9 Mice were imaged at 66 days post induction (n= 27 EAE, 8 Naïve, 13 CFA (receive immune stimulant but no self targeting myelin antibodies)). Imaging was conducted using a 9.4T MRI with a helium cooled Bruker cryoprobe using a FLASH sequence (TR/TE/α=2000ms/6.5ms/60o voxel=37.5-x-37.5x-250μm3) (Figure 1a). Image intensity was normalized using the N3 algorithm to correct for signal drop-off associated with surface coils.10 Using the program Niftyreg, an average brain atlas generated based on 40 adult MRI datasets with 62 segmented brain regions11 was registered to each dataset (Figure 1b). After registration, the volume of each registered atlas brain region was determined (Figure 1c,d). Statistics were performed using an ANCOVA test with body weight as a covariate with a Bonferroni post-hoc. The false discovery rate method (FDR=5%) was used to correct for running multiple ANCOVA tests.12 Correlations between disease score and brain volume were quantified using Spearman’s test.Results
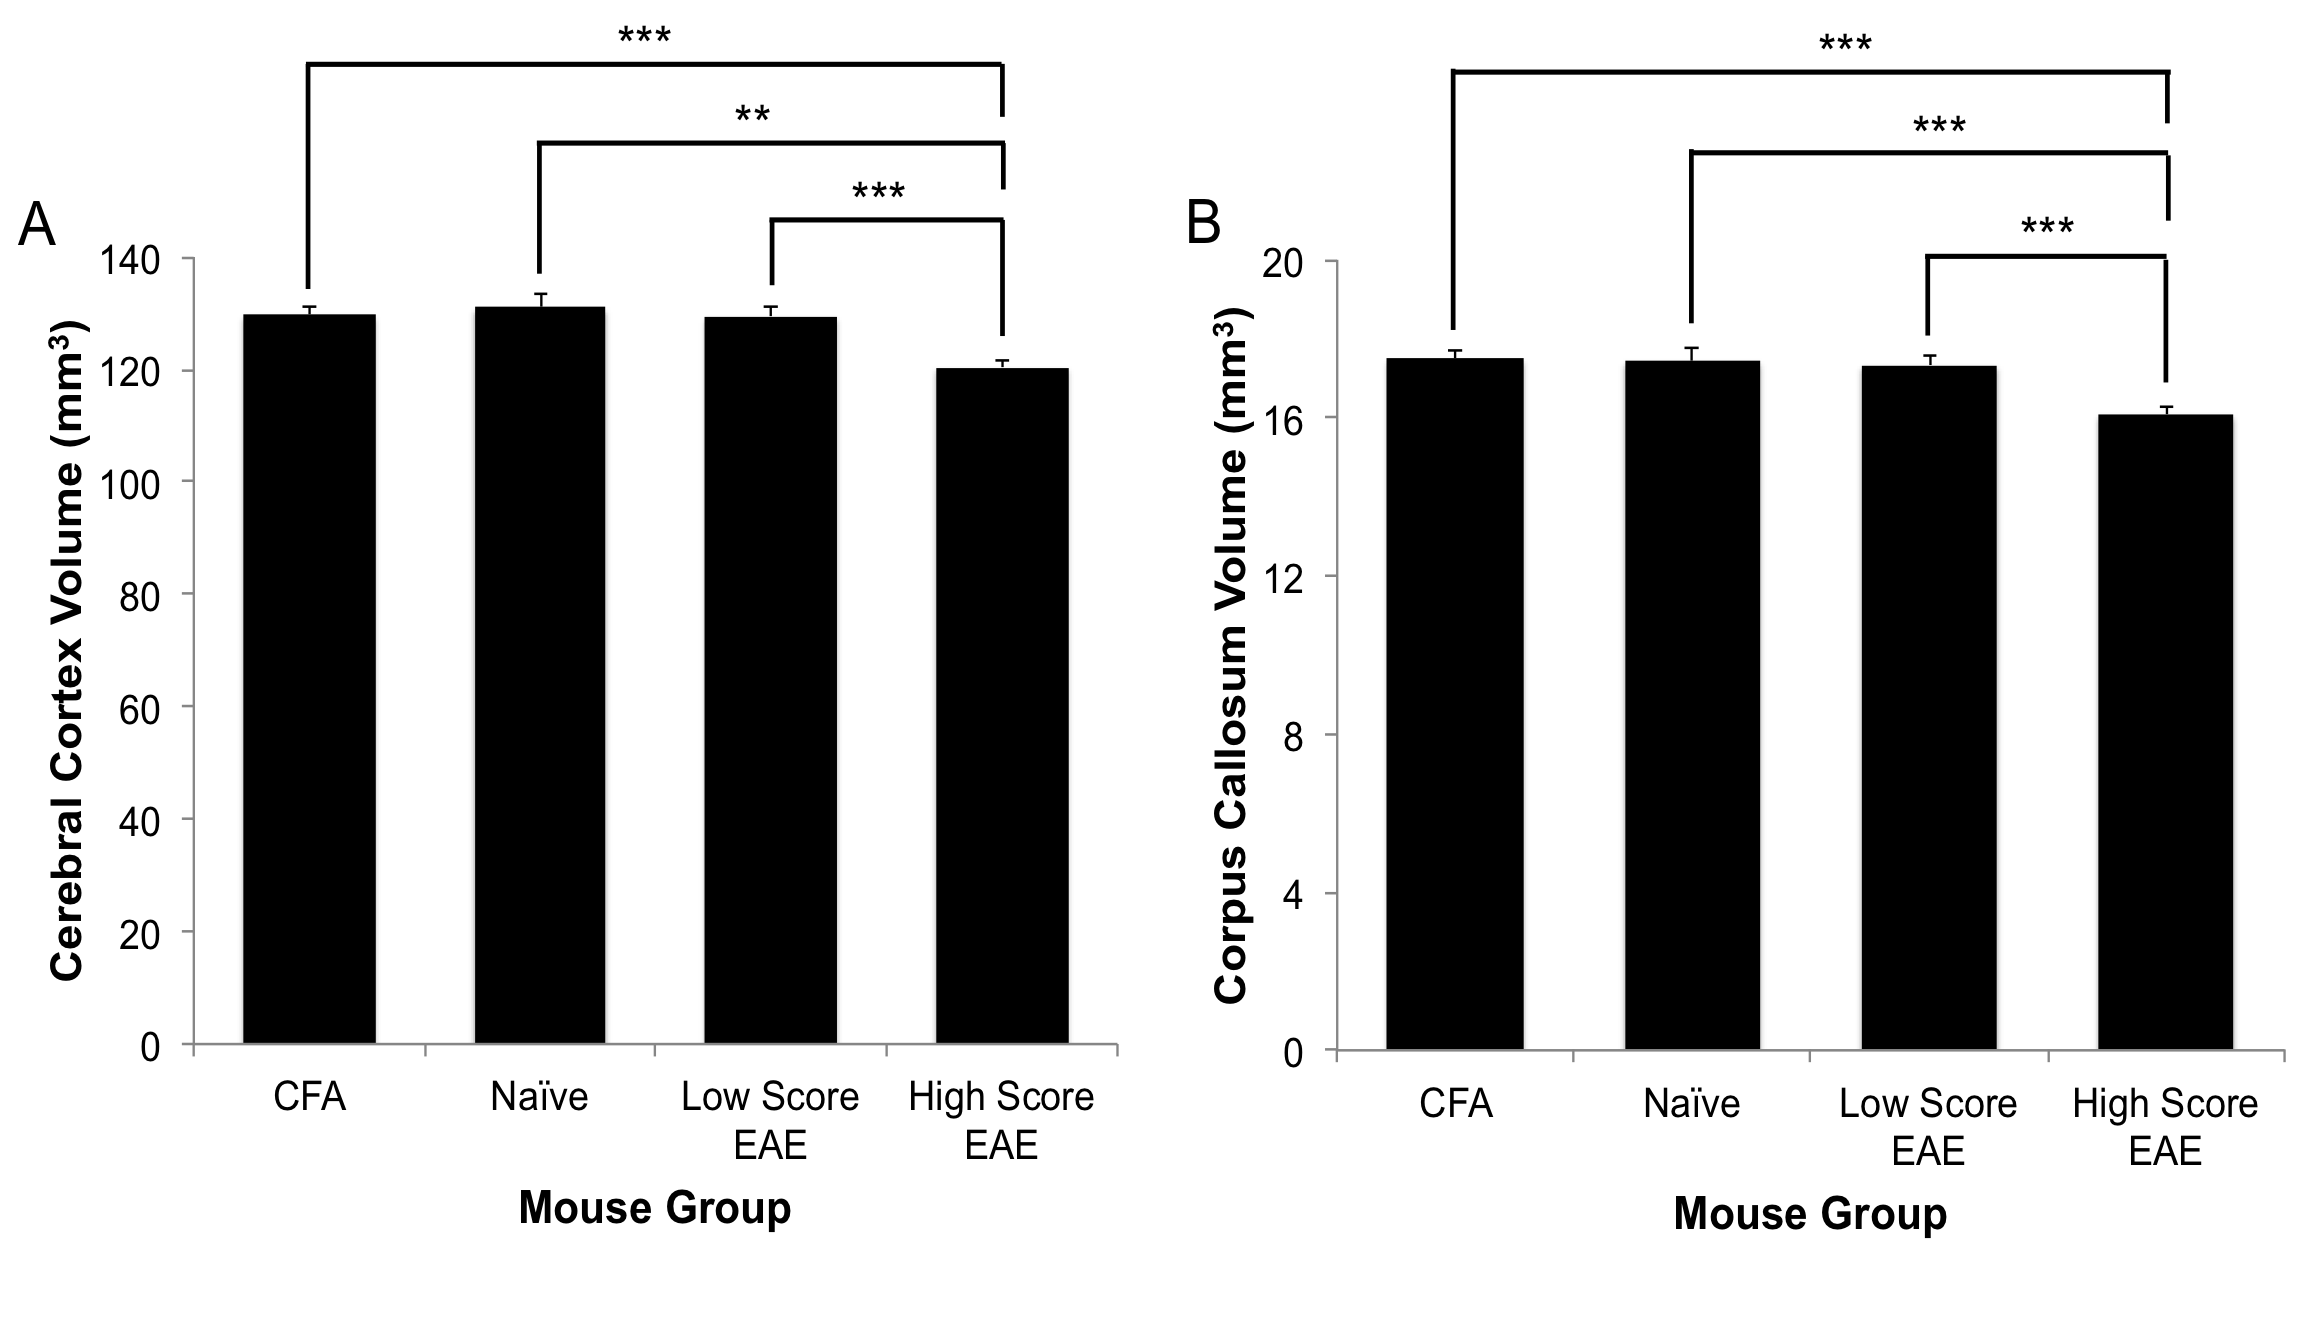
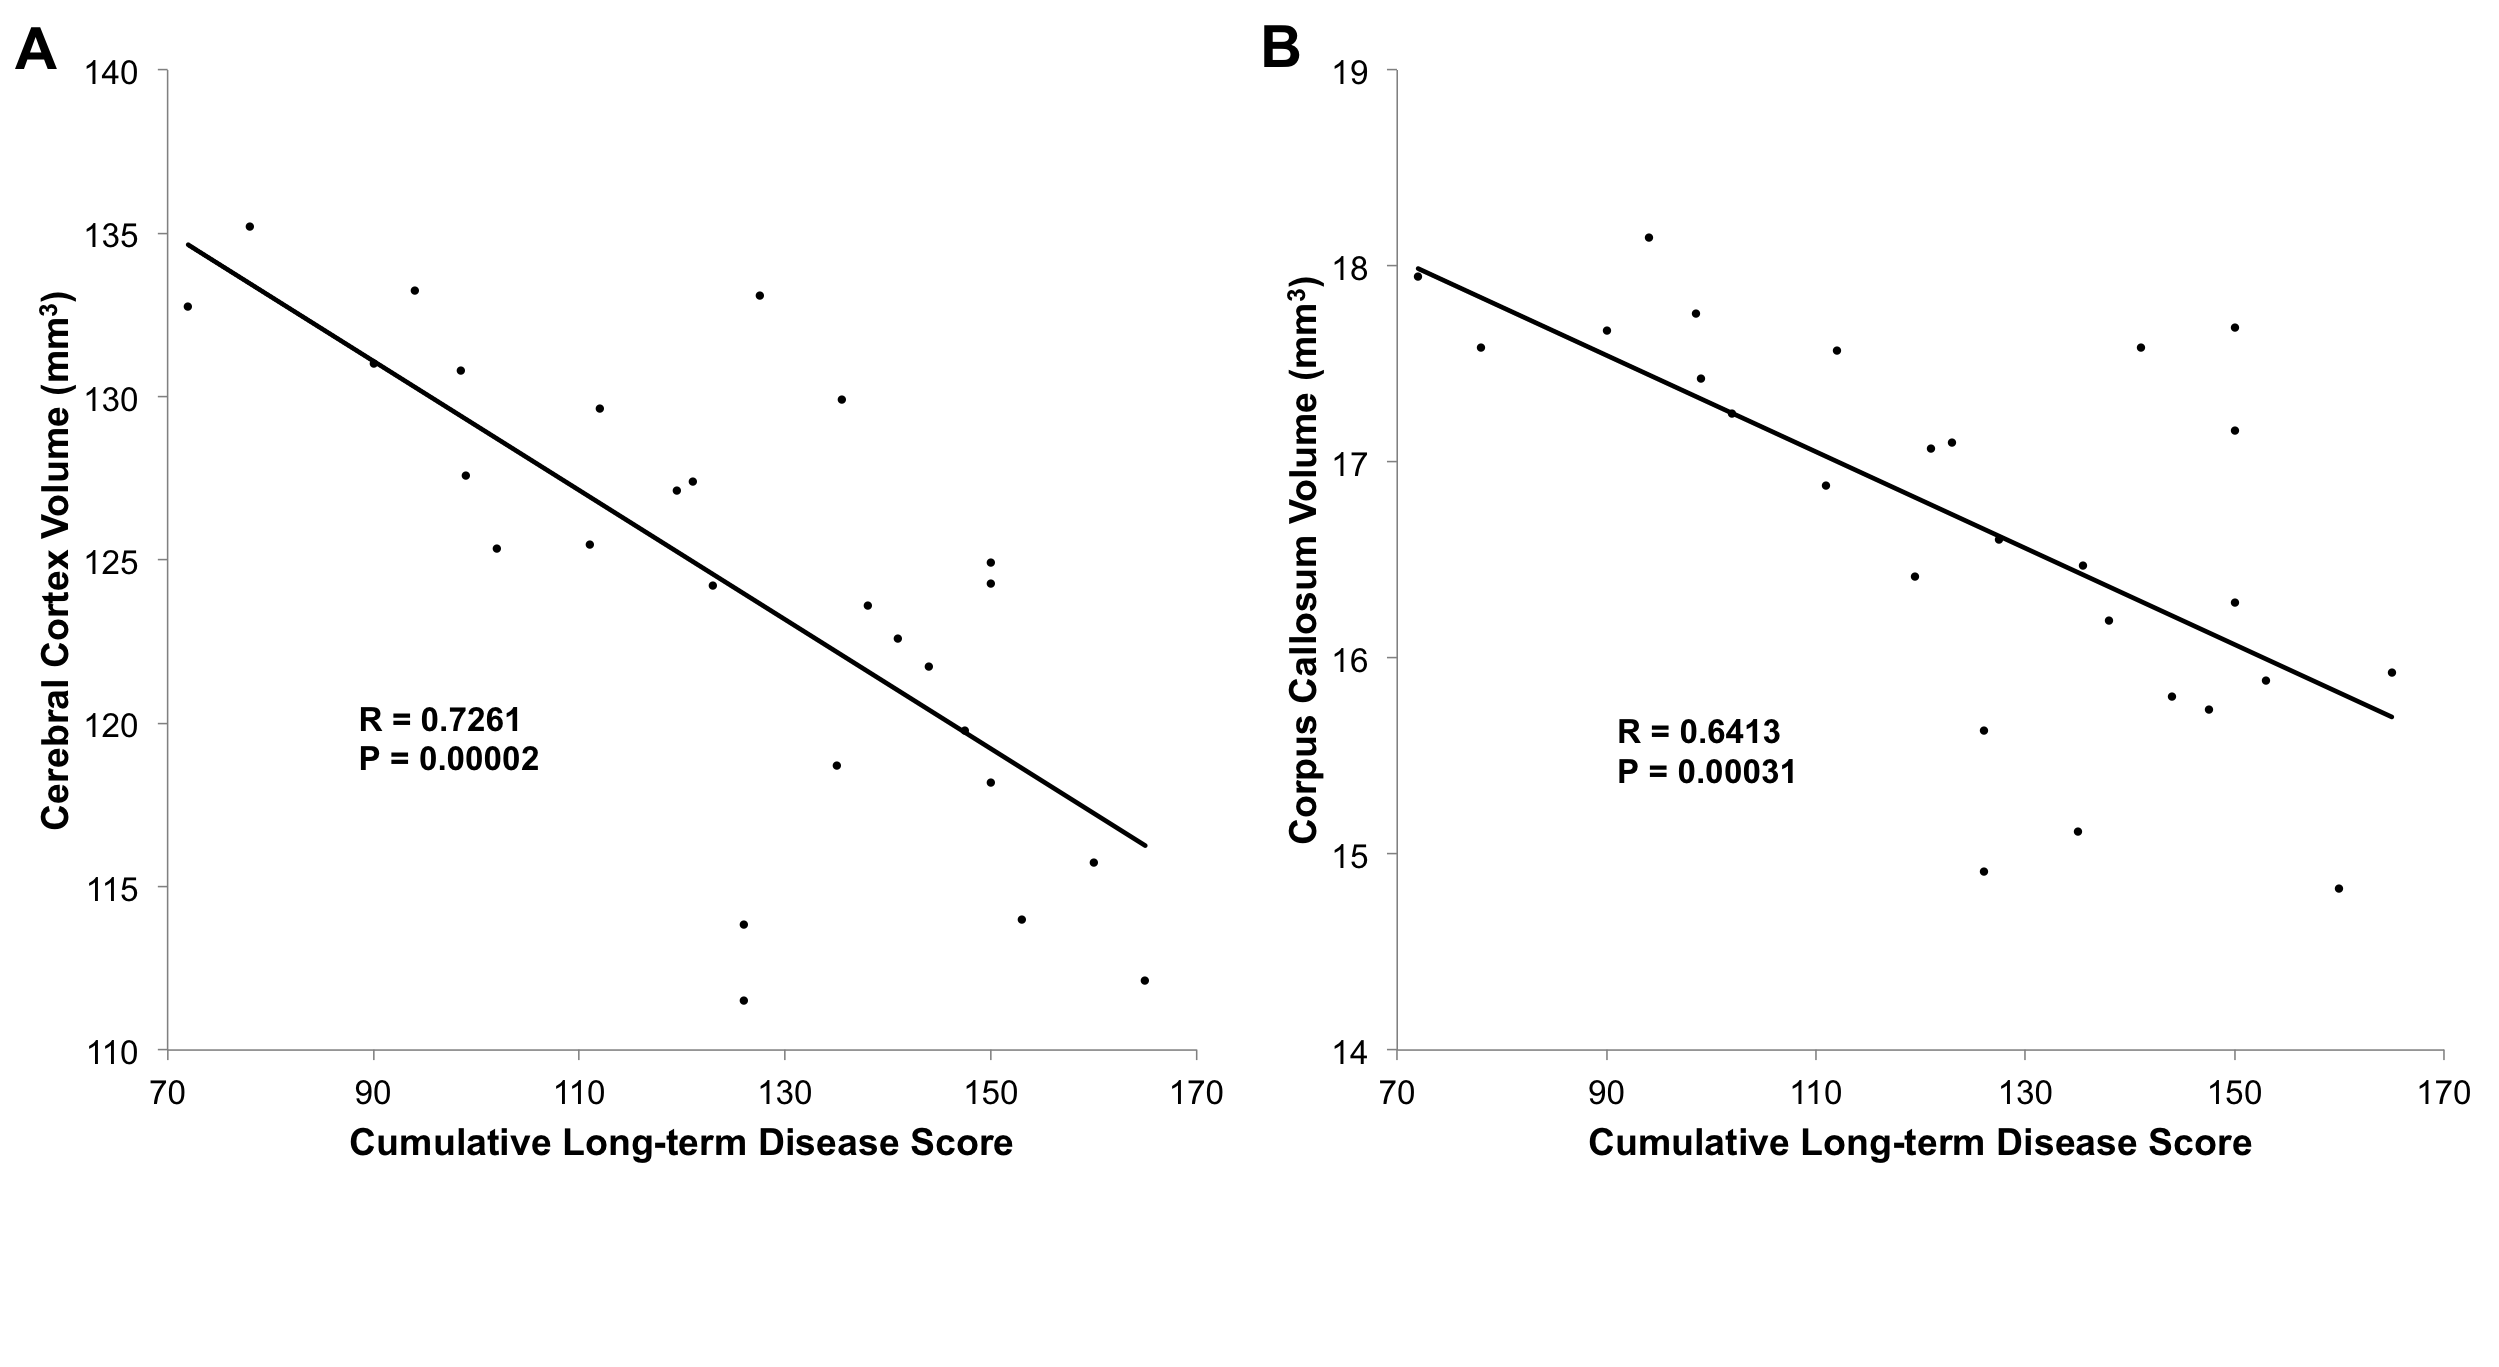
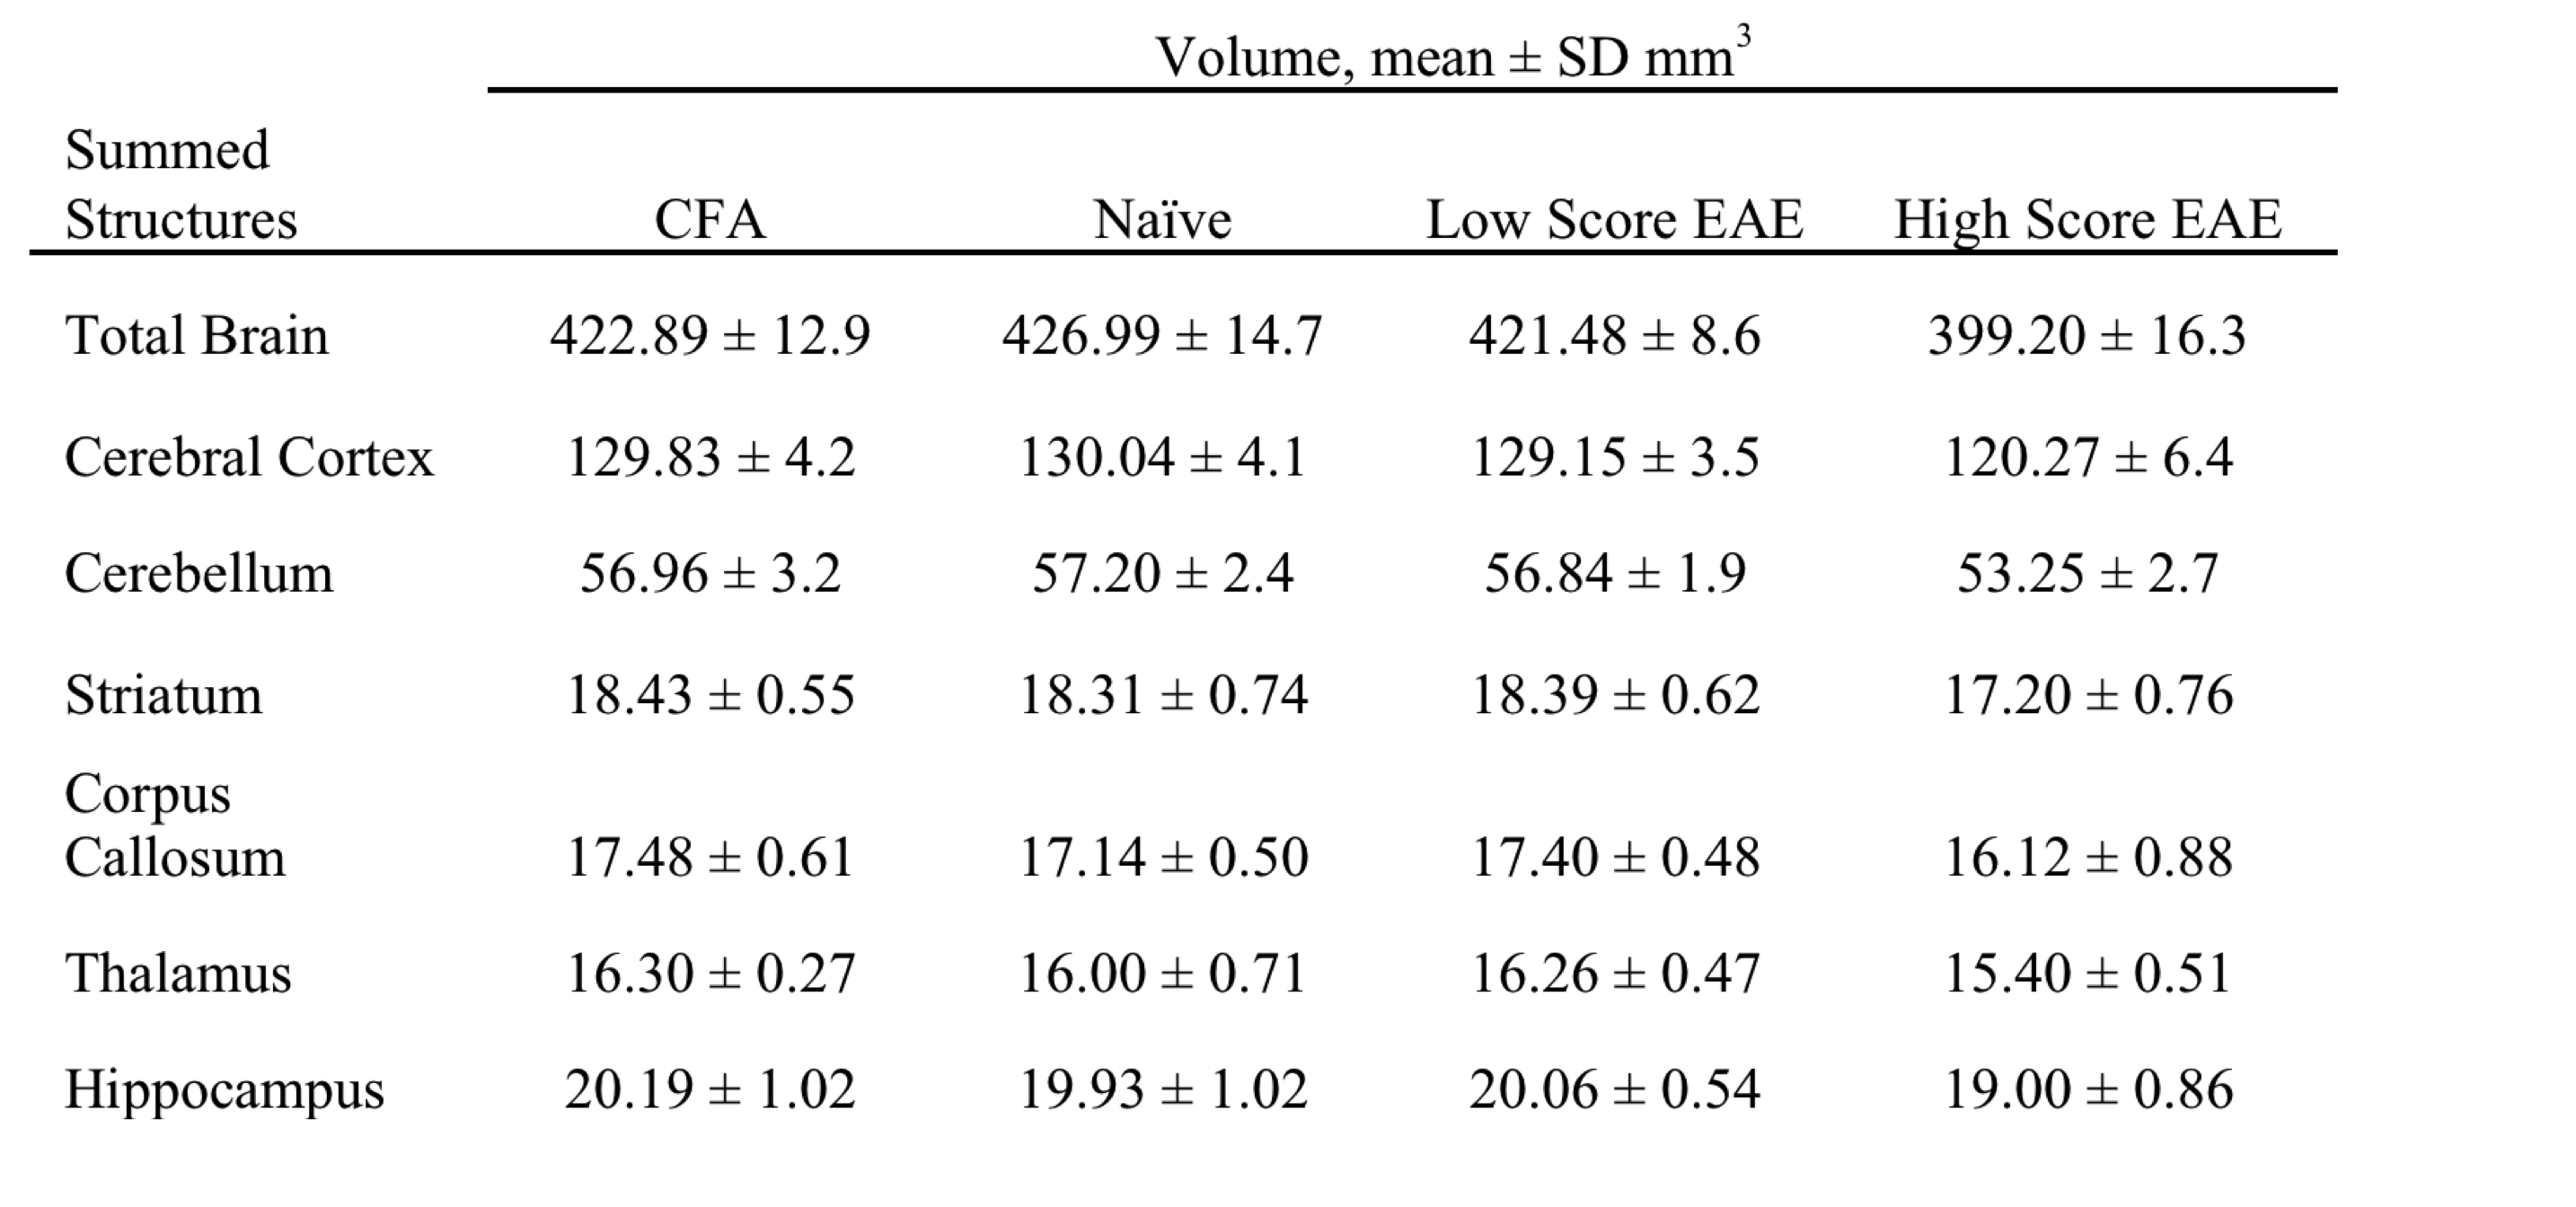
By combining a cryoprobe with 9.4T MRI, we were able to obtain a nominal resolution of 37.5-x-37.5x-250μm3 in 38 minutes while imaging in vivo. Long-term disease scores for EAE mice were summed from 30 days to endpoint. Cumulative long-term disease scores were averaged and EAE mice were divided into two groups based on whether their scores were above (high score) or below average (low score) (n=13 high score EAE, n=14 low score EAE). After correcting for weight, high score mice displayed smaller volumes for 19 out of the 62 measured structures compared to Naïve, CFA, and low score EAE mice. More GM structures were affected compared to WM structures. Affected structures include the cerebral cortex (Figure 2a), cerebellum (Figure 2b), hippocampus, thalamus, striatum, and the corpus callosum (Table 1). In EAE mice, atrophic structures showed strong correlations between volume and cumulative long-term disease score (Figure 3). This was not seen with acute or peak (day 14-16) disease scores.Discussion
The atrophic structures bear similarity to those that feature atrophy in MS, including the cortex, cerebellum, thalamus, striatum, hippocampus, and corpus callosum.6,7 This suggests that the EAE model may be a good model to study the mechanism behind atrophy as a result of neuroinflammation and MS.
We identified strong correlations between volumes of structures experiencing atrophy and long-term disease scores. Atrophy in MS is seen as a marker of permanent damage and this appears to be the case in EAE. Similar correlations have been found between axonal loss in the spinal cord and long-term disease score in EAE mice.13 This suggests that atrophy in the brain may be a marker of axonal loss in the spinal cord and vise versa. Indeed, previous research has shown strong correlations between permanent damage in the spinal cord and atrophy.14 It is possible that both are driven by similar mechanisms though future research is needed to determine this.
Conclusion
EAE mice exhibit significant reductions in brain volume at long-term disease duration compared to control mice. To our knowledge, this is the first report of atrophy in EAE for structures including the striatum, thalamus, hippocampus, and corpus callosum. We identified atrophy in 19 of the 62 structures including the cortex and cerebellum as previously reported.4,13 The EAE model, with this imaging protocol, has the potential to be a model for studying GM atrophy in MS and for testing neuroprotective therapeutic treatments.Acknowledgements
Funding for this study was provided by the Queen Elizabeth II scholarship and the AIHS CRIO team grant.
References
1. Fisher E, Lee JC, Nakamura K and Rudick RA. Gray matter atrophy in multiple sclerosis: a longitudinal study. Ann Neurol. 2008; 64: 255-65.
2. Simon JH. Brain and spinal cord atrophy in multiple sclerosis: role as a surrogate measure of disease progression. CNS Drugs. 2001; 15: 427-36.
3. Lanz M, Hahn HK and Hildebrandt H. Brain atrophy and cognitive impairment in multiple sclerosis: a review. J Neurol. 2007; 254 Suppl 2: II43-8.
4. Bermel RA and Bakshi R. The measurement and clinical relevance of brain atrophy in multiple sclerosis. Lancet Neurol. 2006; 5: 158-70.
5. MacKenzie-Graham A, Rinek GA, Avedisian A, et al. Cortical atrophy in experimental autoimmune encephalomyelitis: in vivo imaging. Neuroimage. 2012; 60: 95-104.
6. Filippi M and Rocca MA. MR imaging of multiple sclerosis. Radiology. 2011; 259: 659-81.
7. Ceccarelli A, Rocca MA, Pagani E, et al. A voxel-based morphometry study of grey matter loss in MS patients with different clinical phenotypes. Neuroimage. 2008; 42: 315-22.
8. Agrawal SM, Silva C, Tourtellotte WW and Yong VW. EMMPRIN: a novel regulator of leukocyte transmigration into the CNS in multiple sclerosis and experimental autoimmune encephalomyelitis. J Neurosci. 2011; 31: 669-77.
9. Weaver A, Goncalves da Silva A, Nuttall RK, et al. An elevated matrix metalloproteinase (MMP) in an animal model of multiple sclerosis is protective by affecting Th1/Th2 polarization. FASEB J. 2005; 19: 1668-70.
10. Sled JG, Zijdenbos AP and Evans AC. A nonparametric method for automatic correction of intensity nonuniformity in MRI data. IEEE Trans Med Imaging. 1998; 17: 87-97.
11. Dorr AE, Lerch JP, Spring S, Kabani N and Henkelman RM. High resolution three-dimensional brain atlas using an average magnetic resonance image of 40 adult C57Bl/6J mice. Neuroimage. 2008; 42: 60-9.
12. Benjamini Y and Hochberg Y. Controlling the False Discovery Rate: A Practical and Powerful Approach to Multiple Testing. Journal of the Royal Statistical Society Series B (Methodological). 1995; 57: 289-300.
13. Wujek JR, Bjartmar C, Richer E, et al. Axon loss in the spinal cord determines permanent neurological disability in an animal model of multiple sclerosis. J Neuropathol Exp Neurol. 2002; 61: 23-32.
14. Spence RD, Kurth F, Itoh N, et al. Bringing CLARITY to gray matter atrophy. Neuroimage. 2014; 101: 625-32.
Figures