4696
Exploring Subvoxel Structures in Brain Tumors using Magnetic Resonance Fingerprinting1Radiology, Case Western Reserve University, Cleveland, OH, United States, 2Biomedical Engineering, Case Western Reserve University, Cleveland, OH, 3Radiology, University Hospitals, Cleveland, OH, United States
Synopsis
We apply a partial volume analysis to MR fingerprinting brain tumor data. In the analysis, the number and types of tissues that make up a given voxel are not assumed to be known a priori, which is particularly important in the case of abnormal tissues, such as tumors or edema. We examine the partial volume results in a patient with a glioblastoma multiforme (GBM) and another with a metastasis to look for patterns in healthy tissues, tumor, and the peritumoral region.
Purpose
When tissue structure changes happen within a portion of a voxel, quantitative measures regarding that voxel may not accurately represent the structure. Such is the case in magnetic resonance fingerprinting 1 (MRF), where tissue parameters are quantified simultaneously in a single acquisition. Last year, a new framework was presented that showed the potential to solve this partial volume (PV) problem in MRF through a Bayesian model that provides voxel-wise identification of subvoxel components and corresponding weights 2. Here we apply this model to examine subvoxel properties of brain tumors and surrounding tissues.Methods
In this method, each voxel is treated as a sparse reconstruction problem. No assumptions are made as to which tissues are present in any given voxel, only that there should be as few tissues as possible 2. MRF signal evolutions were analyzed from two patients previously scanned at 3T in an IRB-approved study with an MRF-bSSFP sequence. Patient A had a pathology proven glioblastoma (GBM) and patient B was diagnosed with a rectal carcinoma metastasis. The PV algorithm was applied to find clusters of T1, T2 values present within each voxel, as well as the corresponding tissue weights, which are calculated simultaneously within the algorithm.
We are interested in the subvoxel behavior within the tumor core and in the peritumoral region. One voxel is chosen within each region for each patient for comparison.
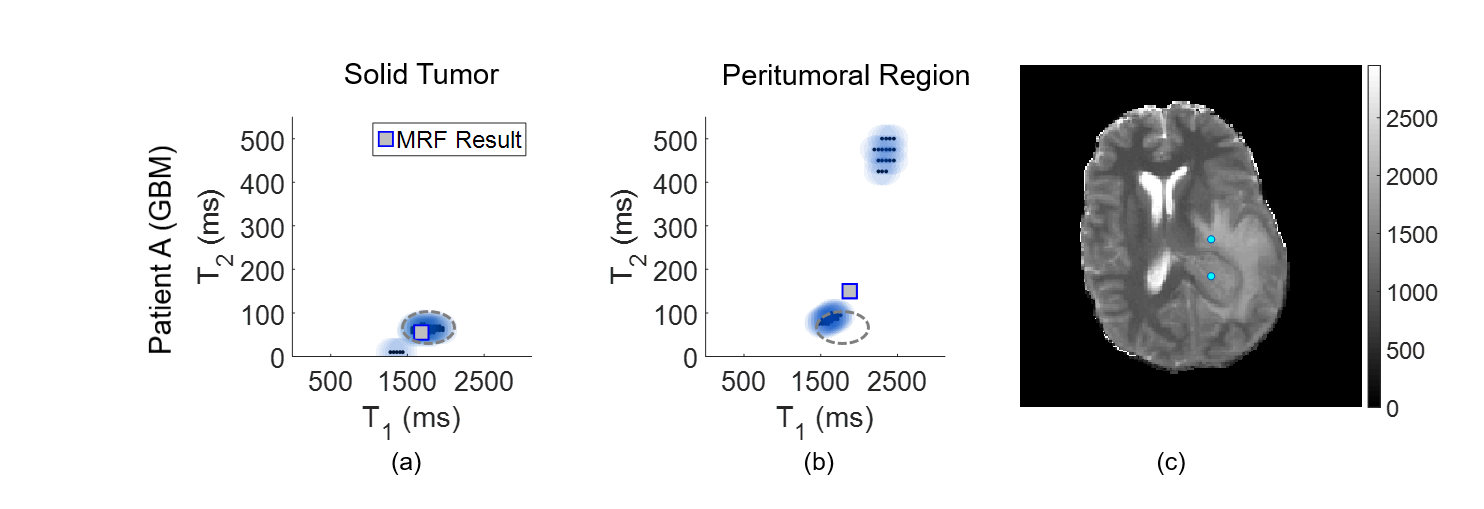
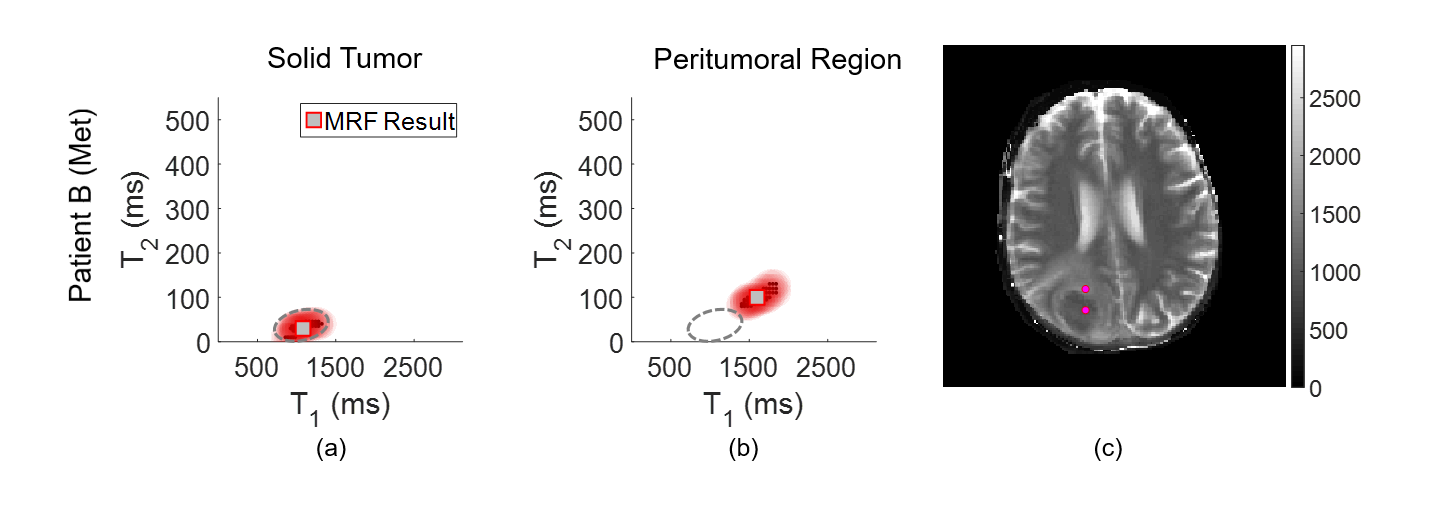
Results are visualized two ways. First, the results per voxel are displayed in a T1, T2 scatterplot with the corresponding weight overlaid using a color intensity proportional to the weight value. The single-component MRF result is also indicated.
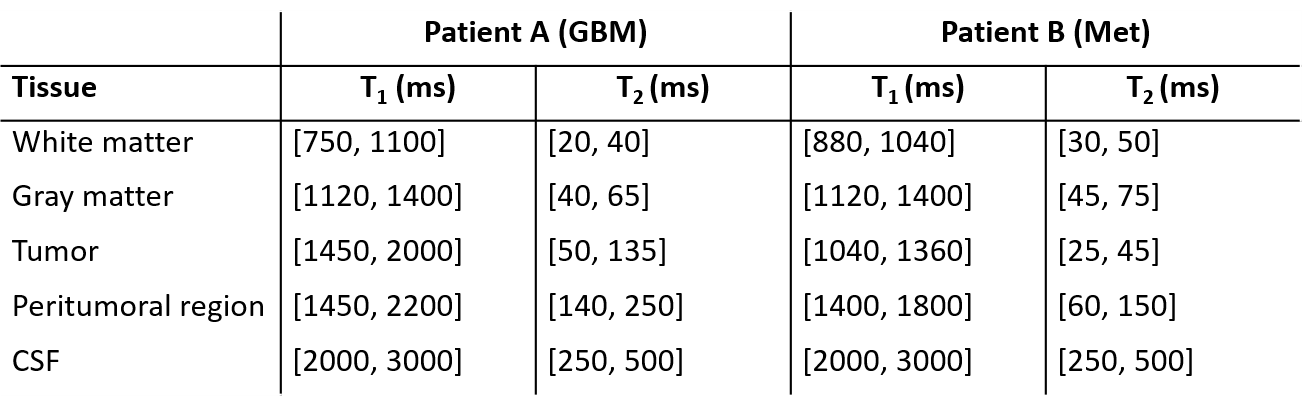
Using these scatter plots, we defined T1 and T2 ranges which characterize different tissue clusters. To this end, we applied the k-means algorithm to the results to identify the most dominant clusters seen over the entire brain. For both patients, we found 10 cluster means, and using these, deduced five T1, T2 ranges specific to each patient to represent the following tissues: white matter, gray matter, CSF, tumor core, and peritumoral region. Finally, at each voxel and for each tissue range, the calculated weights from our algorithm were added together to give an estimate of the tissue fractions which are displayed in image form.
Results
Single voxel results are shown in Figures 1 and 2 for patients A and B, respectively. The locations of the voxels analyzed are indicated in the MRF T1 maps for each patient, shown in the respective figures.
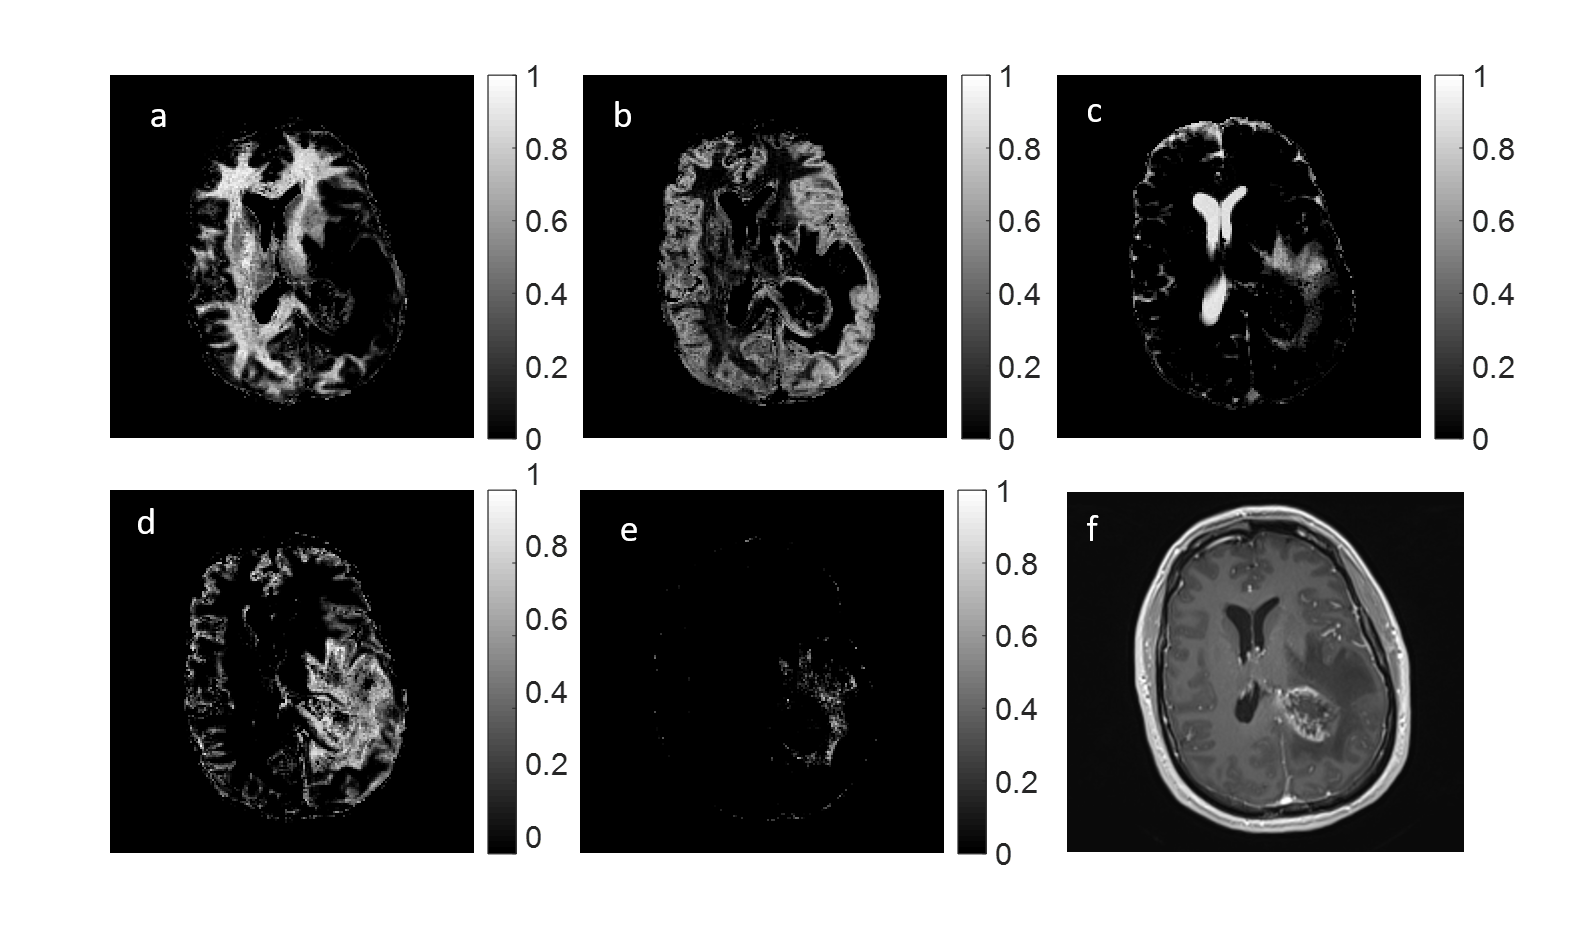
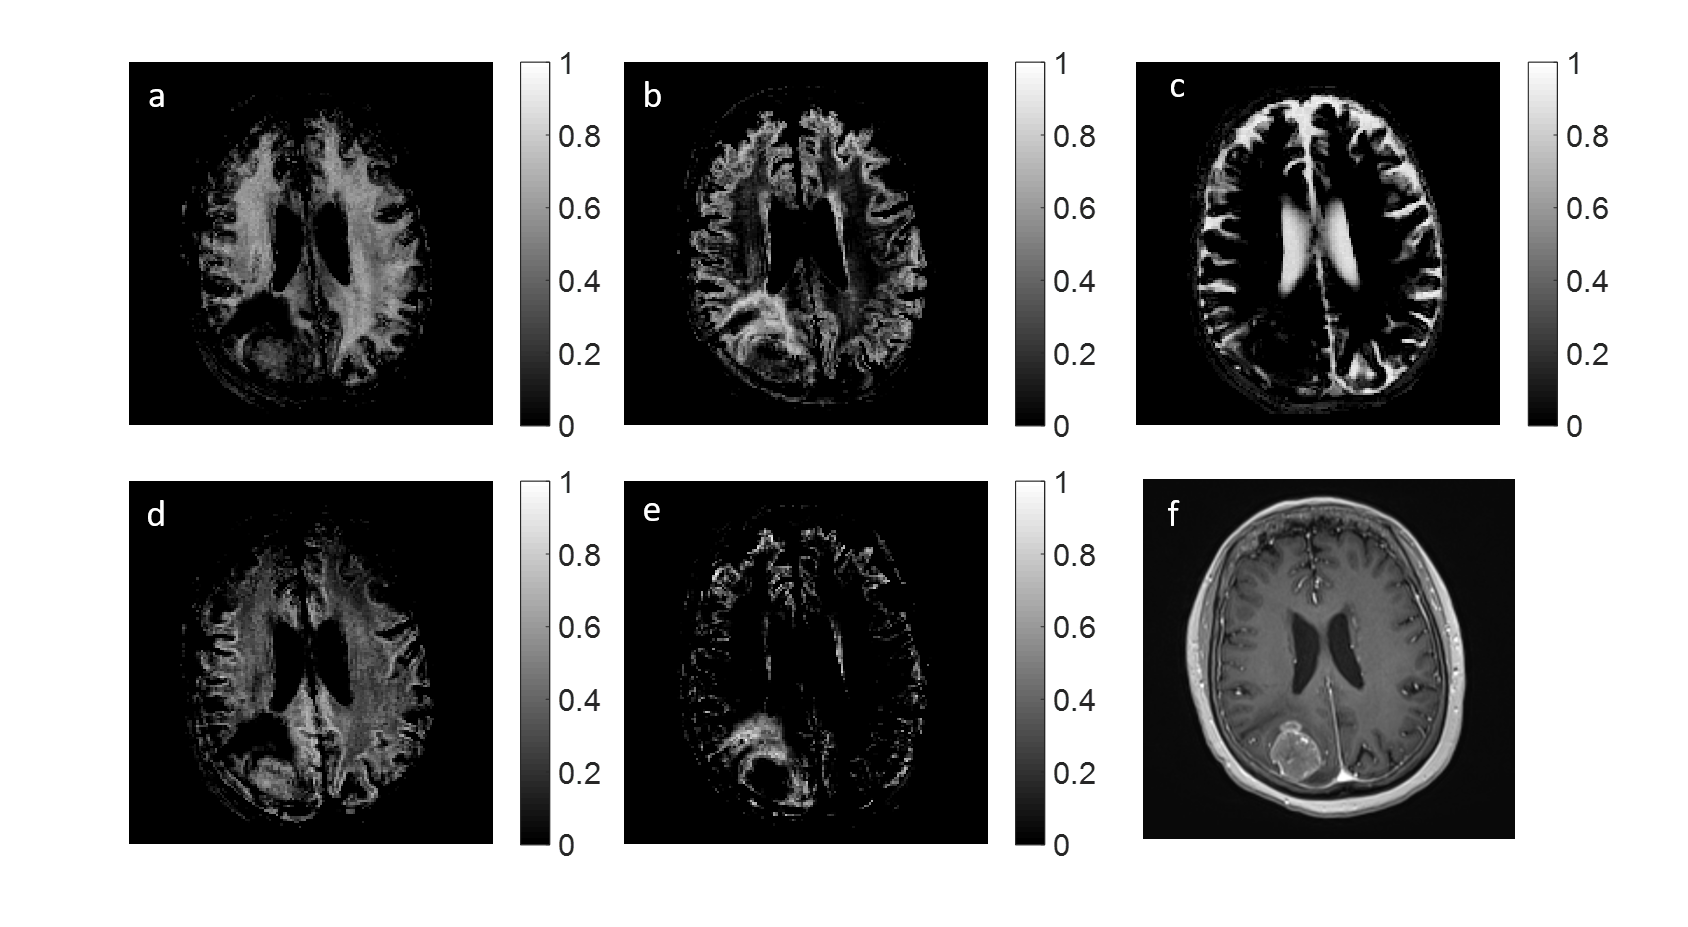
The T1 and T2 ranges used to generate the fraction maps are displayed in Figure 3, and fraction maps are shown in Figures 4 and 5. Included in both Figures 4 and 5, are the clinical post contrast T1 images.
Discussion
The voxel chosen within the tumor core of patient A shows two components, with a dominating cellular component. This region is outlined and overlaid on the voxel result from the peritumoral region in Figure 1b. Present within the peritumoral voxel is a cellular component which shows overlap with the tumor component, in addition to a separate fluid component. Note that the MRF result shown does not match either of the two components seen in the PV analysis, indicating that when multiple distinct tissues are present within one voxel, the MRF result may be incorrect. In contrast, for patient B, voxels from both within and surrounding the tumor exhibit one well mixed component, which agrees with the MRF results. No overlap is seen between the two voxels, indicating that the tissues within and surrounding the tumor are distinct.
The fraction maps shown in Figures 4 and 5 corresponding to healthy tissue are as expected in regions of pure white matter, gray matter, and CSF.
For patient A, Figure 4d suggests that the PV components within the tumor and in the peritumoral region exhibit significant overlap, implying that similar cellular features may be present. Additionally, a large fraction of fluid is shown in the peritumoral region (Figure 4c). For patient B, overlap is seen between white matter and tumor core (Figure 5a,d). However, the peritumoral region (Figure 5e) shows no contribution from either of these tissues, indicating that the tumor and peritumoral regions contain distinct, different tissues.
Conclusion
We have investigated subvoxel properties in two patients using the Bayesian approach for PV in MRF. These preliminary results suggest that PV analysis may aid in identifying common tissue features in different regions throughout the brain more accurately than relaxometry alone. Definitive conclusions cannot be made using two patients, and significant validation is needed through testing of additional patient data.Acknowledgements
The authors would like to acknowledge funding from Siemens Healthcare and NIH grants 1R01EB016728-01A1 and 5R01EB017219-02.References
1. Ma, D. et al. Magnetic resonance fingerprinting. Nature 495, 187–192 (2013).
2. McGivney, D., Deshmane, A., Jiang, Y., Ma, D. & Griswold, M. The partial volume problem in MR fingerprinting from a Bayesian perspective. Proceedings of the 24th Annual Meeting, ISMRM, 0435 (2016).
Figures