4694
Relationship between cortical Grey Matter quantitative Magnetization Transfer and corresponding sub-cortical White Matter in healthy adults1Sir Peter Mansfield Imaging Centre, School of Physics and Astronomy, University of Nottingham, Nottingham, United Kingdom
Synopsis
The aim of this study is to estimate the correlation between myelination in the cortical ribbon and the underlying subcortical WM fibres in healthy adults, using quantitative Magnetization Transfer to assess myelination. The results shows that GM myeloarchitectonic is reflected in the underlying WM in healthy adults.
Purpose
Variation of grey matter (GM) myelination in the human brain has been used in histology and more recently in vivo MRI to delineate and classify areas with different myeloarchitecture, identifying heavily myelinated cortical areas (primary area) such as V1 and V5 area in the visual cortex. The white matter (WM) tracts connecting these primary area are believed to be myelinated more heavily during the development of the brain, while the corresponding cortical ribbon is thinning1. The aim of this study is to estimate the correlation between myelination in the cortical ribbon and the underlying subcortical WM fibres in healthy adults.Methods
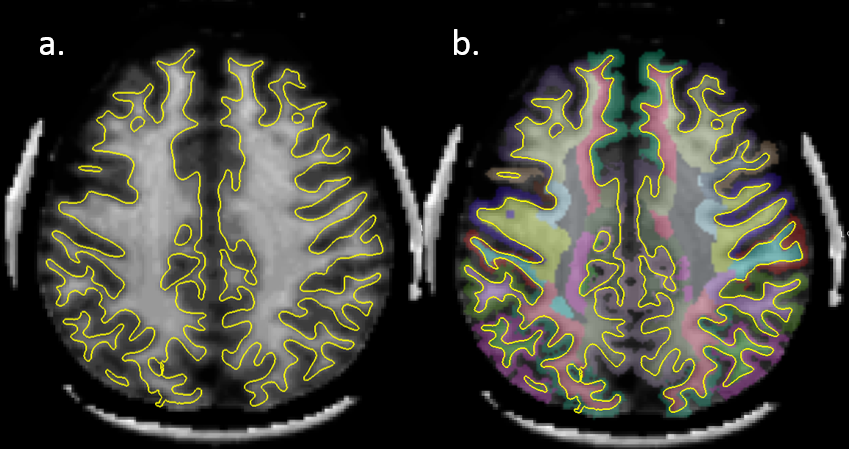
58 healthy volunteers (39 ± 12 years old, 27 male) gave written informed consent to participate in this study approved by the Ethics Committee. MRI data were collected using a Philips Achieva 7T system. A T1-weighted image, based on the Phase Sensitive Inversion Recovery sequence (PSIR; FOV = 240x216x160mm3, 0.8mm isotropic resolution, TI1/TI2=780ms/1600ms), was acquired and used for segmentation, T1 mapping and MEG coregistration. MT data was acquired using an MT-TFE sequence (saturation train: 20 gaussian-windowed sinc pulses, BW=200Hz, 17 saturation frequency from -5kHz to 5kHz, B1rms values of 0.33, 0.65 and 1.09μT; acquisition: TE/TR/FA = 2.7ms/5.8ms/8°, FOV = 192x192x60 mm3, 1.5mm isotropic image resolution, low-high k-space acquisition and a SENSE factor (RL) of 2). Three z-spectra were acquired for each subject for the three saturation powers, and quantitative MT data was derived by fitting the three z-spectra to a Look-Up-Table database of simulated spectra, based on the Bloch-McConnell equations2. Automatic segmentation using freesurfer3, followed by iterative manual correction was performed for each individual. Cortical GM and adjacent subcortical WM was classified using the Desikan-Killiany atlas4, using a 5 voxels metric to assign WM a similar label to the closest GM region, as shown in Figure 1. Mean MT value was extracted for each region, for each participant. The modal value for each individual’s MT data was regressed from that individual’s regional values. Pearson correlation, measured across subjects, was used to quantify the relationship between MT values measured in Desikan-Killiany region pairs. A permutation test statistically assessed the relationship between each of the cortical regions (N=10000 permutations), and the resulting p-values were corrected for multiple comparison using the Benjamini and Hochberg procedure. Pearson correlation of MT with cortical thickness extracted via freesurfer, as well as pseudo T1 obtained from the PSIR were also tested. The data was additionally regressed for B1 effect, and regions with missing voxels were removed from further analysis.Results
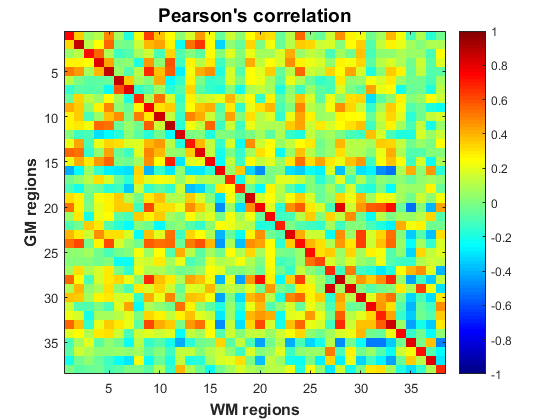
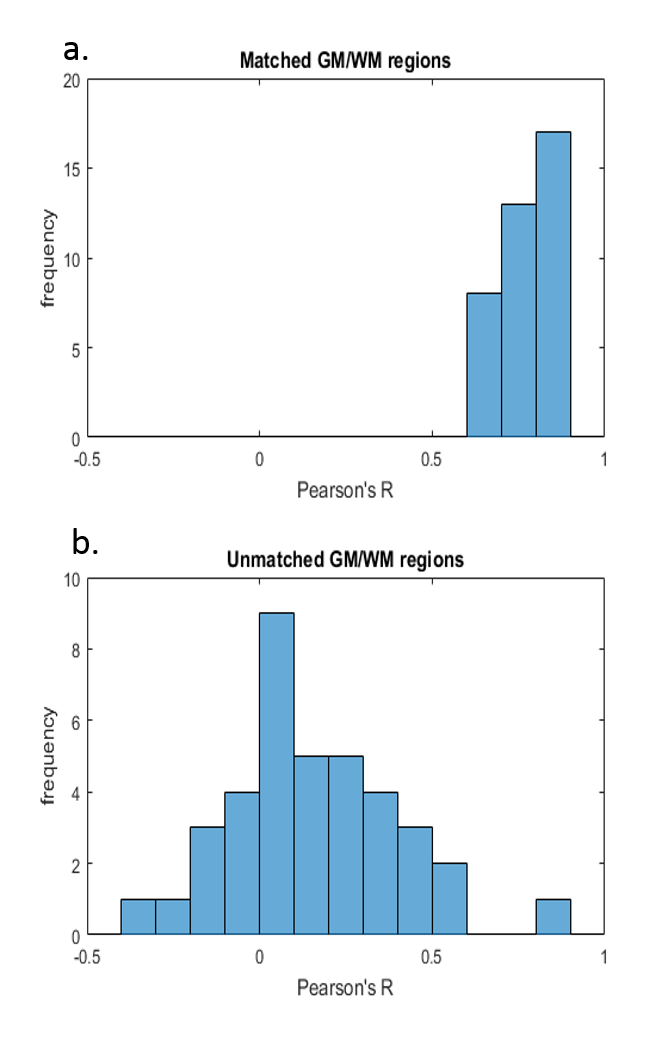
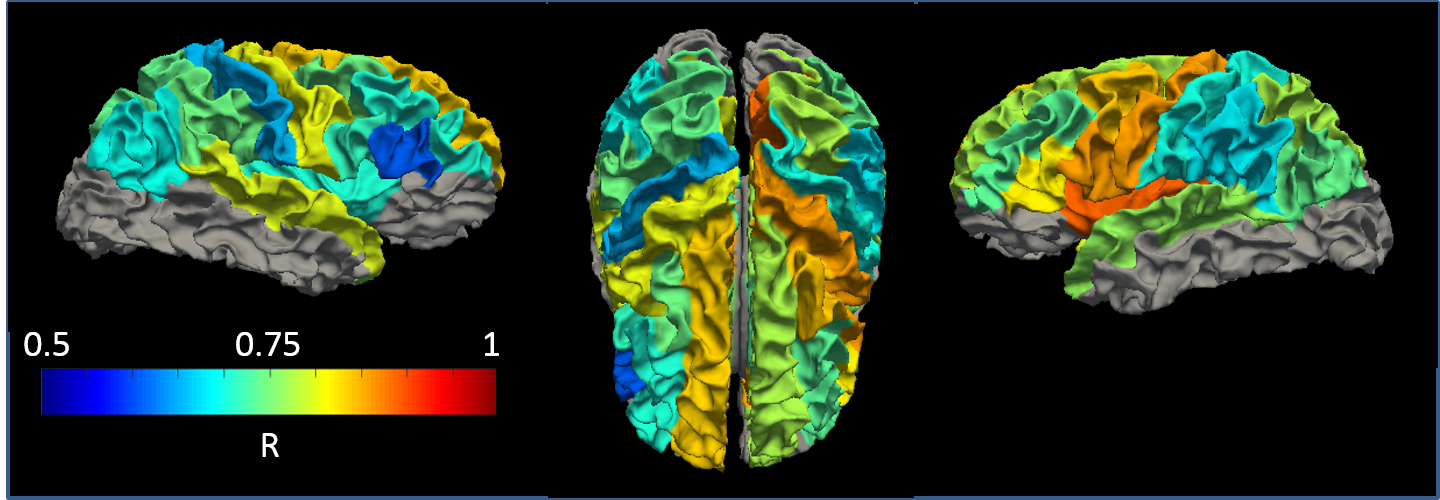
The MT in 19 GM regions per hemisphere were compared to the corresponding subcortical WM regions, and a strong correlation was found throughout the brain (mean R value of 0.76, figure 2). All regions had significant difference (p<0.05) between the permutation test and the original pair (figure 3 b and a), which persisted following multiple comparison correction. After regression of the B1 from the MT data, the significant difference remained in all regions. The average correlation remained strongly significant, with a mean R value of 0.72 between GM regions and adjacent WM regions, with variation from 0.61 in the parstriangularis right hemisphere, up to 0.88 in the precuneus left hemisphere, as represented in figure 4. No correlation could be seen between cortical thickness and MT either in WM or in GM (mean R value of respectively 0.01 and 0.04), while a moderate correlation (mean R value of 0.56) was found for the pseudo T1 between GM and subcortical WM.Discussion
Myelin content is highly correlated between the GM and underlying subcortical WM for the GM regions studied here. The cortical GM microstructure is highly specialised to the function needed, and myelination is a strong part of this specialization process. WM axonal myelination develop to support the GM activity and connectivity. WM myelination occurs throughout early childhood, with a recent study showing myelin water fraction increasing similarly in white and grey matter regions1. It would be interesting to repeat this analysis through childhood to observe the development of cortical and white matter myelination. The present study shows that MT is sensitive enough to measure variation of myelin throughout the brain in vivo, and present a new insight into regional specialisation of the brain.Conclusion
Myelination can be measured using quantitative MT. The results shows that GM myeloarchitectonic is reflected in the underlying WM in healthy adults.Acknowledgements
This work was funded by Medical Research Council (MRC) UK Partnership Grant, MR/K005464/1, MRC New Investigator Research Grant (MR/M006301/1), and MRC Doctoral Training Grant, MR/K501086/1.References
1: Croteau-Chonka et al. Examining the relationships between cortical maturation and white matter myelination throughout early childhood. Neuroimage 2016: 125: 413-421
2: Geades et al. Quantitative Z-spectrum Analysis of the Healthy Human Brain at 7T. Magn Reson Med. 2016, Early View.
3: Salat et al. Regional white matter volume differences in nondemented aging and Alzheimer's disease, Neuroimage 2009: 44, 1247-1258
4: Desikan et al. An automated labeling system for subdividing the human cerebral cortex on MRI scans into gyral based regions of interest. NeuroImage 2006: 31, 968–980
Figures