4693
Inter-individual variability in rapid eye movement sleep is associated with brain white matter structureShuqin Zhou1, Qihong Zou2, Jing Xu2, Jiahui Deng3, Zihui Su2, Tianyi Qian4, Thomas Beck5, Changwei Wu6, Hongqiang Sun3, and Jia-Hong Gao2
1Department of Biomedical Engineering, Peking University, Beijing, People's Republic of China, 2Center for MRI Research and Beijing City Key Lab for Medical Physics and Engineering, Peking University, Beijing, People's Republic of China, 3Sixth Hospital, Peking University, Beijing, People's Republic of China, 4MR Collaborations NE Asia, Siemens Healthcare, Beijing, People's Republic of China, 5Application Development, Siemens Healthcare, Erlangen, Germany, 6Graduate Institute of Humanities in Medicine, Taipei Medical University, Taipei, Taiwan
Synopsis
Previous animal studies indicated that sleep is important for cell membrane and myelin maintenance in the brain. Research further suggests that variability in sleep structure may be associated with brain white matter microstructure. In this study, we investigate the relationship between sleep structure parameters evaluated with polysomnography and brain white matter characteristics, as measured by MR diffusion tensor imaging. We find that inter-subject variability of regional white matter characteristics may explain the differences in sleep structure across participants.
Introduction
Despite the known importance of sleep for the brain, we know relatively little about the relationship between sleep and the brain. Previous animal studies indicate that sleep plays an important role in cell membrane and myelin maintenance in the brain. Animal studies also indicate that insufficient sleep can alter synaptic plasticity, resulting in altered transcription during protein synthesis 1, 2. Moreover, evidence from high density EEG studies show that sleep can influence neural function, memory formation, executive function, and emotion 3. Specifically, rapid eye movement (REM) sleep plays a key role in facilitating memory consolidation, learning, and emotional regulation 3. In this study, we investigated the relationship of sleep structure parameters with brain white matter characteristics, measured by diffusion tensor imaging (DTI). DTI indices of white matter microstructure are sensitive to axonal membrane and myelin alteration. While sleep may not induce neural changes in white matter immediately, an individual’s sleep structure may produce cumulative effects on neuronal integrity, and impact microstructure.Methods
Participants
Fifty right-handed healthy adults (age 22.3 ± 2.8 years, 25 females and 25 males) participated in the study. Participants followed a regular sleep schedule during the two weeks preceding data collection, as verified by actigraphy and sleep diary.
Polysomnography (PSG) recordings and sleep structure analysis
All participants underwent a complete night of PSG sleep monitoring. The monitoring started at each participant’s usual bedtime. Sleep stage scoring was performed visually by a licensed technician according to the standard criteria 4. All participants were asked to refrain from alcohol and caffeine on the days of the experiment. Sleep structure was evaluated as percentage of the time duration of each sleep stage to that of total sleep time, denoted stage 1 (N1p), stage 2 (N2p), stage 3 (N3p) of Non-REM sleep, and REM (REMp).
DTI data acquisition and analysis
The DTI data were acquired on a MAGNETOM Prisma 3T MR Scanner (Siemens, Erlangen Germany). Each participant underwent two DTI scanning sessions. One session took place two hours before participants’ usual bedtime. The second session took place half to one hour after the participant woke up the next morning. PSG was used to monitor sleep between the two scanning sessions. DTI was acquired using a prototype simultaneous multi-slice diffusion sequence with the following parameters: 64 directions, TR/TE = 3800/70 ms, matrix size = 112×112, FOV = 224×224 mm2, 70 slices, slice thickness = 2 mm without gap, and slice acceleration factor = 2. Each DTI scanning consisted of 138 volumes, with 10 repetitions at b = 0 s/mm2 and 2 repetitions at b = 1000 s/mm2 for each direction. FMRIB Software library (FSL) 5 was used for DTI data analysis. Processing steps included correction of eddy current distortions, correction of motion artifacts, and computation of DTI-related indices, i.e., fractional anisotropy (FA), mean diffusivity (MD), and radial diffusivity (RD).
Statistical analysis
Voxel-wise statistical analysis of all DTI-related indices was carried out using tract-based spatial statistics (the skeleton’s threshold was FA > 0.2) 6. No significant differences in DTI indices were observed between the two scanning sessions, and the correlations between the morning session and sleep structure parameters were calculated. The relationship between sleep structure parameters (N1p, N2p, N3p and REMp) and DTI indices (FA, MD and RD), with gender and age as covariates, was tested using randomise method with 5000 permutations. The statistical results were corrected using a threshold-free cluster-enhanced clustering method (FWE corrected, P < 0.05).
Results
As shown in Figure 1, REMp was positively correlated with MD in the left anterior corona radiate. REMp was positively correlated with RD in the genu and body of the corpus callosum, the precentral gyrus white matter and the superior corona radiate (Figure 2). The scatter plots demonstrated the positive correlation patterns between white matter characteristics and REMp (Figure 3). No significant correlations were observed between FA and sleep structure characteristics. In addition, no significant correlations were observed between white matter indices and N1p, N2p or N3p.Conclusions
We compared PSG and DTI to investigate the relationship between sleep structure parameters and brain white matter structure. We found a significant positive correlation between REMp and MD in the left anterior corona radiate, and between REMp and RD mainly in the genu and body of corpus callosum. These results provided a possible structural substrate underlying inter-individual variability in REMp, which may shed light on the neurobiological mechanisms of various sleep disorders such as REM sleep behavior disorder.Acknowledgements
This work was supported by the National Natural Science Foundation of China (81430037, 31421003, 81227003, 81671765 and 81571025) China’s National Strategic Basic Research Program (973) (2015CB856400, 2012CB720700), and Beijing Municipal Science & Technology Commission Z161100002616006 and Z161100000216152.References
1. Mirescu C, Peters JD, Noiman L, Gould E, Sleep deprivation inhibits adult neurogenesis in the hippocampus by elevating glucocorticoid. Proceedings of the National Academy of Science USAA. 2006; 103.
2. Kopp C, Longordo F, Nicholson JR et al., Insufficient sleep reversibly alters bidirectional synaptic plasticity and NMDA receptor function. The Journal of Neuroscience. 2006; 26.
3. Siegel JM, Clues to the functions of mammalian sleep. Nature. 2005; 437.
4. American Academy of Sleep Medicine, The AASM Manual for the Scoring of Sleep and Associated Events: Rules, Terminology and Technical Specifications. Westchester, IL. 2007.
5. Smith SM, Jenkinson M, Woolrich MW, et al., Advances in functional and structural MR image analysis and implementation as FSL. Neuroimage. 2004; 23.
6. Smith SM, Jenkinson M, Johansen-Berg H, et al. Tract-based spatial statistics: voxelwise analysis of multi-subject diffusion data. Neuroimage. 2006; 31.
Figures
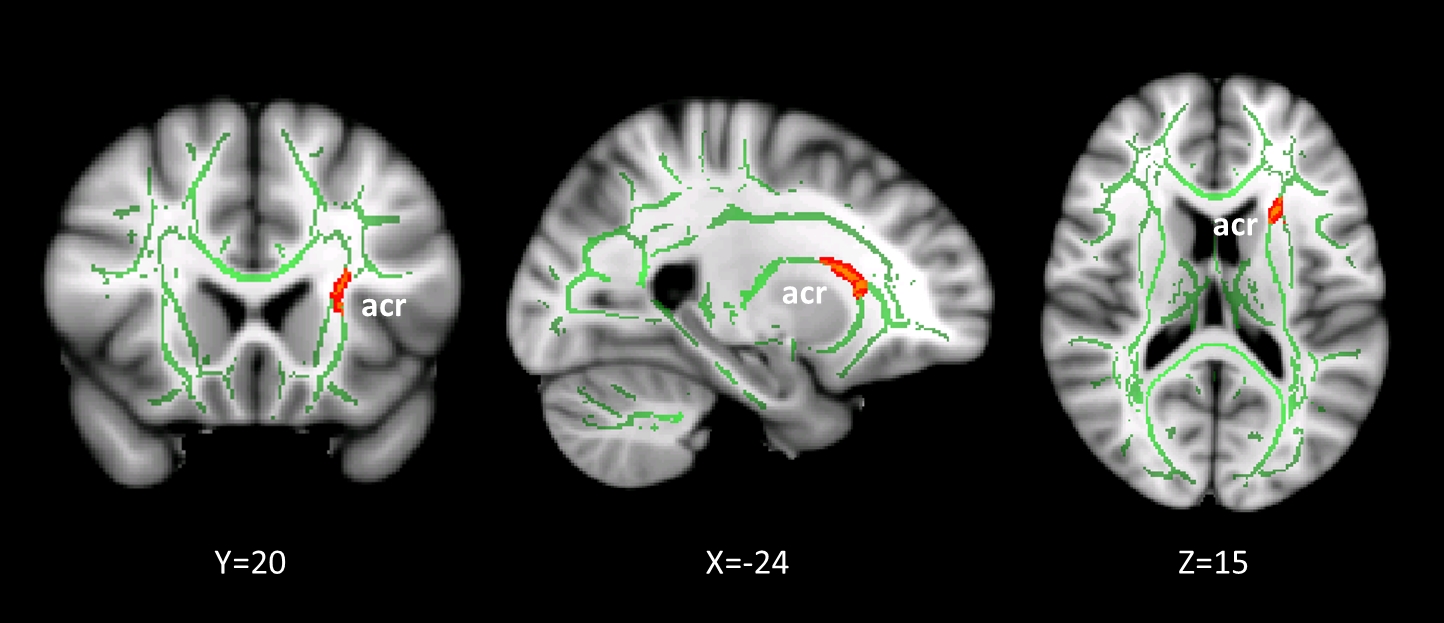
Figure 1: Correlation between REMp and MD with tract-based analysis for the whole WM tracts. Underlying gray scale images are the Montreal Neurologic Institute 152 T1 template. Regions in green represent the mean white matter skeleton. Regions in red-yellow show the cluster with MD positively correlated with REMp (FWE corrected P < 0.05). acr represents anterior corona radiate.
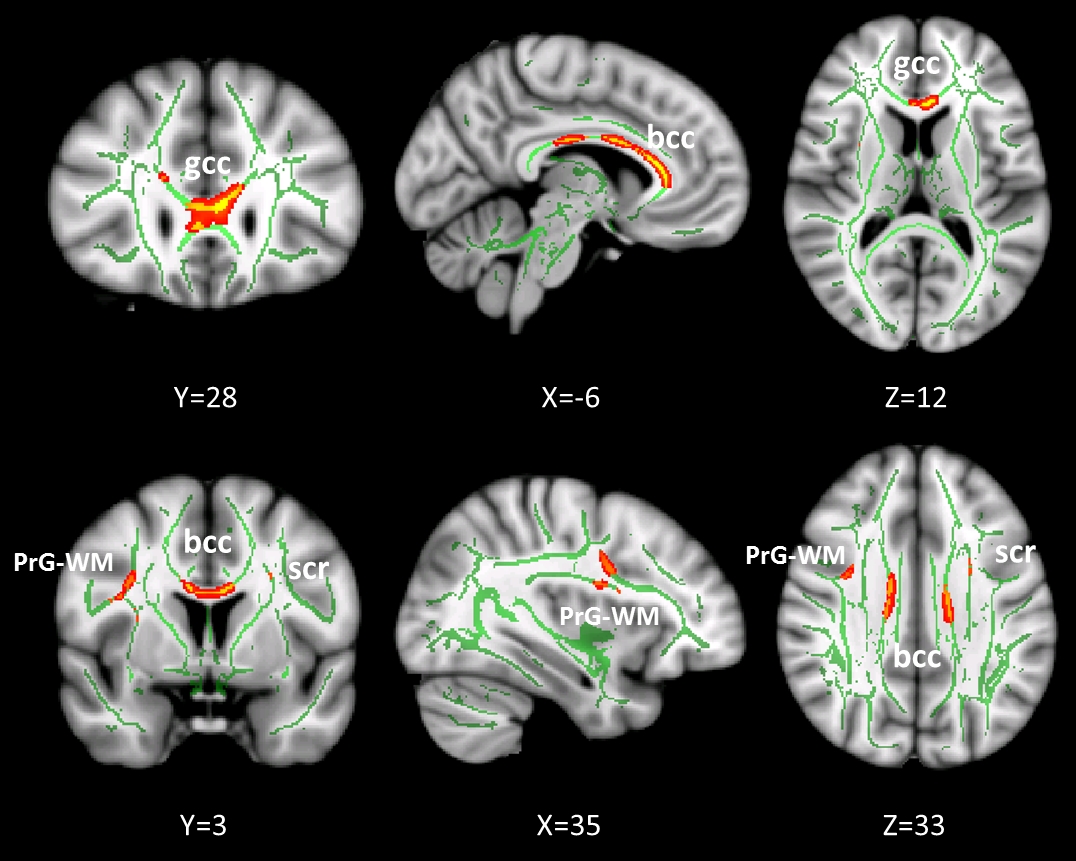
Figure 2: Correlation between REMp and RD. Underlying gray scale images are the Montreal Neurologic Institute 152 T1 template. Regions in green represent the mean white matter skeleton. Regions in red-yellow show the clusters with RD positively correlated with REMp (FWE corrected P < 0.05). gcc represents genu of the corpus callosum, bcc represents body of the corpus callsum, PrG-WM represents precentral gyrus WM, scr represents superior corona radiate.
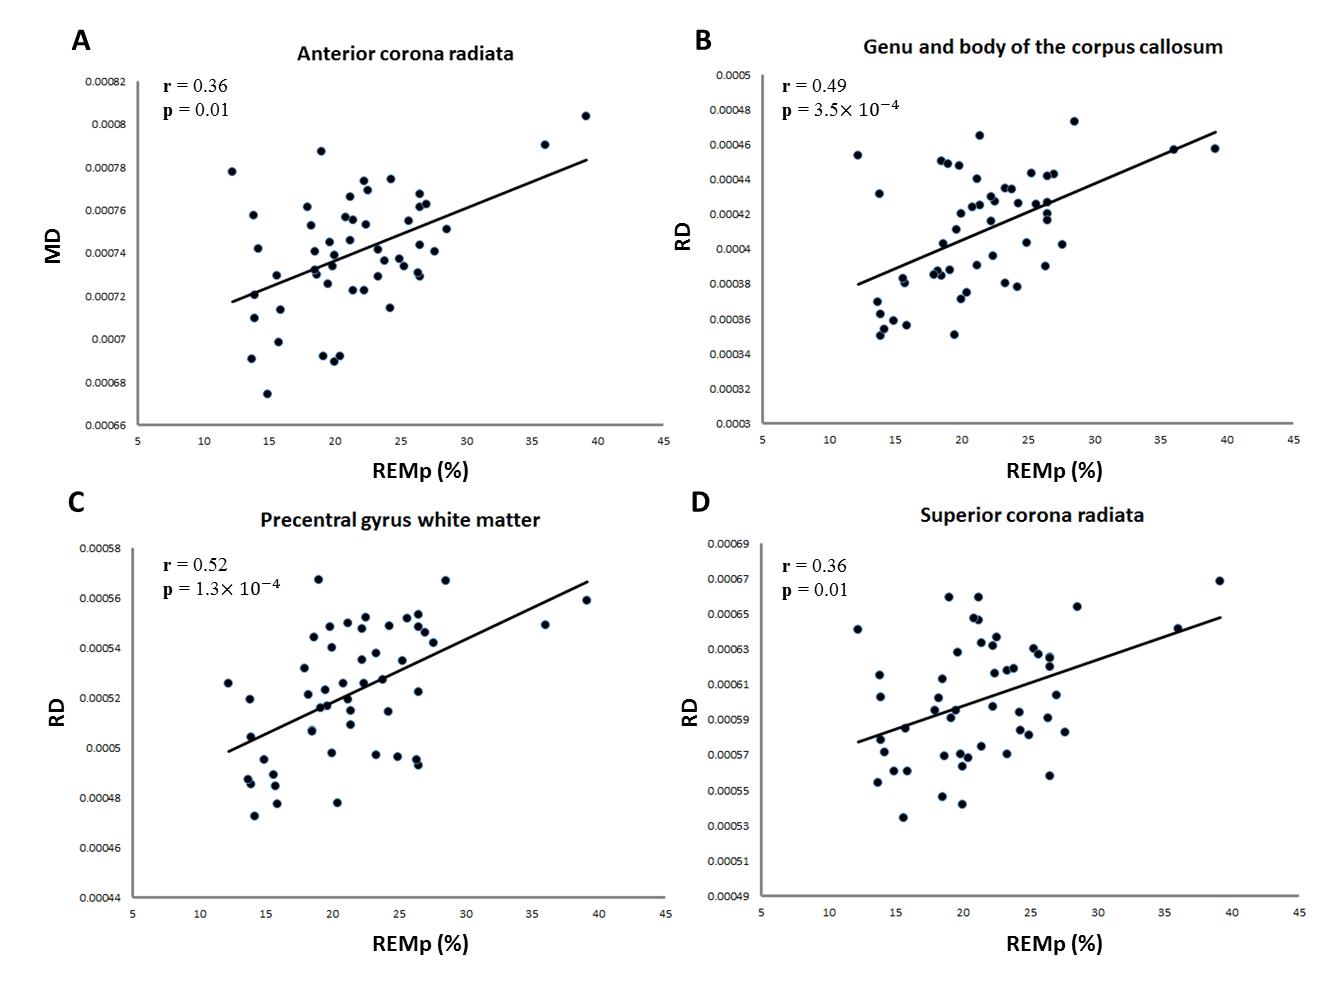
Figure 3: Scatter plot between mean MD in the cluster of Figure 1 and REMp (A). Scatter plots between mean RD in the clusters of Figure 2 and REMp (B, C, D).