4691
Measuring Transcortical Vasculature with Ultra-high Field (7T) MRI1Radiology and Radiological Sciences, Vanderbilt University Medical Center, Nashville, TN, United States, 2Psychology, Vanderbilt University, Nashville, TN, United States
Synopsis
Direct visualization of intracortical vascular structure holds promise for detection of pathologic conditions currently invisible with conventional clinical MRI. However, imaging of these structures with MRI has been rare, and no validation of the technique has been performed. Here, we use 7T SWI to directly image intracortical vasculature on the microscopic scale with the goal of understanding the within and between subject variance. We found intracortical vascular measurements were reproducible within subjects and were sensitive to between subject variability, indicating that the measurements may be useful as a biomarker of disease processes affecting vasculature within the cortex.
Introduction
Vascular imaging has proven to be exquisitely sensitive to a wide variety of disease processes, though current methods have suffered significant limitations in the portion of the vasculature they are capable of measuring. MR angiography and veinography are typically only sensitive to vessels measuring more than a millimeter in diameter. Vessel size imaging has the ability to make measurements of average vessel size, though only over course voxel volumes associated with diffusion and perfusion imaging techniques. Here, we present for the first time a quantitative assessment of very high resolution susceptibility weighed images (SWI) acquired at 7T for the explicit purpose of assessing its ability to measure transcortical microvasculature in vivo. If proven, this may represent a new biomarker for disease processes at the microscopic scale and currently invisible with conventional in vivo MRI.Methods
Subjects
11 healthy male subjects were imaged in accordance with local IRB approval in a whole body 7T MRI scanner. Two subjects were removed due to excessive motion.
SWI image acquisition
In each subject, six T2*weighted images were acquired as separate and independent acquisitions using slice selective gradient echo acquisitions with the following parameters: FOV=240x180.194x21.9mm, vox.dim.=.194x.194x1mm, #sl/gap=20/0.1mm, TR=’shortest’ (878.8 ± 8.29ms), TE=’shortest’ (27.5 ± 0.31ms),water/fat shift=27.26pix, flip=55deg, flow compensation = ‘yes’, duration=9min 11 ± 5.2sec. Images were acquired with a 1D phase navigator prior to image acquisition to correct for phase errors arising from respiration during acquisition (Versluis et al., 2010). This acquisition was repeated 5 times in all subjects.
Image processing
Susceptibility weighted images were generated for each individual acquisition (Haacke et al., 2004) and were corregistered using SPM12 (http://www.fil.ion.ucl.ac.uk/spm/) and averaged. For each subject, two regions of interest (ROIs) were drawn manually within the right and left central gyrus, guided by MNI and AAL atlas labels in individual subject space (Tzourio-Mazoyer et al., 2002). The inner and outer cortical surfaces within each ROI were traced for each subject and used as input for microvascular mapping.
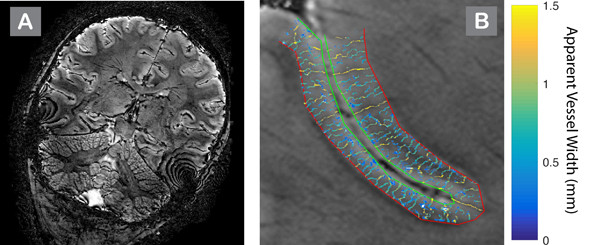
Vascular maps were calculated for each subject within each ROI by localizing local minima along intermediary contours parallel to the inner and outer cortical surfaces of each ROI. The width of the vessel at each minimum was estimated as the FWHM of the minima’s trough spanning from the minimum to its nearest maximum in each direction.
Within and Between Subject Reproducibility
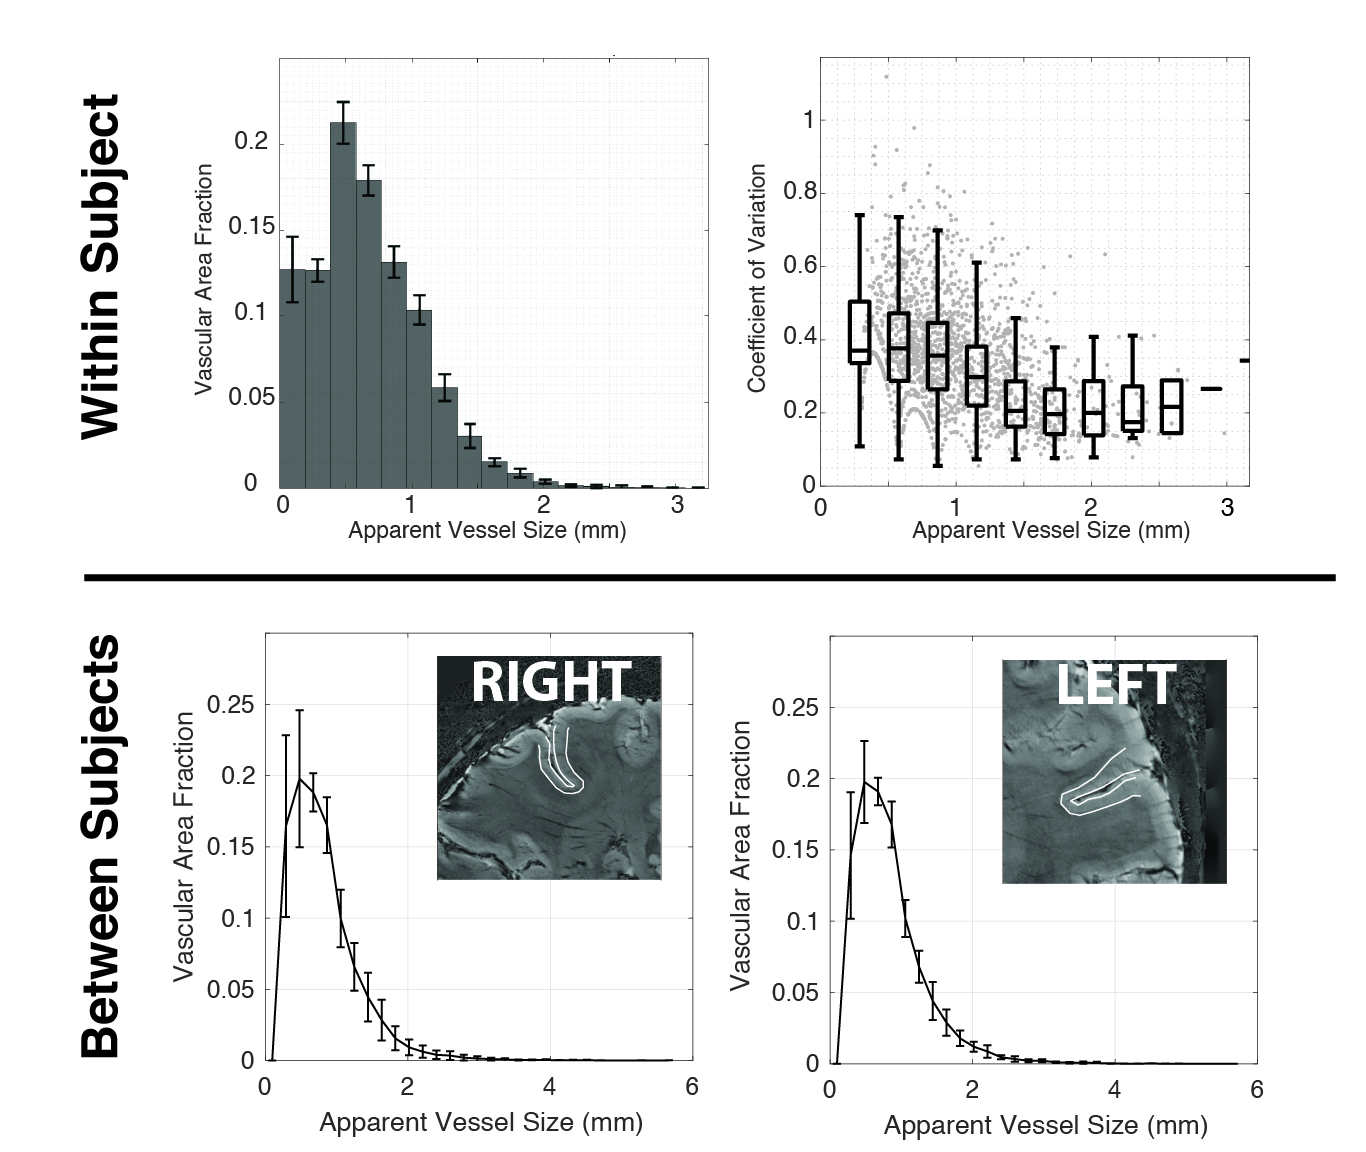
To estimate within subject reproducibility, a bootstrap analysis of the six available SWI images for each subject was performed. For each subject, average SWI images were calculated using all possible unique combinations of three SWI acquisitions, yielding 20 unique combinations per subject. On each of the average images, microvascular maps were calculated, and the distribution of vessel sizes across vascular voxels was measured. Voxels were defined as belonging to a vessel if they were identified as such in 75% of available images.
To assess variability of microvascular measurements across subjects, the vascular distribution as a function of vessel size was measured in both ROIs for each subject using the average of all six SWI acquisitions.
Results
In all subjects, transcortical microvessels were visualized throughout the cortex (see Figure 1 for an example). Within subject reproducibility tests showed that there was no significant difference (p=0.248) between vascular distributions across bootstraps (Figure 2, top left), assessed by the mean of Wilcoxon signed rank test statistics between all 10 independent pairs of average images (i.e. pairs of average images, where each average image arises from independent sets of underlying raw images). Furthermore, the error in the measurement increased as measured vessel width became small as would be expected (Figure 2, top right). Between subject analysis of the vascular distribution in each ROI showed all subjects displayed a Poisson distribution for the measured vasculature (Figure 2, left and right) that was significantly different across subjects (Kruskal-Wallis p<0.001 for both left and right), indicating that variability in vascular distribution within the same ROI may also be sensitive as a biomarker of differences between individuals.Conclusions
We have shown that transcortical microvasculature may be reliably measured in vivo using very high resolution 7T SWI. We have shown agreement between multiple images gathered within the same subject, and have measured differences between the distribution across subjects, suggesting that this measure may be sensitive individual differences across subjects. This yields promise that such measurements may be useful as biomarkers for diseases and other processes affecting microvasculature in the cortex.Acknowledgements
NSF awards: SMA-1640681, SBE-0542013References
Haacke, E.M., Xu, Y., Cheng, Y.C., Reichenbach, J.R., 2004. Susceptibility weighted imaging (SWI). Magn Reson Med 52, 612-618.
Tzourio-Mazoyer, N., Landeau, B., Papathanassiou, D., Crivello, F., Etard, O., Delcroix, N., Mazoyer, B., Joliot, M., 2002. Automated anatomical labeling of activations in SPM using a macroscopic anatomical parcellation of the MNI MRI single-subject brain. Neuroimage 15, 273-289.
Versluis, M.J., Peeters, J.M., van Rooden, S., van der Grond, J., van Buchem, M.A., Webb, A.G., van Osch, M.J., 2010. Origin and reduction of motion and f0 artifacts in high resolution T2*-weighted magnetic resonance imaging: application in Alzheimer's disease patients. Neuroimage 51, 1082-1088.
Figures