4690
Gender Dimorphism in Cerebral White Matter Architecture: Insights from Diffusion Spectrum Imaging and Whole Brain Echo-Planar Spectroscopic Imaging1Department of Radiation Medicine, Hokkaido University, Sapporo, Japan, 2Global Station for Quantum Medical Science and Engineering, Sapporo, Japan, 3Department of Rehabilitation, Hokkaido University, Sapporo, Japan, 4Siemens Health Care, Japan, 5Siemens Health Care, San Francisco, CA, United States, 6Department of Nuclear Medicine, Hokkaido University, Japan
Synopsis
Gender dimorphism in white matter architecture was evaluated by using DSI and whole brain EPSI. Several white matter areas revealed gender differences in the major DSI indices, of which some area had gender difference in NAA/Cr.
Background and Purpose
The cerebral white matter is a complex structure composed mainly of highly organized white matter fiber bundles. Previous studies have reported gender dimorphism in the cerebral white matter volume, its asymmetry, stiffness as assessed by MR elastography, and regional fractional anisotropy (FA) values as assessed by diffusion tensor imaging (DTI)1, 2. FA has been regarded as sensitive to minute alterations in white matter integrity, but is subjected to errors especially at fiber crossing or kissing points -- owing to the assumption of ellipsoid model of diffusion by DTI. Recent improvements in the MR gradient systems and development of simultaneous multislice acquisition schemes have allowed acquisition of diffusion spectrum imaging (DSI) in acceptable scan time3. This study aimed to evaluate gender dimorphism of the cerebral white matter by using DSI. To promote the understanding of underlying processes occurring in the cerebral white matter microstructure, areas which revealed gender differences were further evaluated for differences in the regional metabolite concentrations by using echo-planar spectroscopic imaging (EPSI).Methods
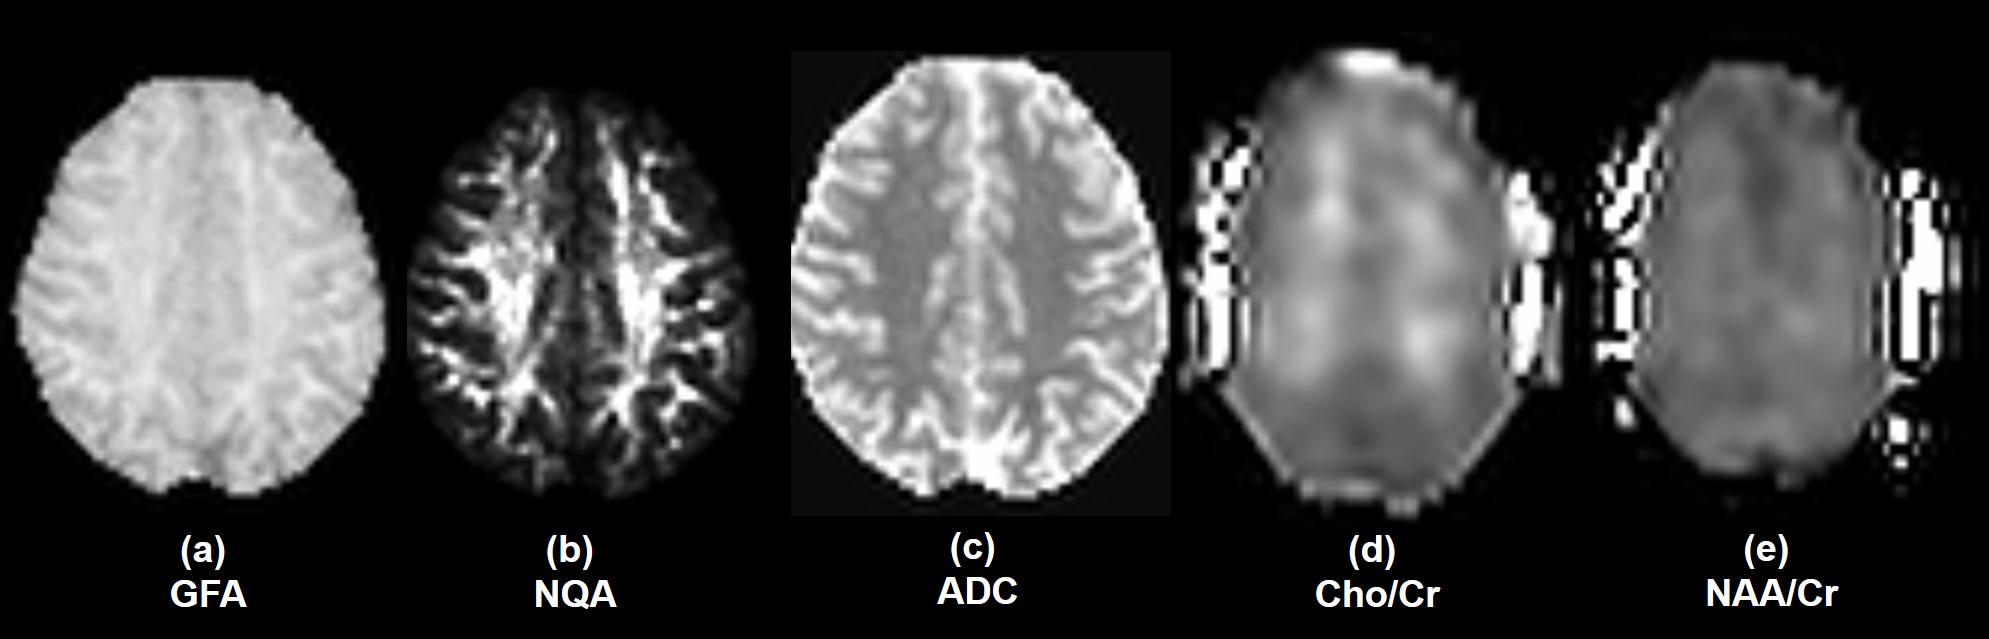
This prospective study included 28 normal subjects (15 men and 13 women; age range = 21 – 63 years). Age of the subjects was matched between the two gender groups. MRI was performed using a 3T scanner (MAGNETOM Prisma, Siemens Health Care, Erlangen, Germany) and a 64-channel head coil. A 2D spin-echo multiband echo-planar imaging sequence was used to acquire whole brain DSI (TR/TE = 4000/100 ms, the maximum b-value = 8000 s mm-2, number of diffusion gradient directions = 256, multiband factor = 2, voxel size = 2.5 x 2.5 x 2.5 mm) and volumetric spin-echo echo -planar sequence was used to acquire whole brain EPSI (TR/TE = 1710/17 or 70 ms, number of complex points = 512, bandwidth = 613Hz, voxel size = 5.6 x 5.6 x 10 mm3). The maps of major DSI indices -- generalized FA (GFA), normalized quantitative anisotropy (NQA), apparent diffusion coefficient (ADC), were reconstructed from DSI (DSI Studio4); and N-acetyl aspartate (NAA)/Creatine (Cr) and Choline (Cho)/Cr maps were reconstructed from EPSI (MIDAS5). The maps were then normalized to a standard stereotactic space (MNI). Variations in the normalized GFA, NQA, and ADC between the two gender groups were evaluated voxel-by-voxel, using two sample t-tests. Uncorrected P<0.001 was set to determine statistical significance. Voxels with significant differences in the major DSI indices were then extracted, and superimposed onto the normalized NAA/Cr and Cho/Cr maps. Any association with changes in the regional metabolite concentration was then evaluated, using two sample t-tests. For this purpose, P<0.05 was considered significant.Results
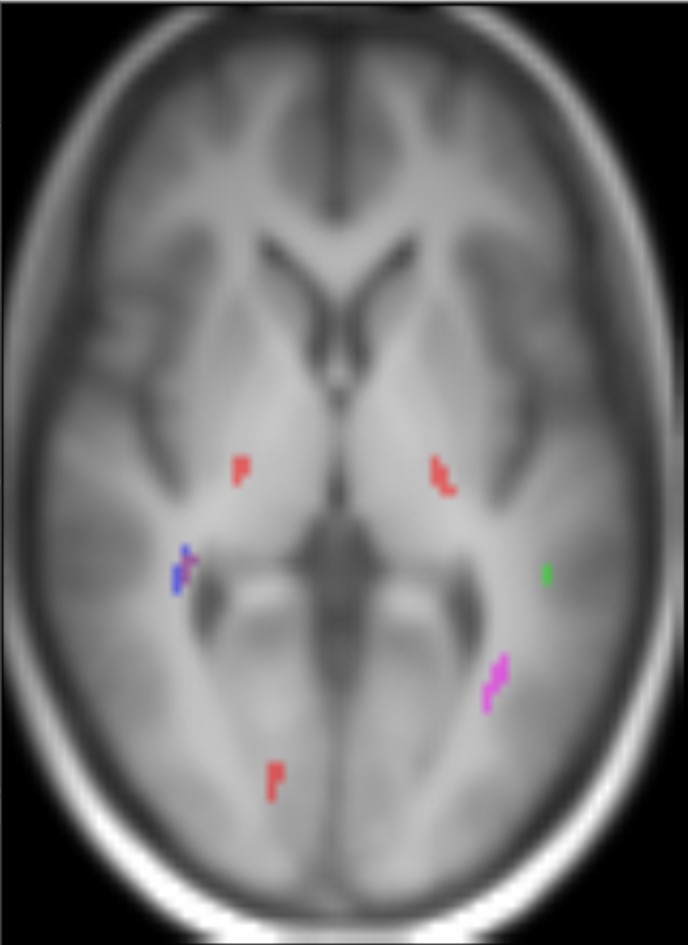
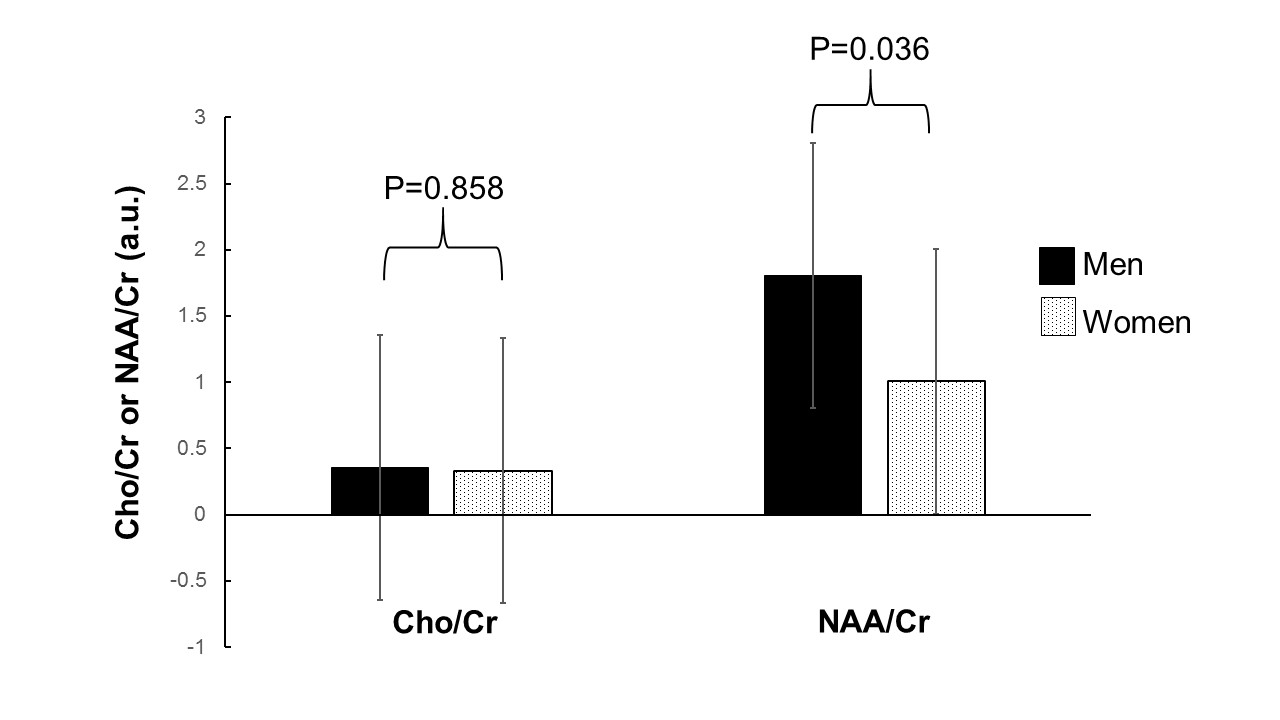
The representative maps of DSI and EPSI are shown in Fig 1. Clusters with significantly higher GFA values, compared to the opposite gender group, were observed in the bilateral posterior limbs of internal capsule, bilateral peritrigonal white matter, left cerebral peduncle, and right occipital white matter of women subjects and the right parietal subcortical white matter of men (Fig 2). Clusters with significantly higher NQA values were observed at the right peritrigonal white matter and left cerebral peduncle of women. Those with significantly higher ADC values were observed in the left temporal and right occipital white matter of women and right parietal subcortical and bilateral peritrigonal white matter of men. EPSI showed significantly higher NAA/Cr in women, in areas which revealed higher GFA values for that gender group (Fig 3). No significant differences in the metabolite concentrations were observed in the other areas.Discussion
Our observation of gender-related differences in the GFA and NAA/Cr may indicate gender difference in axonal pruning associated with brain maturation or degeneration6. Variation only in the major DSI indices without variation in the major metabolite concentration may suggest that the DSI indices are more sensitive to gender differences than the metabolite concentrations.Conclusions
The knowledge of gender differences in the major DSI indices and metabolite concentrations is essential in interpreting the imaging findings, in both physiological and pathological states.Acknowledgements
The authors wish to thank Drs. Andrew Maudsley, Sherriff Ahmed Sulaiman, and Essa Yacoub for technical support and provision of software. This study was supported by the Global Institution for Collaborative Research and Education (GI-CoRE), Hokkaido University.References
1. Arani A, Murphy MC, Glaser KJ, Manduca A, Lake DS, Kruse SA, Jack CR Jr, Ehman RL, Huston J 3rd. Measuring the effects of aging and sex on regional brain stiffness with MR elastography in healthy older adults. Neuroimage 2015;111:59-64.
2. Hsu JL1, Leemans A, Bai CH, Lee CH, Tsai YF, Chiu HC, Chen WH. Gender differences and age-related white matter changes of the human brain: a diffusion tensor imaging study. Neuroimage 2008; 39(2):566-77.
3. Xu J, Moeller S, Auerbach EJ, Strupp J, Smith SM, Feinberg DA, Yacoub E, Ugurbil K. Evaluation of slice accelerations using multiband echo planar imaging at 3 T. Neuroimage. 2013 Dec;83:991-1001.
4. DSI Studio. http://dsi-studio.labsolver.org/
5. MIDAS. http://mrir.med.miami.edu:8000/midas/
6. De Bellis MD, Keshavan MS, Beers SR, Hall J, Frustaci K, Masalehdan A, Noll J, Boring AM. Sex differences in brain maturation during childhood and adolescence. Cereb Cortex 2001; 11(6):552-7.
Figures