4689
Multi-modal characterization of white matter for studying language and hand motor function1Department of Radiology, The University of Tokyo Hospital, Tokyo, Japan, 2Radiology, Juntendo University School of Medicine, Tokyo, Japan, 3Siemens Japan K.K., Tokyo, Japan
Synopsis
We present a preliminary experience of a fiber g-ratio technique using a combination (MT_sat and NODDI) in multi-modal characterization of the white matter bundles relevant to language and hand motor function. Tract-specific analyses of the pyramidal tract, accurate fasciculus, and frontal aslant tract were performed using the tractography as volume of interest. The fiber g-ratio, MVF, AVF, and FA were measured, and differences between the the hemispheres and among the bundles were tested. This study suggested we can be more sensitive to the lateralities of these bundles by combining myelin imaging and diffusion.
Purpose
The fiber g-ratio (the ratio of the inner to
the outer diameter of a myelinated axon) is a biomarker for the conduction velocity of neural transmission. Models
linking quantitative magnetization transfer (qMT)1 and neurite
orientation dispersion and density imaging (NODDI) 2 parameters to
the fiber g-ratio have recently emerged3. Using the estimate from qMT as myelin volume fraction (MVF), and that from NODDI as the axon volume
fraction (AVF), the fiber g-ratio can be calculated by sqrt{1 / (1 + MVF /
AVF)}. In recent years, there have been an increasing number of reports using
this method to investigate the fiber g-ratio in normal aging4,5. However, qMT requires a long scanning time. On the other hand, MT_sat {similar to
Magnetization Transfer Ratio (MTR), but accounting for T1 effects}6
can provide MVF almost equivalent to qMT with a shorter scanning time7.
In this study, we present a preliminary experience of this combination (MT_sat and NODDI) in multi-modal characterization of the white matter bundles relevant to language and hand motor function.Materials and Methods
Ten right-handed men (mean age, 29.2 years; age range, 28–37 years)
participated in this study. All data were acquired on a 3T Siemens Skyra
scanner equipped with a 20-channel head coil, including two-shell
diffusion data (5 b=0 volumes, 30 directions with b = 1000 and 2000
s/mm2) optimized for NODDI, and MT_sat {Magnetization transfer weighted
image, Proton density weighted image, T1 weighted image,
and B1 map}. The spatial resolution was 2.5×2.5×2.5 mm3.
The scan time for NODDI and MT_sat was 18 min. Q-ball imaging (QBI) for tractography
(1 b=0 volume, 64 directions with b = 3000 s/mm2, 2.5×2.5×2.5 mm3),
functional MRI (fMRI) of each hand grasping movement (three-set mono block
design, 30-s intertrial interval, 60 trials, 3.0×3.0×4.0 mm3),
and 3D T1 weighted images (1.25×1.25×1.25 mm3) were also acquired. MT_sat were analyzed using in-house
software, which yielded a voxel-wise estimation of the MVF. The diffusion data were analyzed using the NODDI toolbox to yield maps
of vic and viso. Then, the fiber g-ratio was calculated from the
aforementioned equation, using AVF = (1-MVF)×(1- viso)×vic (Fig.1). Tract-specific analyses of the pyramidal tract (PT_hand), accurate fasciculus (AF), and frontal aslant tract (FAT) were performed using the tractography as volume of interest. The tractography of these bundles were reconstructed from the QBI. The seeds and targets for the AF and FAT were defined according to the established methods8, 9. For PT_hand, the hand motor area determined by the task fMRI was
used (Fig.2). The fiber g-ratio, MVF, AVF, and FA were measured, and differences between the the hemispheres and among the bundles were tested.
Results
The fiber g-ratio, MVF, AVF, and FA of the right/left PT_hand was 0.730/0.732, 0.371/0.365, 0.430/0.422, and 0.564/0.554, respectively. No significant differences were observed between the hemispheres. To the contrary, significant differences were observed between the hemisphere in the g-ratio and AVF of the AF and FAT (p<0.01). The g-ratio, MVF, AVF, and FA were 0.706/0.699, 0.384/0.388, 0.387/0.369, and 0.456/0.494 for AF, and 0.729/0.720, 0.313/0.322, 0.395/0.385, and 0.386/0.400 for FAT (Fig.3). No significant inter-hemisphere differences were observed in FA. The multi-modal comparison among the three bundles suggested difference of microstructural characters in the motor and language fibers. For example, AVF of the PT_hand was apparently larger compared to AF and FAT. AF had the smallest fiber g-ratio, resulting from the combination of relatively small AVF and large MVF. These trends were constant in both hemispheres.
Discussion and Conclusion
The present results demonstrated feasibility of multi-modal characterization of white matter bundles using the combination of MT_sat and NODDI. This combination enabled fiber g-ratio estimation with a clinically feasible scan time. The fiber g-ratio, MVF, and AVF in this study were comparable with a previous study using qMT5. In addition, the fiber g-ratio correlated with age in the same manner as the previous study5 (Fig.4), though the age range was relatively small (20–30 years) in this study.
In all three bundles, g-ratio gradually
increased with age. Multi-modal characterization of white matter bundles is expected to give us better insights into normal brain function and neurological disorders by depicting microstructural information relevant to function. Though the laterality of language function is widely recognized, FA of the AF and FAT (fibers relevant to the language pathway) did not significantly differ between the hemispheres, as previously reported10, 11. This study suggested we can be more sensitive to the lateralities of these bundles by combining myelin imaging and diffusion. The clinical relevance of the lateralities in fiber g-ratio and other metrics shown in this study needs to be further investigated.
Acknowledgements
We wish to thank Dr. Nikola Stikov for help of the MT_sat sequence and advice.References
1 Sled, J.G., Pike, G.B. Magn Reson Med, 2001. 46:923-931.
2 Zhang, H, et al. NeuroImage, 2012. 61(4); 1000-1016.
3 Stikov, N, et al. NeuroImage, 2015. 118: 397-405.
4 Dean, DC 3rd, et al. NeuroImage, 2016. 32: 225-37.
5 Cercignani, M, et al. Neurobiology of Aging, 2016.
6 Helms, G, et al. Magn Reson Med, 2008. 60(6); 1396-407.
7 Jennifer, SW Campbell, et al. 2016 ISMRM proceeding.
8 Catani, M. Thiebaut de Schotten M. Cotex, 2008. 44(8); 1105-32.
9 Catani, M, et al. Cotex, 2012, 48; 273-91.
10 Broce, I, et al. Brain Lang, 2015. 149: 66-76.
11 Psomiades, M, et al. NeuroImage: Clinical, 2016.
Figures
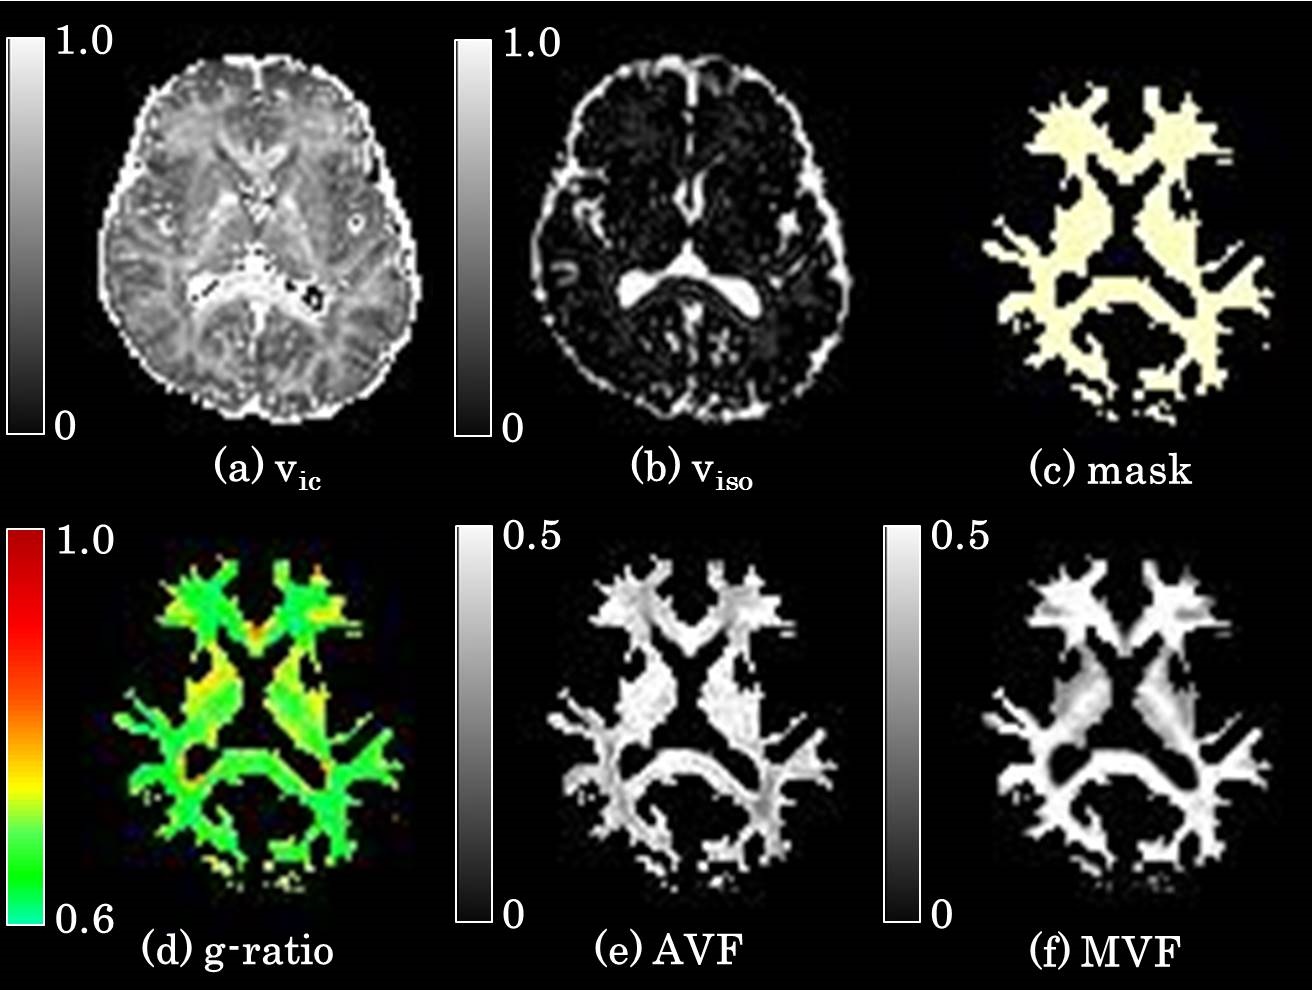
Fig.1. the g-ratio, MVF and AVF map.
The g-ratio, MVF and AVF were calculated using vic, and viso with the mask (segmented white matter from 3D T1WI using MATLAB and spm12).
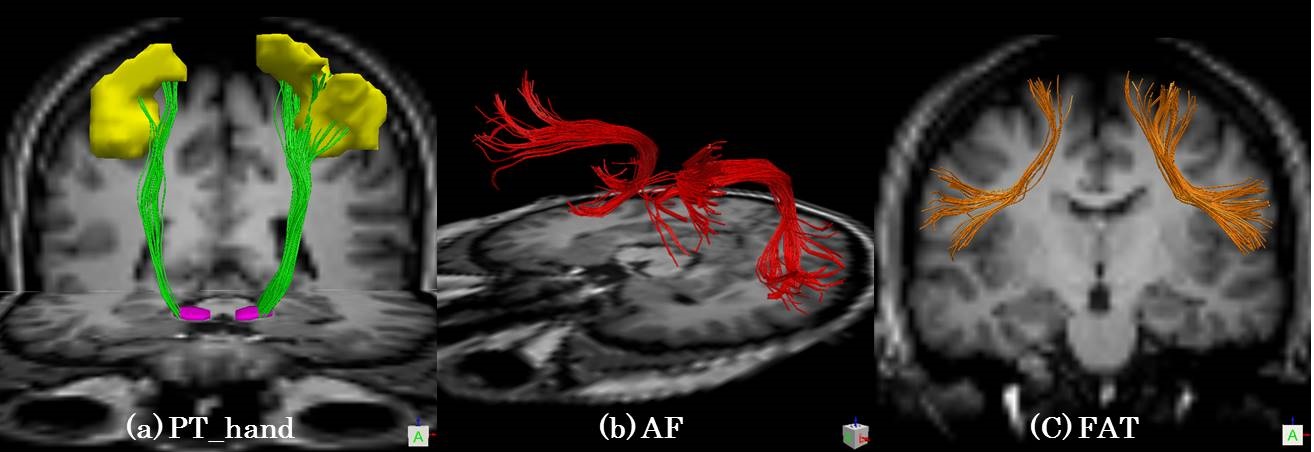
Fig.2. the depicted tractography.
(a) PT_hand was depicted using the region of interests that the activated area of fMRI and cerebral peduncle.
(b) AF was depicted using the region of interests that the posterior temporal stem, medial to the corona radiata, posterior to the precentral sulcus and anterior to the intraparietal sulcus on FA or color-FA map.
(c) FAT was depicted using the region of interests that the pre-supplementary motor area (pre-SMA), SMA and the posterior inferior frontal gyrus, pars opercularis on FA or color-FA map.
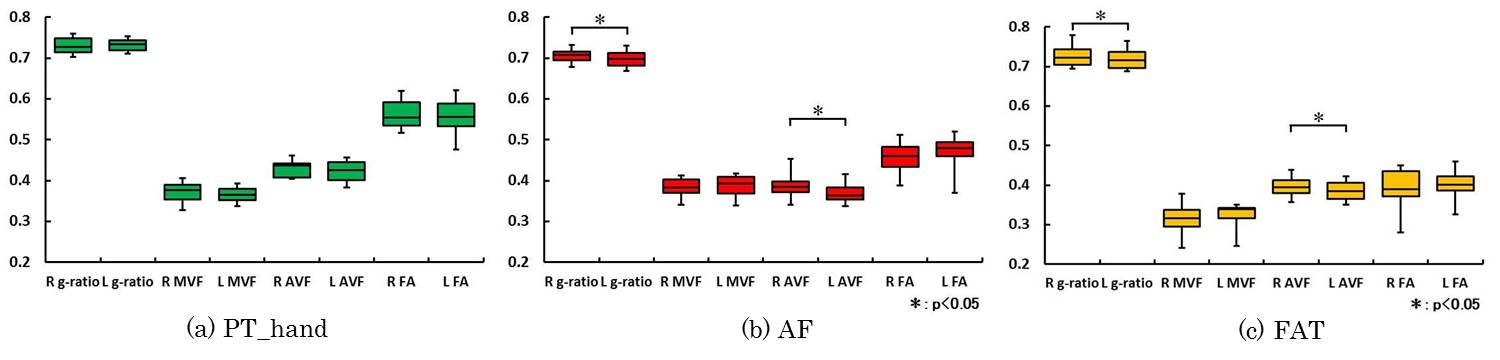
Fig.3. the result of the quantitative values.
(a) the box plots of PT_hand.
(b) the box plots of AF.
(c) the box plots of LAT.
Asterisk (*) indicates significant difference (p<0.05).
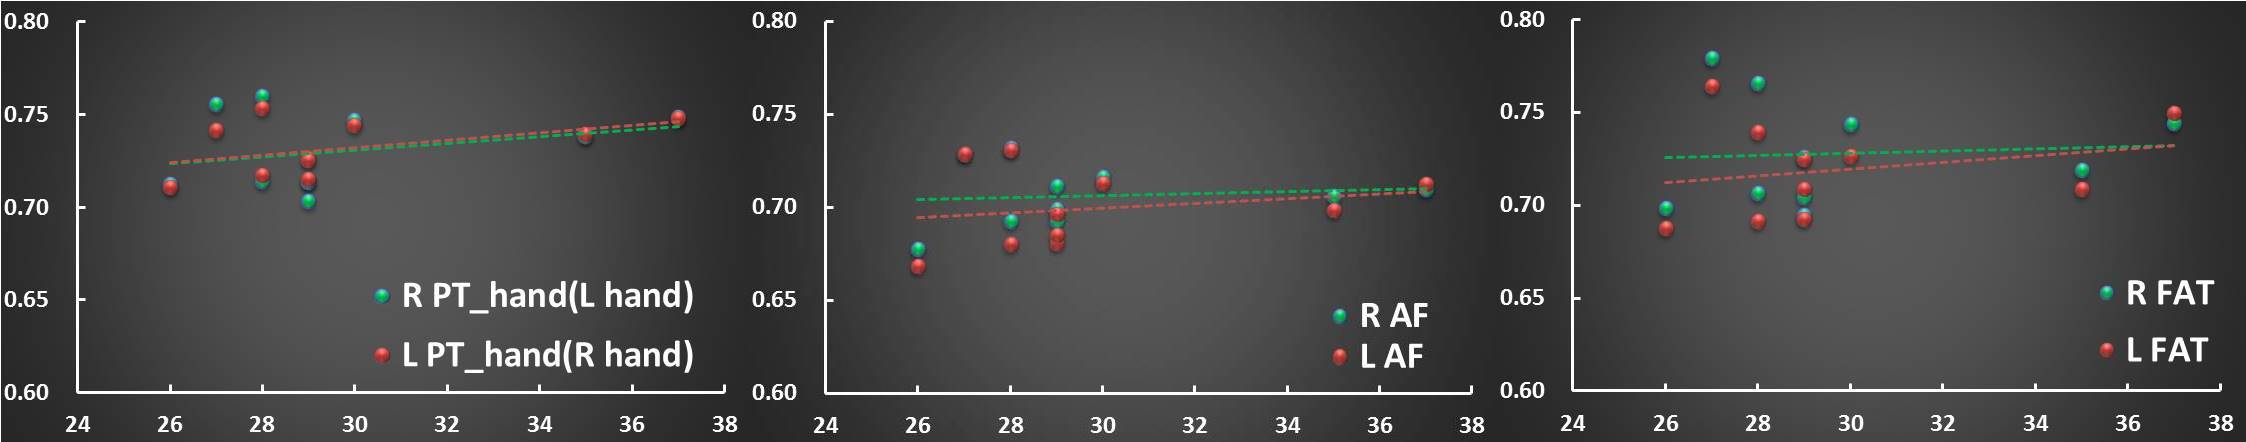
Fig.4. the relationship of the fiber g-ratio and age.
In the all fibers, fiber g-ratios gradually increased with age. X axis is the age and Y axis is the fiber g-ratio.