4686
Post-mortem and In Vivo Thalamic Nuclei Identification at 7T with Comparison to Histology1Sir Peter Mansfield Imaging Centre, University of Nottingham, Nottingham, United Kingdom, 2Department of Cellular Pathology, Nottingham University Hospitals NHS Trust, Nottingham, United Kingdom, 3School of Psychology, University of Nottingham, Nottingham, United Kingdom, 4Centre for Human Brain Health (CHBH), University of Birmingham, Birmingham, United Kingdom
Synopsis
The thalamus plays a major role in regulating the transfer of information through the brain and is also implicated in many neurodegenerative diseases. It is therefore crucial to improve our understanding of this key brain structure. Structural differentiation of thalamic nuclei in post-mortem 7T MRI was investigated. Thalamic sub-regions were identified in magnitude, R2*, R1 and magnetisation transfer ratio maps from six post-mortem brains. Edge detection, k-means clustering algorithms and thin-plate spline warping to the Morel atlas were used to systematically identify thalamic nuclei. These data showed good correlation with stained histological sections and in vivo MRI data.
Background
The thalamus is a crucial structure for multiple cognitive, motor and perceptual functions and several neurological disorders have been associated with thalamic abnormalities1. Thalamic regions are also increasingly being targeted for therapeutic intervention using deep brain stimulation. Understanding the structure and function of the thalamus is therefore of key importance. More than fifty thalamic sub-regions have been identified histologically post-mortem, but depiction of thalamic substructure in vivo using MRI has proved difficult due to the limited T1 and T2 contrast between different regions and the relatively low achievable spatial resolution at 1.5T and 3T2. The availability of high field (7T) scanners and a wider range of contrasts now opens up new possibilities for using MRI to probe thalamic anatomy.
This study aimed to determine whether post-mortem 7T MRI could be used to identify thalamic nuclei and involved comparison with histological data from the same brains, which is regarded the gold standard for nuclei definition.
Method
Six post-mortem brains were obtained with consent for research. After 1-5 months of fixation in formalin, the frontal cortex was removed and one cerebral hemisphere from each brain was placed inside a fomblin-filled, 16cm-diameter plastic sphere, and wedged in position with sponge blocks. Each brain was scanned over 11 hours on a 7T Philips MRI scanner, with high resolution gradient echo (GE) and lower resolution multi-echo GE, inversion recovery and magnetisation transfer (MT) sequences, detailed in Table 1.
Thalamic features were compared across axial, T2*-weighted images and R2*, R1 and magnetisation transfer ratio (MTR) maps, both in the raw image data and after k-means clustering. Canny edge detection was applied to these maps after histogram equalization so as to systematically delineate boundaries. Landmarks were then identified on these boundaries to allow registration to slices from the Morel3 atlas using thin-plate spline warping.
After scanning, one thalamus was sectioned coronally and stained using luxol fast blue (LFB) and synaptophysin to highlight thalamic substructure. Thalamic nuclei were identified on the histological sections by comparison with the Morel3 atlas.
The post-mortem MRI and histological images were also compared to in vivo images of three healthy volunteers, taken with a single GE sequence, as detailed in Table 1.
Results
Figure 1shows axial image data from the six post-mortem thalami. Five consistently observed sub-regions of the thalamus and two less consistently observed sub-regions are outlined in red and green respectively on the high-resolution T2*-weighted images. Only four regions were consistently identified in the R2* and R1 maps, and these displayed opposite intensities compared to the T2*-weighted images. The MTR maps showed four regions, with a smaller hypointense region visible inside a larger region in some thalami (red arrows).
Figure 2 shows the segmented images produced by applying k-means clustering (7 clusters) to histogram-equalized images from brain 4. Clustering generally highlighted the regions that were also detected visually, particularly on the T2*-weighted images and R2* maps. Warping the MRI data using landmarks identified from the Canny edge detection gave good correspondence with the atlas slices (Figure 2- right) which helped in identifying the smaller nuclei.
Figure 3 shows that the LFB and synaptophysin stained sections are in good correspondence with the coronal MRI scans, including the edge detection and k-means clustered data. Comparison to the atlas allowed the regions highlighted in the images to be identified. The centre median and anteroventral nuclei were particularly distinct.
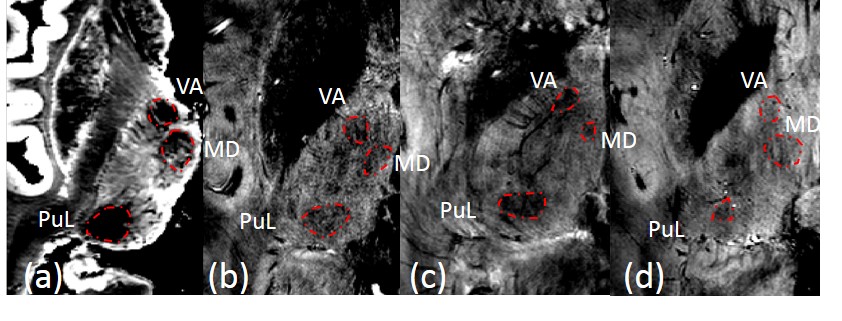
Figure 4 shows the lateral pulvinar, mediodorsal and ventral-anterior nuclei identified on post-mortem MRI were also visible on in vivo images, although the signal to noise ratio was lower than the post-mortem scans due to the restricted scanning time and subject movement.
Discussion
The consistently observed nuclei in the axial post-mortem MR images were identified as the pulvinar, mediodorsal, ventral-anterior, anteromedial and the band along the edge was identified as the lateral-posterior, ventral-lateral and ventral-posterior lateral nuclei.
Correlation of post-mortem MRI with histology allowed detection of multiple corresponding nuclei. The nuclei were identified by finding distinct boundaries or regional changes in intensity. The k-means clustering compared the Euclidean distance between intensity values incorporating spatial information, thus enabling distinction of boundaries and regional intensity levels. Joint segmentation of the different image modalities will now be investigated.
Such post-mortem histology/MRI correlations are important for understanding the contrast expected in vivo. Preliminary in vivo measurements suggest that some of the thalamic features identified post-mortem can also be seen in vivo, but other contrasts need to be explored.
Conclusion
The thalamic nuclei were consistently identified across different contrasts in post mortem images, and some of these structures could be identified in vivo.Acknowledgements
Financial support from the MRC and The University of Nottingham.References
1) Thomas Tourdias, Manojkumar Saranathan, Ives R Levesque, Jason Su, and Brian K Rutt. Visualization of intra-thalamic nuclei with optimized white-matter-nulled mprage at 7t. Neuroimage, 84:534–545, 2014.
2) Bender, B., Manz, C., Korn, A., Nagele, T., Klose, U. Optimized 3D magnetization prepared rapid acquisition of gradient echo: identification of thalamus substructures at 3 T. AJNR Am. J. Neuroradiol. 32, 2110–2115, 2011
3) Anne Morel, Michel Magnin, Daniel Jeanmonod, et al. Multiarchitectonic and stereotactic atlas of the human thalamus. Journal of Comparative Neurology, 387(4):588–630, 1997.
Figures
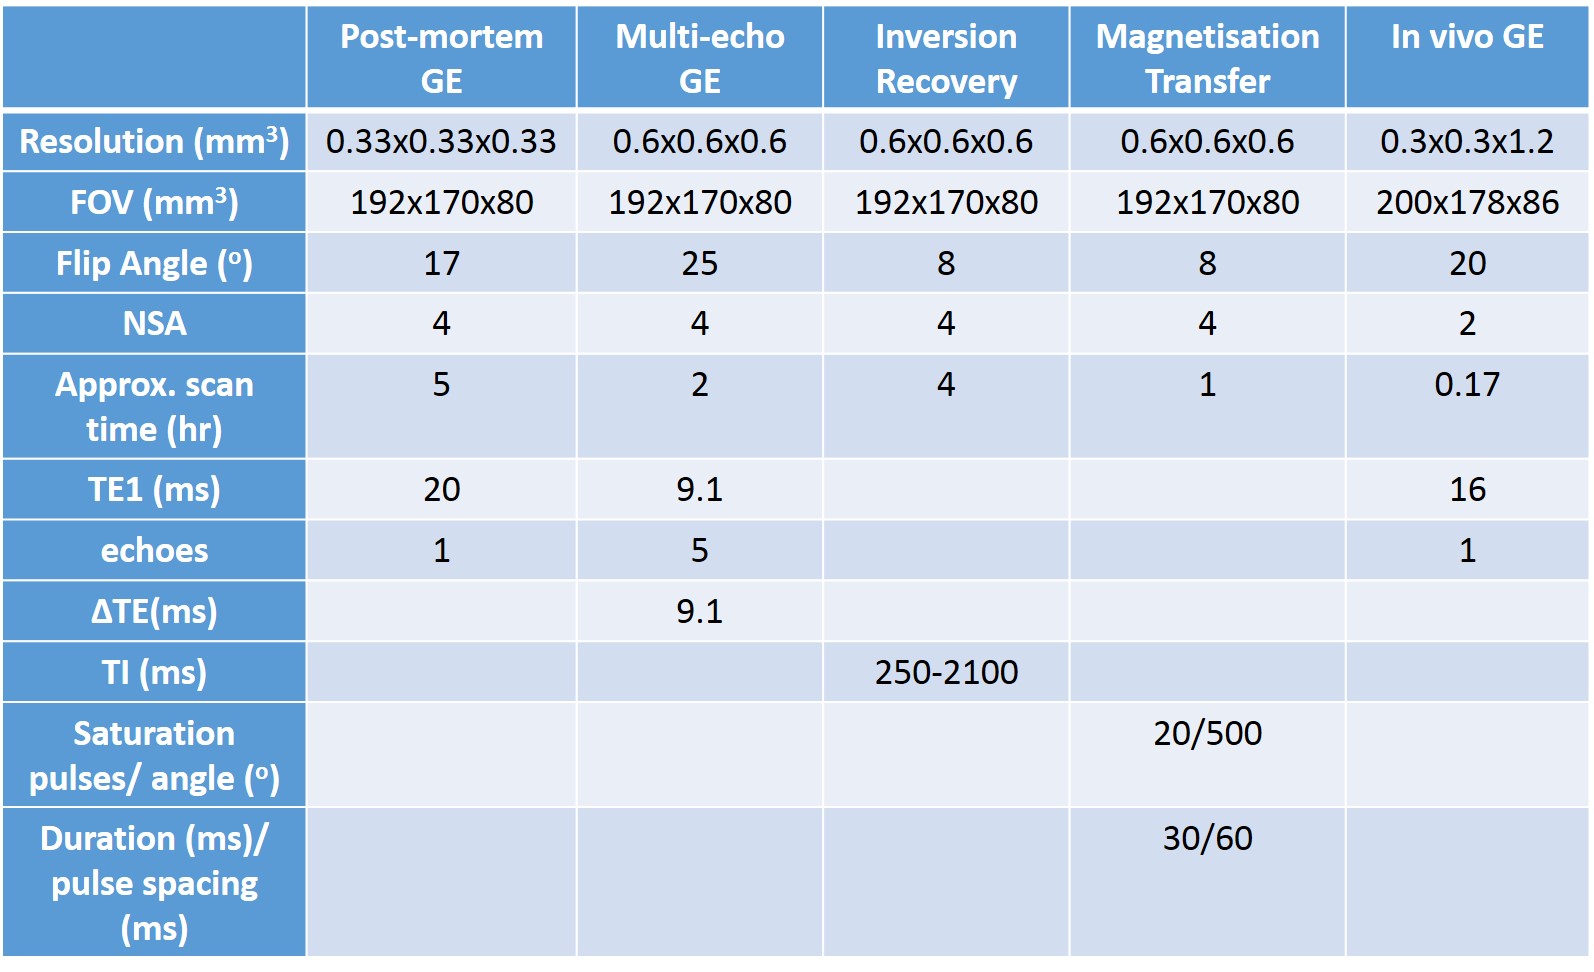
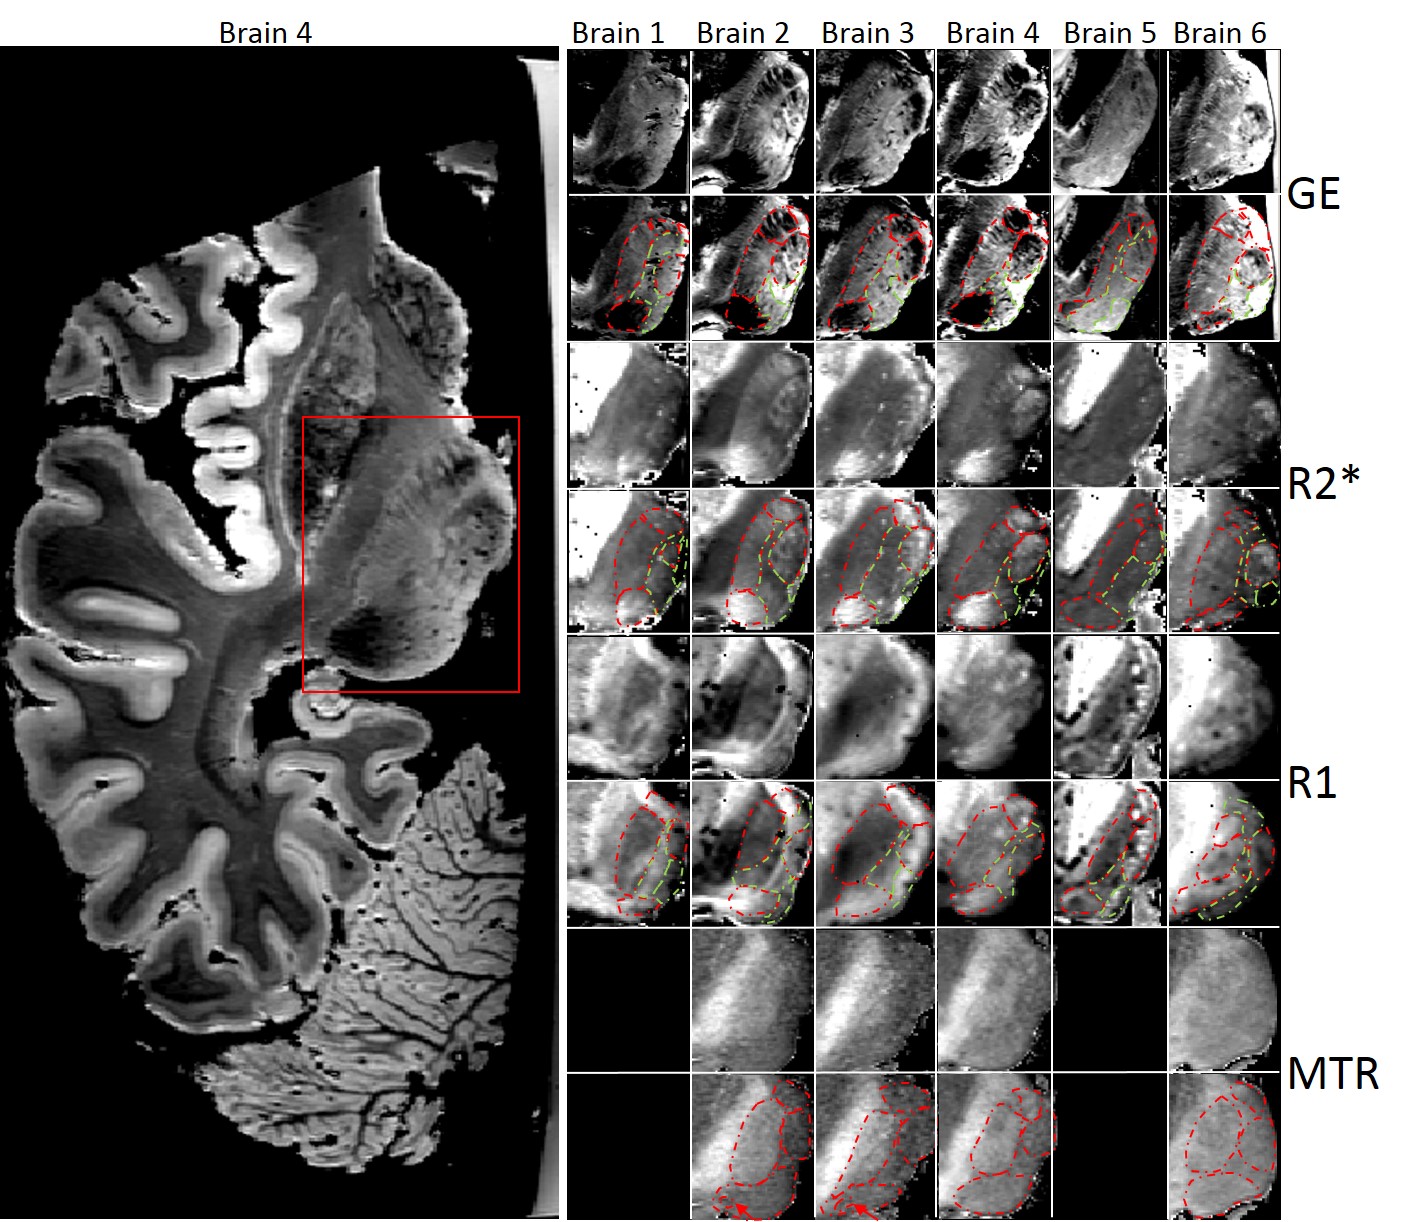
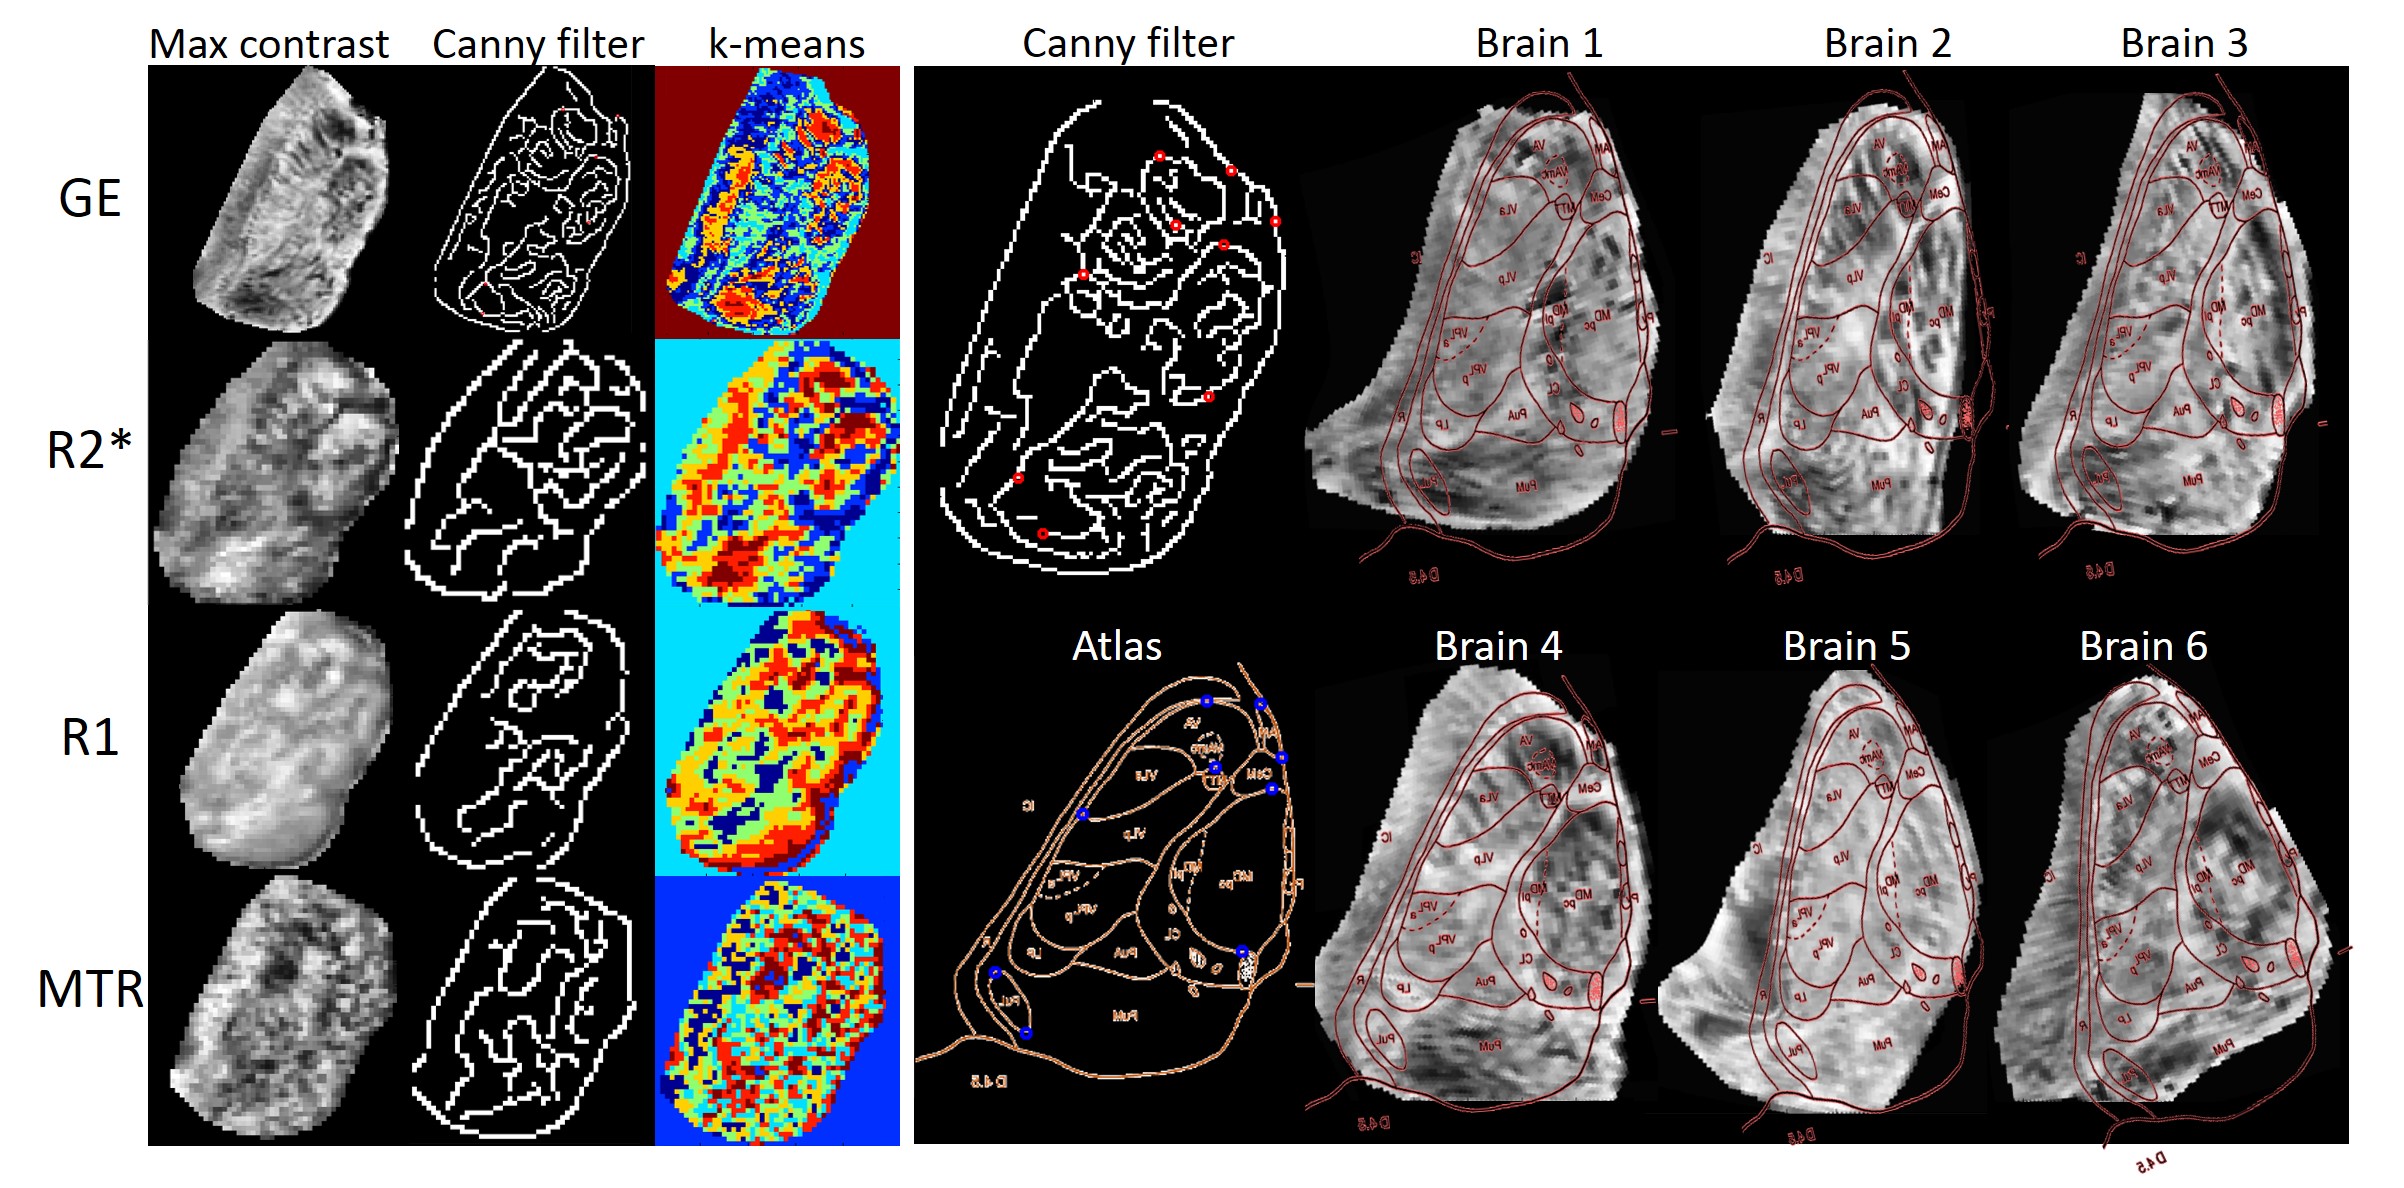
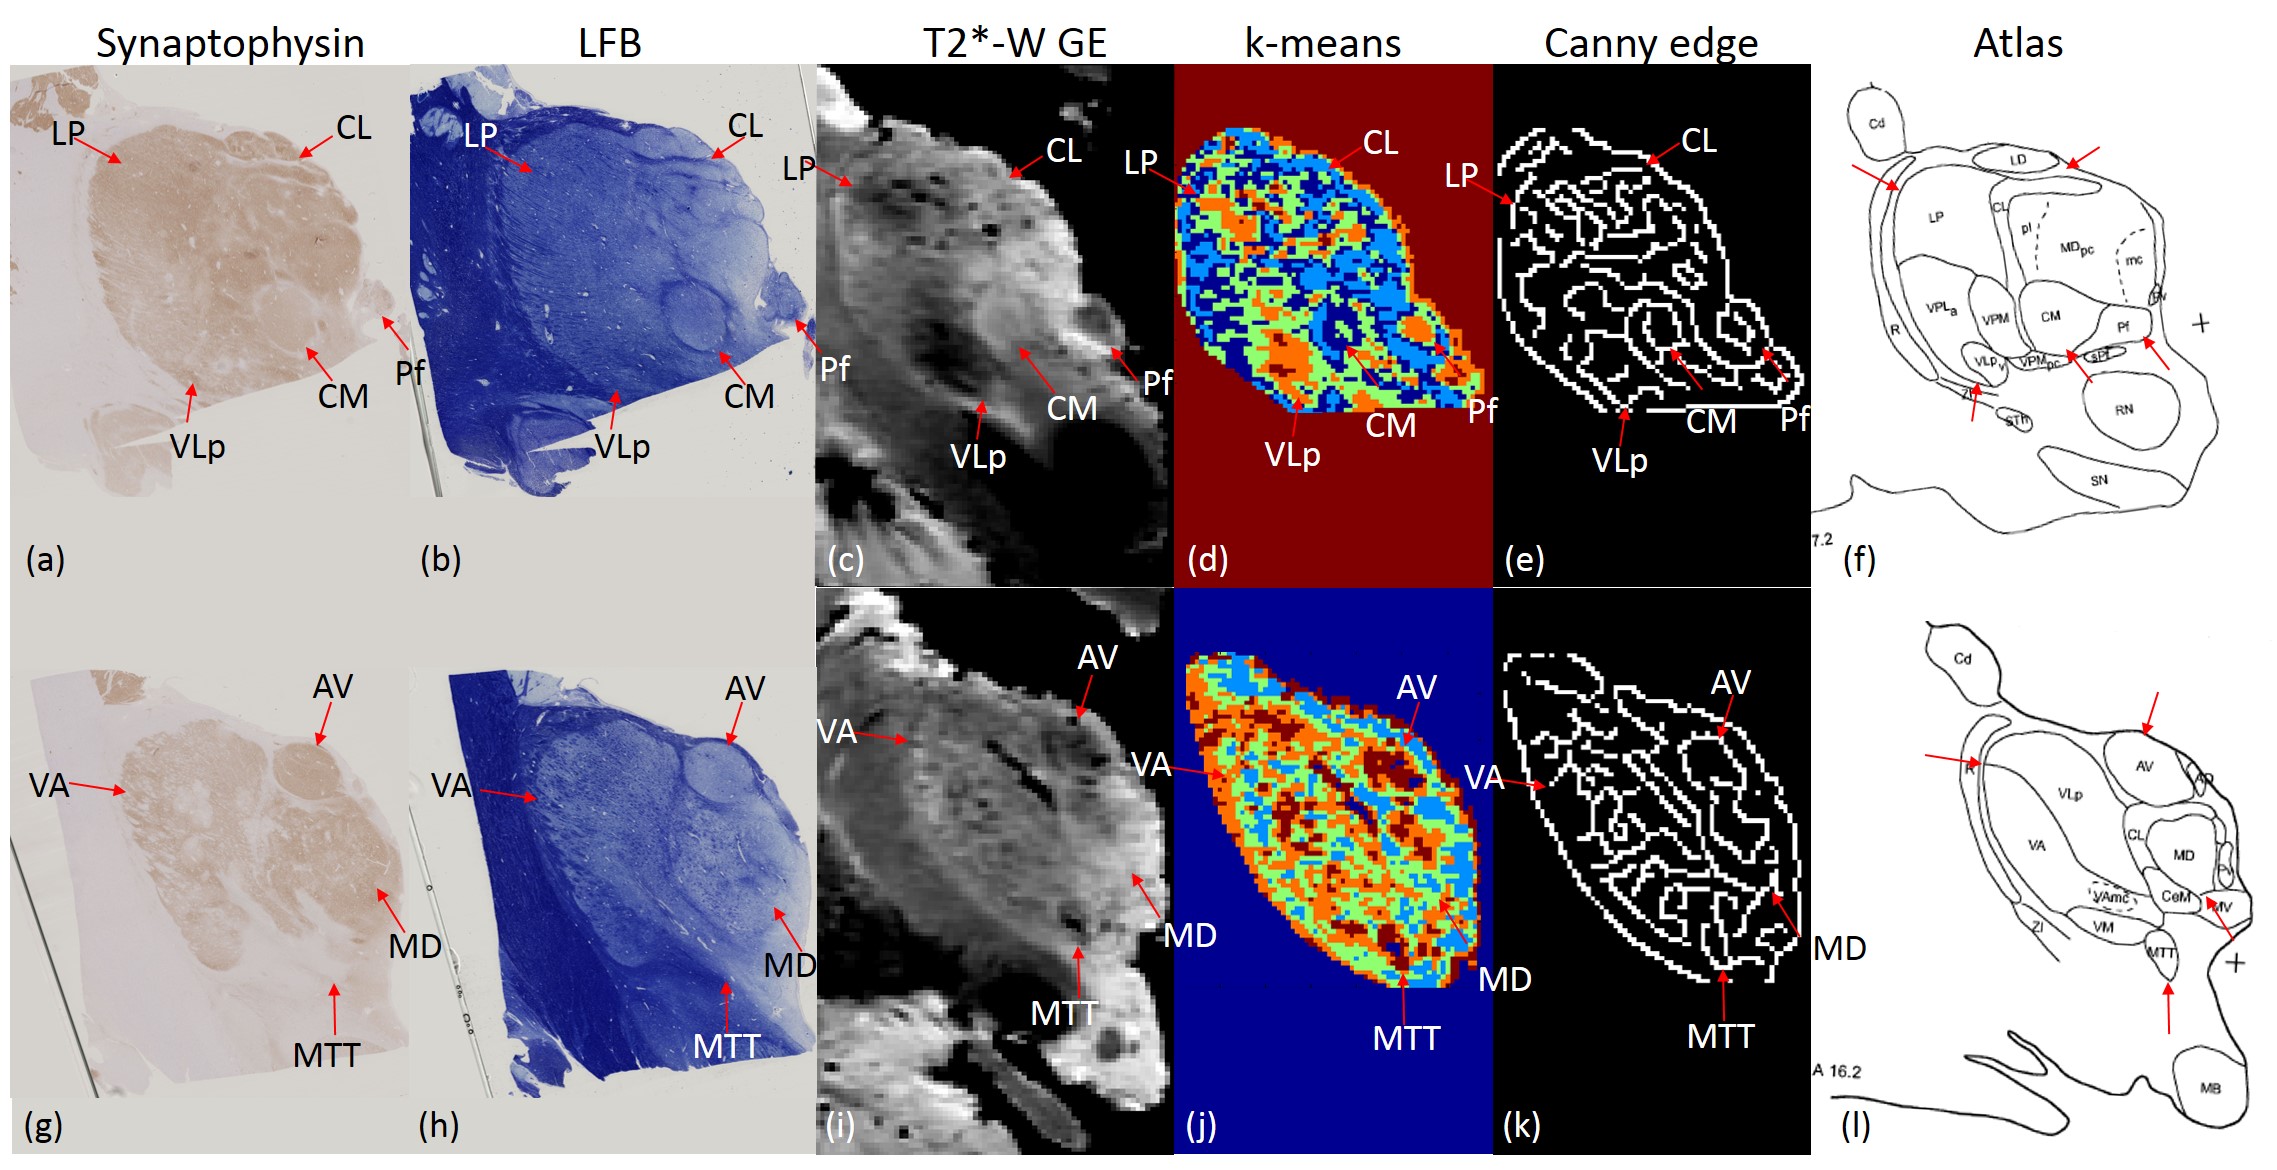
Figure 3: Comparison of coronal stained sections and MRI allowing matching to the atlas and thus identification of nuclei within the thalamus on post-mortem scans. a) Coronal Synaptophysin and b) LFB stains of sectioned right thalamus with c) corresponding high resolution GE magnitude image of left thalamus, d) k-means clustering e) Canny edge detection and f) atlas slice. g-l) Equivalent images for anterior section of thalamus.
Regions identified as the anteroventral (AV), central lateral (CL), centre median (CM), lateral posterior (LP), mediodorsal (MD), mammillothalamic tract (MTT), parafascicular (Pf), ventral anterior (VA) and ventral lateral posterior (VLp) nuclei.