4683
Reproducibility of human habenula characterization with high-resolution quantitative susceptibility mapping at 3T1Department of Biomedical Engineering, Sungkyunkwan University, Suwon, Korea, Republic of, 2Center for Neuroscience Imaging Research, Institute for Basic Science, Suwon, Korea, Republic of
Synopsis
We investigated scan-rescan reproducibility of human habenula susceptibility measurement using quantitative susceptibility mapping (QSM) at a 0.5x0.5x0.8 mm3 resolution. Although previously reported paramagnetic enhancement in the habenula (Schenck et al., ISMRM 2015) was confirmed, the paramagnetic center was highly localized within the habenula mass to make the susceptibility quantification vulnerable to partial volume effects. This appeared to limit the reproducibility of peak susceptibility measurements in the habenula to 10~40%, with significant variation among subjects. High resolution scans and reliable coil combination of phase data would be needed to make QSM a more reliable tool for human habenula characterization.
Introduction
The habenula is a pair of small (a few millimeters) deep-brain nuclei located near the posterior commissure that is believed to play an important role in brain reward circuitry as well as psychiatric conditions such as depression. MR-based morphological habenula imaging has so far largely focused on T1 and T2* contrast based on high myelin content in the cell mass [1,2]. Recently Schenck et al.[3] proposed that quantitative susceptibility mapping (QSM) is a promising tool to depict the habenula with high conspicuity, at the same time providing quantitative information on its magnetic properties. The initial data in [3] were limited by a relatively large slice thickness (2 mm), which could cause severe partial volume effects. Here we investigate the scan-rescan reproducibility of in-vivo susceptibility quantification of the habenula at 0.5x0.5x0.8 mm3 resolution in order to examine the potential of QSM for high-resolution habenula imaging and characterization.Methods
Healthy volunteers (2 males, 1 female, ages 19,35,43) were scanned for 3D multi-echo gradient echo imaging in the brain at 3T in a 20 channel head-and-neck array (Siemens Prisma). The scans followed a protocol approved by the local IRB. The scan parameters were: TR=47 ms, TE=7~42 ms in 5 ms steps, flip angle=20°, slice thickness=0.8 mm, matrix size= 512(AP)x352(LR)x120(SI), FOV= 27(AP)x18.6(LR) cm2, bandwidth= 240 Hz/pixel, GRAPPA acceleration factor= 2, scan time= 18min 47sec. Each volunteer was scanned 10 times over several days. The magnitude and phase data were processed independently with two QSM reconstruction pipelines, namely the STI Suite (version 2.2, http://people.duke.edu/~cl160/, pipeline 1) and MEDI Toolbox (May 2016, http://weill.cornell.edu/mri/pages/qsm.html, pipeline 2). For volunteers 1 and 2, seven (out of 20 total) scans were saved without scanner-provided channel combination, for off-line coil combination based on temporal phase unwrapping and zero TE interpolation (in-house code in Matlab R2013b, Mathworks, USA). Habenula masks were created on an axial slice based on the magnitude images, following the guidelines of [2]. The susceptibility values inside the left and right habenula as well as inside manually drawn region-of-interest (ROI) masks for thalamus (excluding pulvinar) and pulvinar were obtained and analyzed.Results
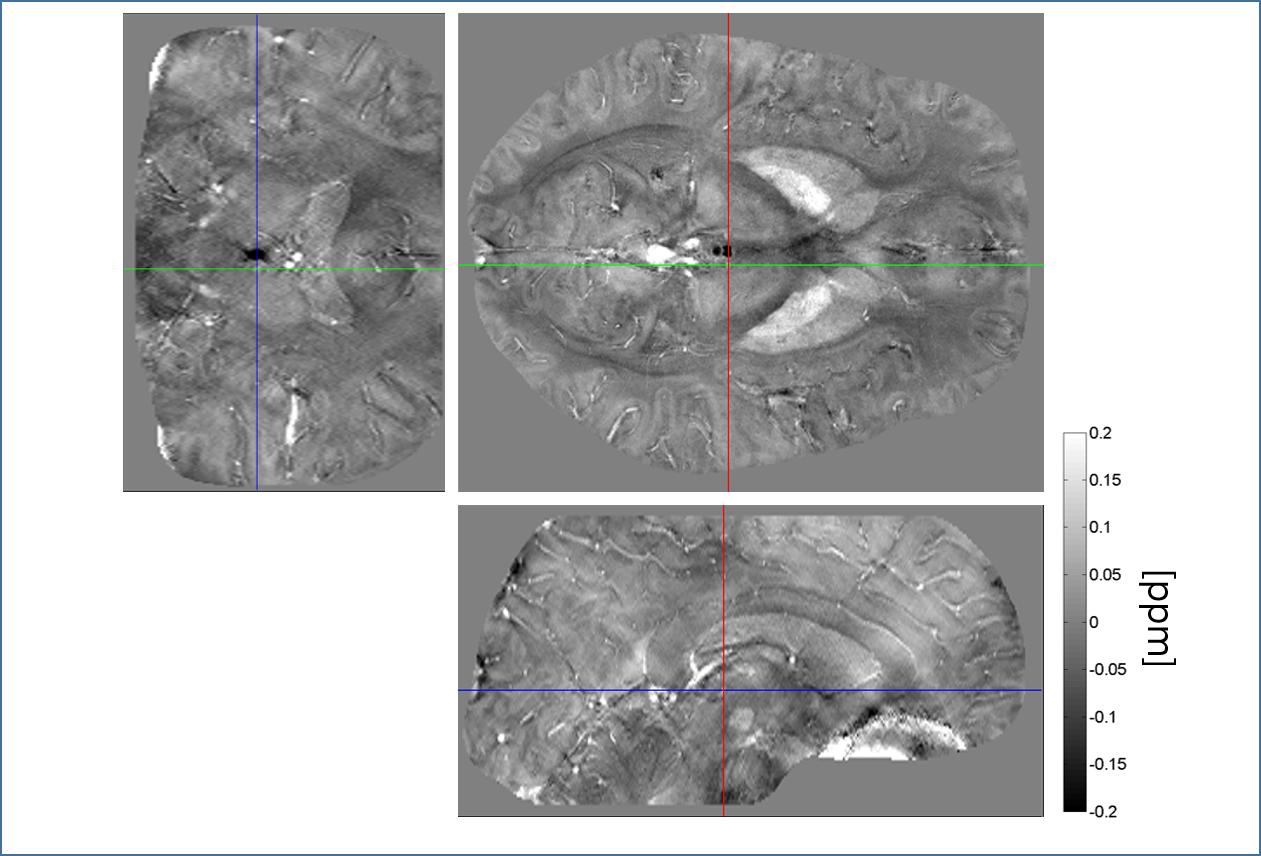
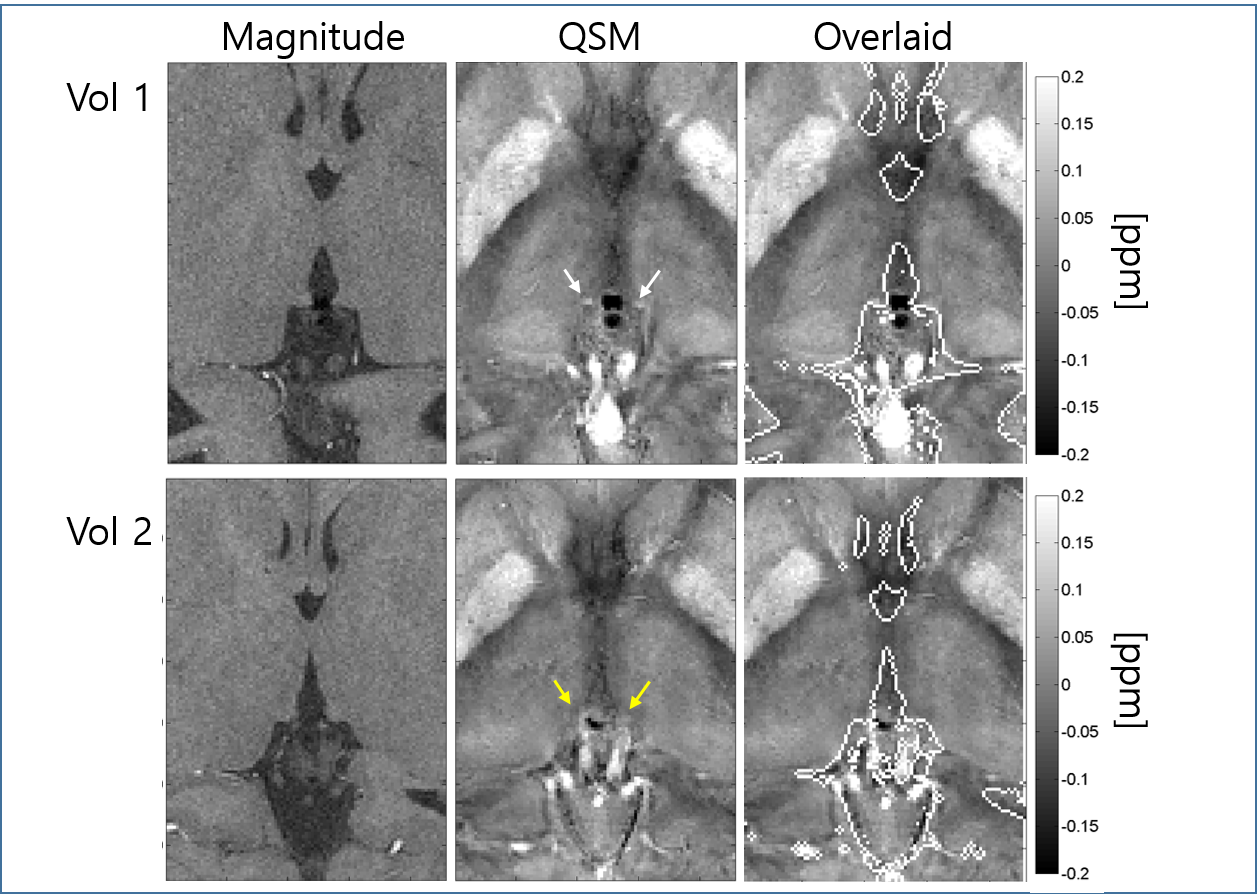
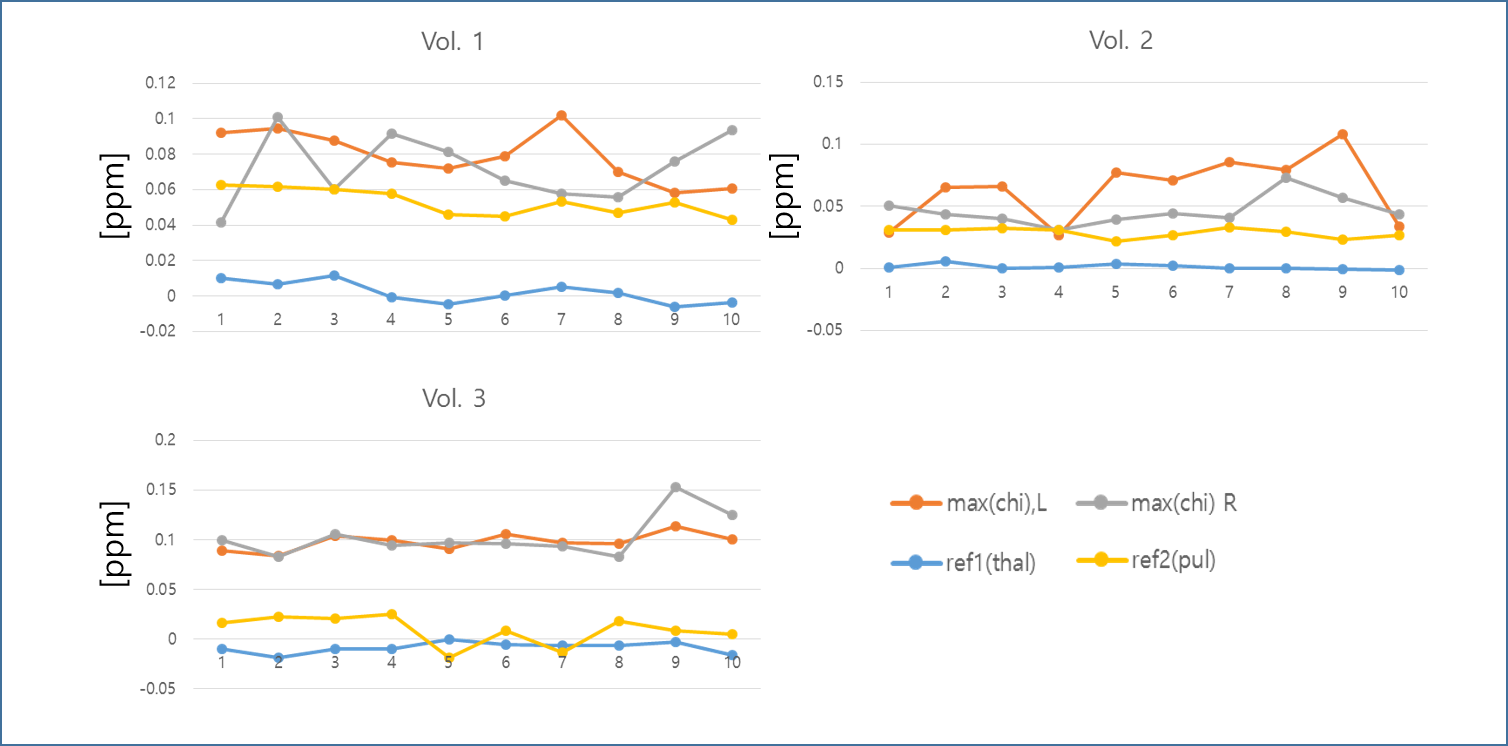
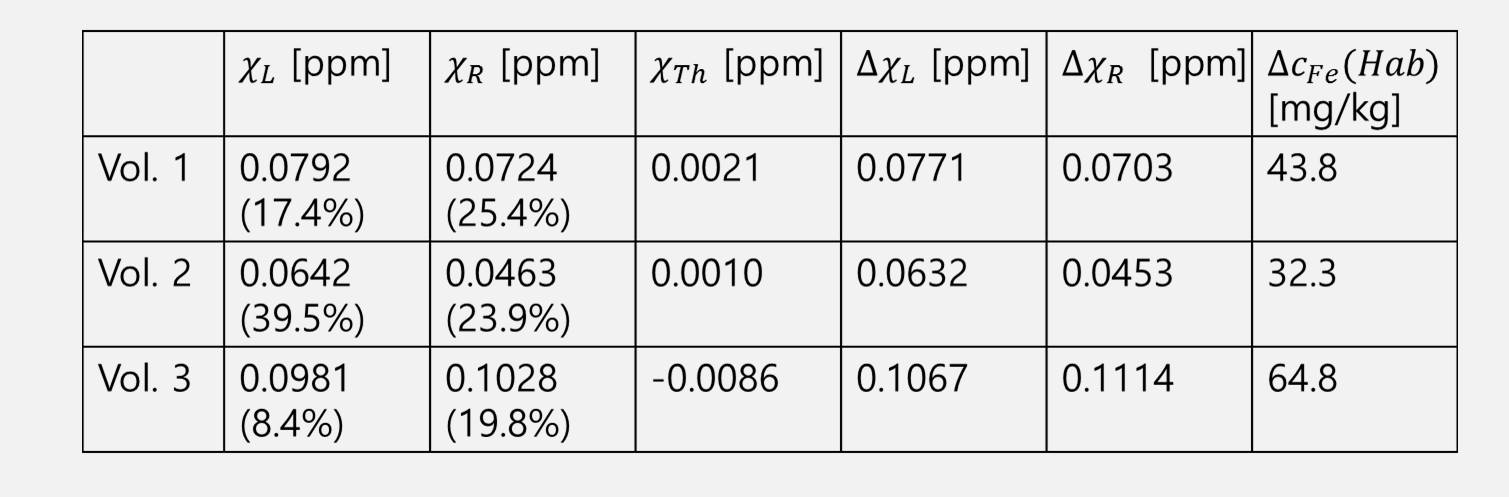
The QSM results obtained from pipeline 2 were highly dependent on coil combination methods, due partly to streaking artifacts originating from phase kinks in the scanner-provided coil-combined data. In comparison, the first pipeline was much less sensitive to coil combination methods. In the following we focus on the results obtained with pipeline 1. Figure 1 shows an example of the susceptibility maps in a three-plane view. Figure 2 illustrates different levels of conspicuity of paramagnetic centers in the habenula for different volunteers. Highly localized (sometimes limited to 1-2 pixels) hyperintense pixels with significant subject-to-subject variation were observed in both reconstruction pipelines. At the spatial resolution used, it was clear that the susceptibility and potentially the iron distribution within the habenular nuclei is generally highly inhomogeneous. Figure 3 presents all 3 volunteers’ data (pipeline 1) showing scan-rescan variations of the peak susceptibility in the left and right habenulae, compared to the mean susceptibility in the thalamus and pulvinar ROI. Substantial variation in habenula susceptibility values compared to the reference is observed. Table 1 summarizes the inter-scan average susceptibility for each volunteer as well as scan-to-scan variability (standard deviation) in percent. Using thalamus (excluding pulvinar) as a reference, the relative susceptibility in the habenula and the corresponding apparent iron content were determined based on the calibration in [4]. This quantity, however, is confounded by the presence of myelin, which is diamagnetic, in the habenular nuclei; the calculated iron concentration is likely a lower bound.Discussion and Conclusion
We have confirmed paramagnetic enhancement of the habenular nuclei compared to the surrounding structures in a high-resolution QSM study (with 4-fold smaller voxel volume than in [3]) using multiple reconstruction methods and a total of 30 scan datasets. Significant susceptibility heterogeneity within the habenula, as well as scan-rescan variability of upto 40% for the peak susceptibility, was observed. Using QSM for magnetic susceptibility characterization of human habenula is challenging not only because of the small anatomy but also because its susceptibility is highly heterogeneous. While this may correlate with and shed some light on magnetic properties of habenula substructures, more work is needed to establish fast, high-resolution scan protocols for reliable susceptibility quantification. Small field-of-view imaging combined with parcellated reconstruction [5] and/or highly accelerated imaging [6] could be important to further push the spatial resolution within clinical scan times. Isolation of diamagnetic and paramagnetic sources using temperature (ex-vivo [7]) and myelin orientation dependence [8] would further help elucidate the role of iron in the habenula susceptibility.Acknowledgements
This work was supported by IBS-R015-D1.References
[1] Kim J-W et al., NeuroImage 130 (2016), 145-156. [2] Lawson RP et al., NeuroImage 64 (2013), 722-727. [3] Schenck JF et al., Proc ISMRM 23 (2015), 285.[4] Deistung A et al., Proc ISMRM 24 (2016), 30. [5] Anderson C et al., Proc ISMRM 24 (2016), 1108. [6] Bilgic B et al., NeuroImage 125 (2016), 1131-1141. [7] Birkl C et al., Magn Res Med 73 (2015), 1282-1288. [8] Li W et al., NMR Biomed (2016) doi: 10.1002/nbm.3540.
Figures