4682
Dura Mater imaging with UTE T2* Mapping1Graduate School of Biomedical Sciences, Tokushima University, Tokushima, Japan, 2Global MR Applications and Workflow, GE Healthcare, 3Graduate school of Health Science, Tokushima University, 4School of Health Sciences, Tokushima University
Synopsis
To assess signal of dura mater acquired from UTE imaging, we evaluated this component with T2* mapping derived from a multi-echo UTE sequence of healthy volunteers. We then compared measured T2* values of cranium and dura mater. The mean T2* value of dura mater in five healthy volunteers was significantly higher than that of cranium (P < .05). It is found that the T2* decay of dura mater was faster than the cranium components. UTE T2* mapping makes it possible to obtain detailed information for meningeal abnormalities.
Introduction
In the diagnosis of brain tumors, the ability to identifying the dura mater is an important factor. Generally, the observation of the dura mater using magnetic resonance imaging (MRI) has been performed with gadolinium-enhanced T1 weighted MRI. The diagnosis of meningioma is known as “dural tail sign” on a gadolinium-enhanced MRI, is seen as thickening of enhanced dura mater resembling a structure similar to a tail extending from the mass [1]. Moreover, when deciding a therapeutic protocol for brain tumor treatment, it is very impotent to diagnose whether the tumor is invasive into the dura matter [2]. Ultra-short echo time (UTE) imaging is an imaging technique which acquires a signal from tissues and components having very short T2* such as cortical bone [3]. If observed dura mater using UTE, it will be possible to obtain more detailed information concerning the degree of invasiveness and/or spread of the brain tumor. The quantitative analysis for dura mater calls for further investigation such as its relaxation process.Purpose
To assess signal of dura mater acquired from UTE imaging, we evaluated this component with T2* mapping derived from a multi-echo UTE sequence of healthy volunteers.Materials and Methods
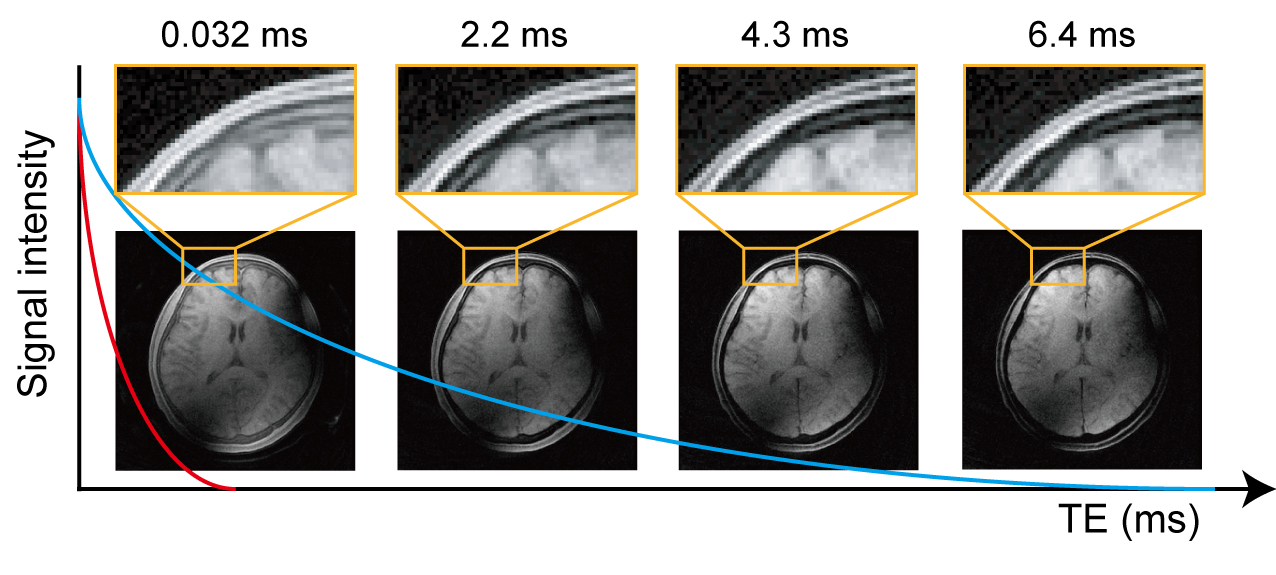
On a 3.0 T MR system (Discovery 750, GE Healthcare), UTE imaging was performed using a specialized three-dimensional spoiled gradient-echo (3D-SPGR) sequence with fat-suppression. The imaging parameters were TE, four echoes (0.032, 2.2, 4.3, and 6.4 ms); repetition time, 110 ms; flip angle, 18 degrees; bandwidth, 976.6 Hz/pixel; slice thickness, 4 mm; matrix size, 256 × 256; field of view, 240 mm. Scan setting for each subject involved the whole brain. Figure 1 shows schematic illustration of this study. T2* mapping is calculated as follows: $$ I(TE)=M_{0}\exp(-\frac{TE}{T_2^*})$$$$ \therefore[M_{0},T_2^*]=arg\min(\sum_{i=1}^{N_{TE}}((i(TE)_{i}-I(TE)_{i}(\alpha_{i}))^{2}))$$ where I(TE) is the MR signal of each TE, M0 is the equilibrium magnetization, i(TE) is the theoretical signal value. Then, using varying α values, a nonlinear curve fitting procedure can yield an estimation of parameters for M0 and T2* according to the relationship between MR signal and TE. Then, the Levenberg-Marquardt algorithm method was used for nonlinear curve fitting. These fittings were applied to each voxel. Subjects were five healthy volunteers (five men; mean age, 23.8 years old; 23-40 years old). After we set the region-of-interest (ROI) as the frontal dura mater and cranium on the lateral ventricle level of the brain, we measured signals and T2* values making all masks corresponding to each ROI. We evaluated T2* values acquired from ROI analysis of each subject. We then compared measured T2* values of cranium and dura mater. Comparisons of T2* values of dura matter and cranium were made using the nonparametric Wilcoxon signed-rank test. Then, a P value of <0.05 was considered statistically significant.
Results and Discussion
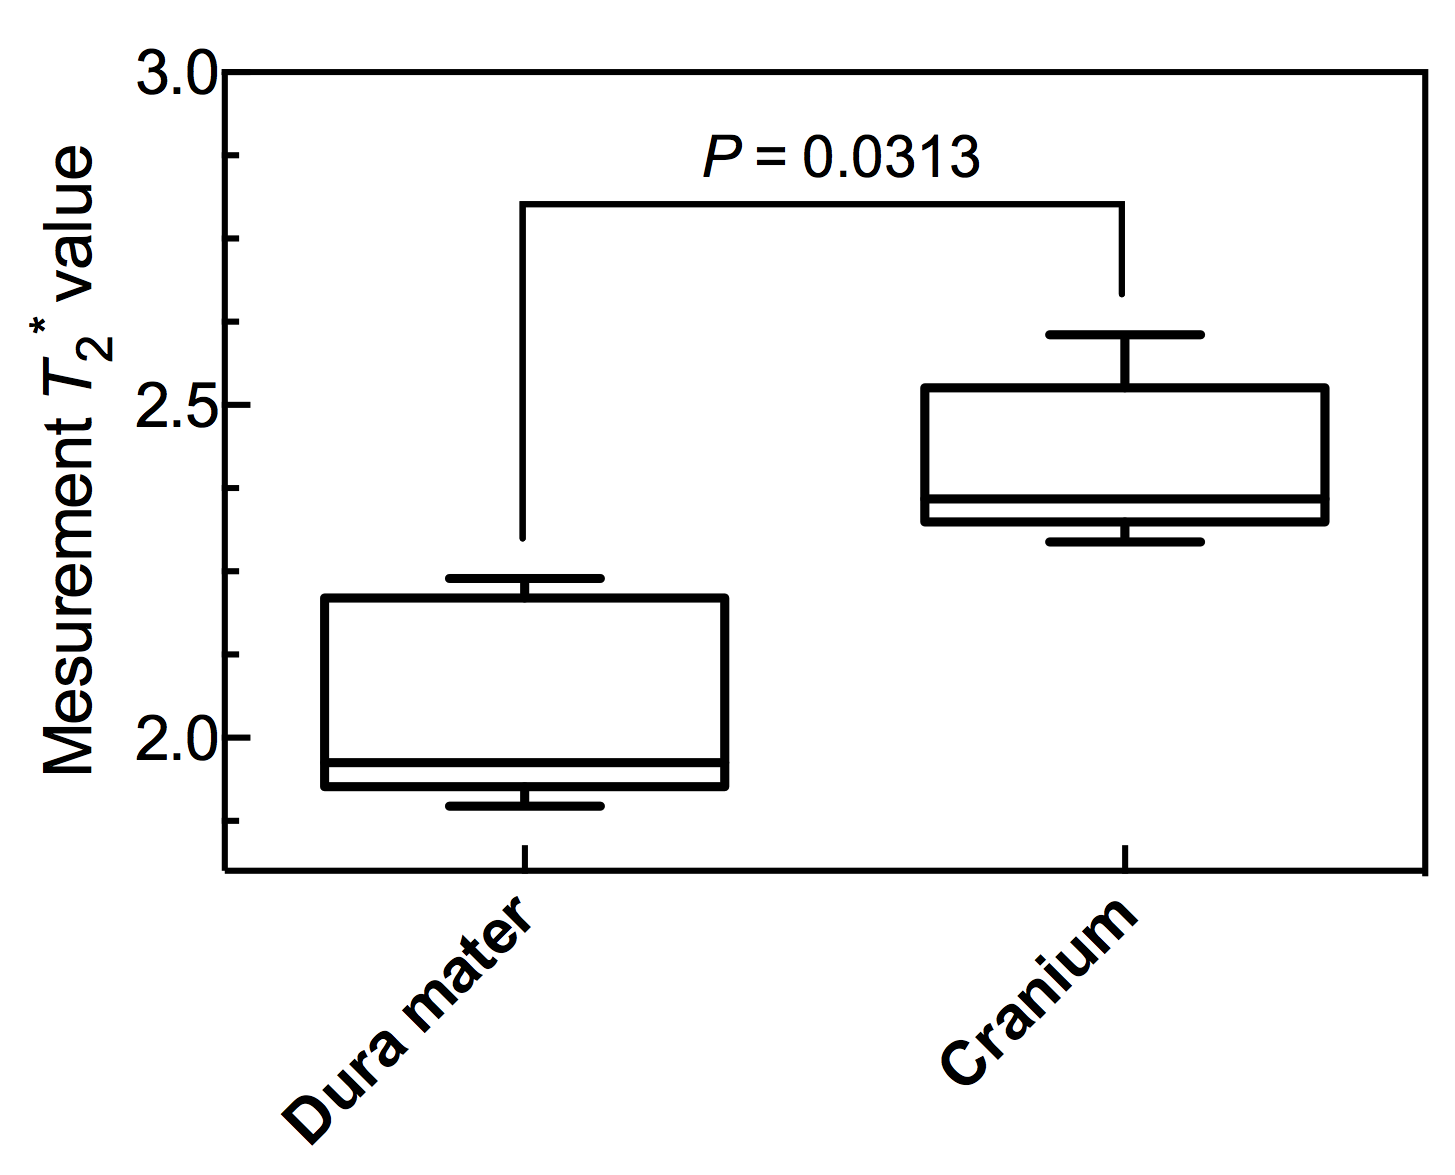
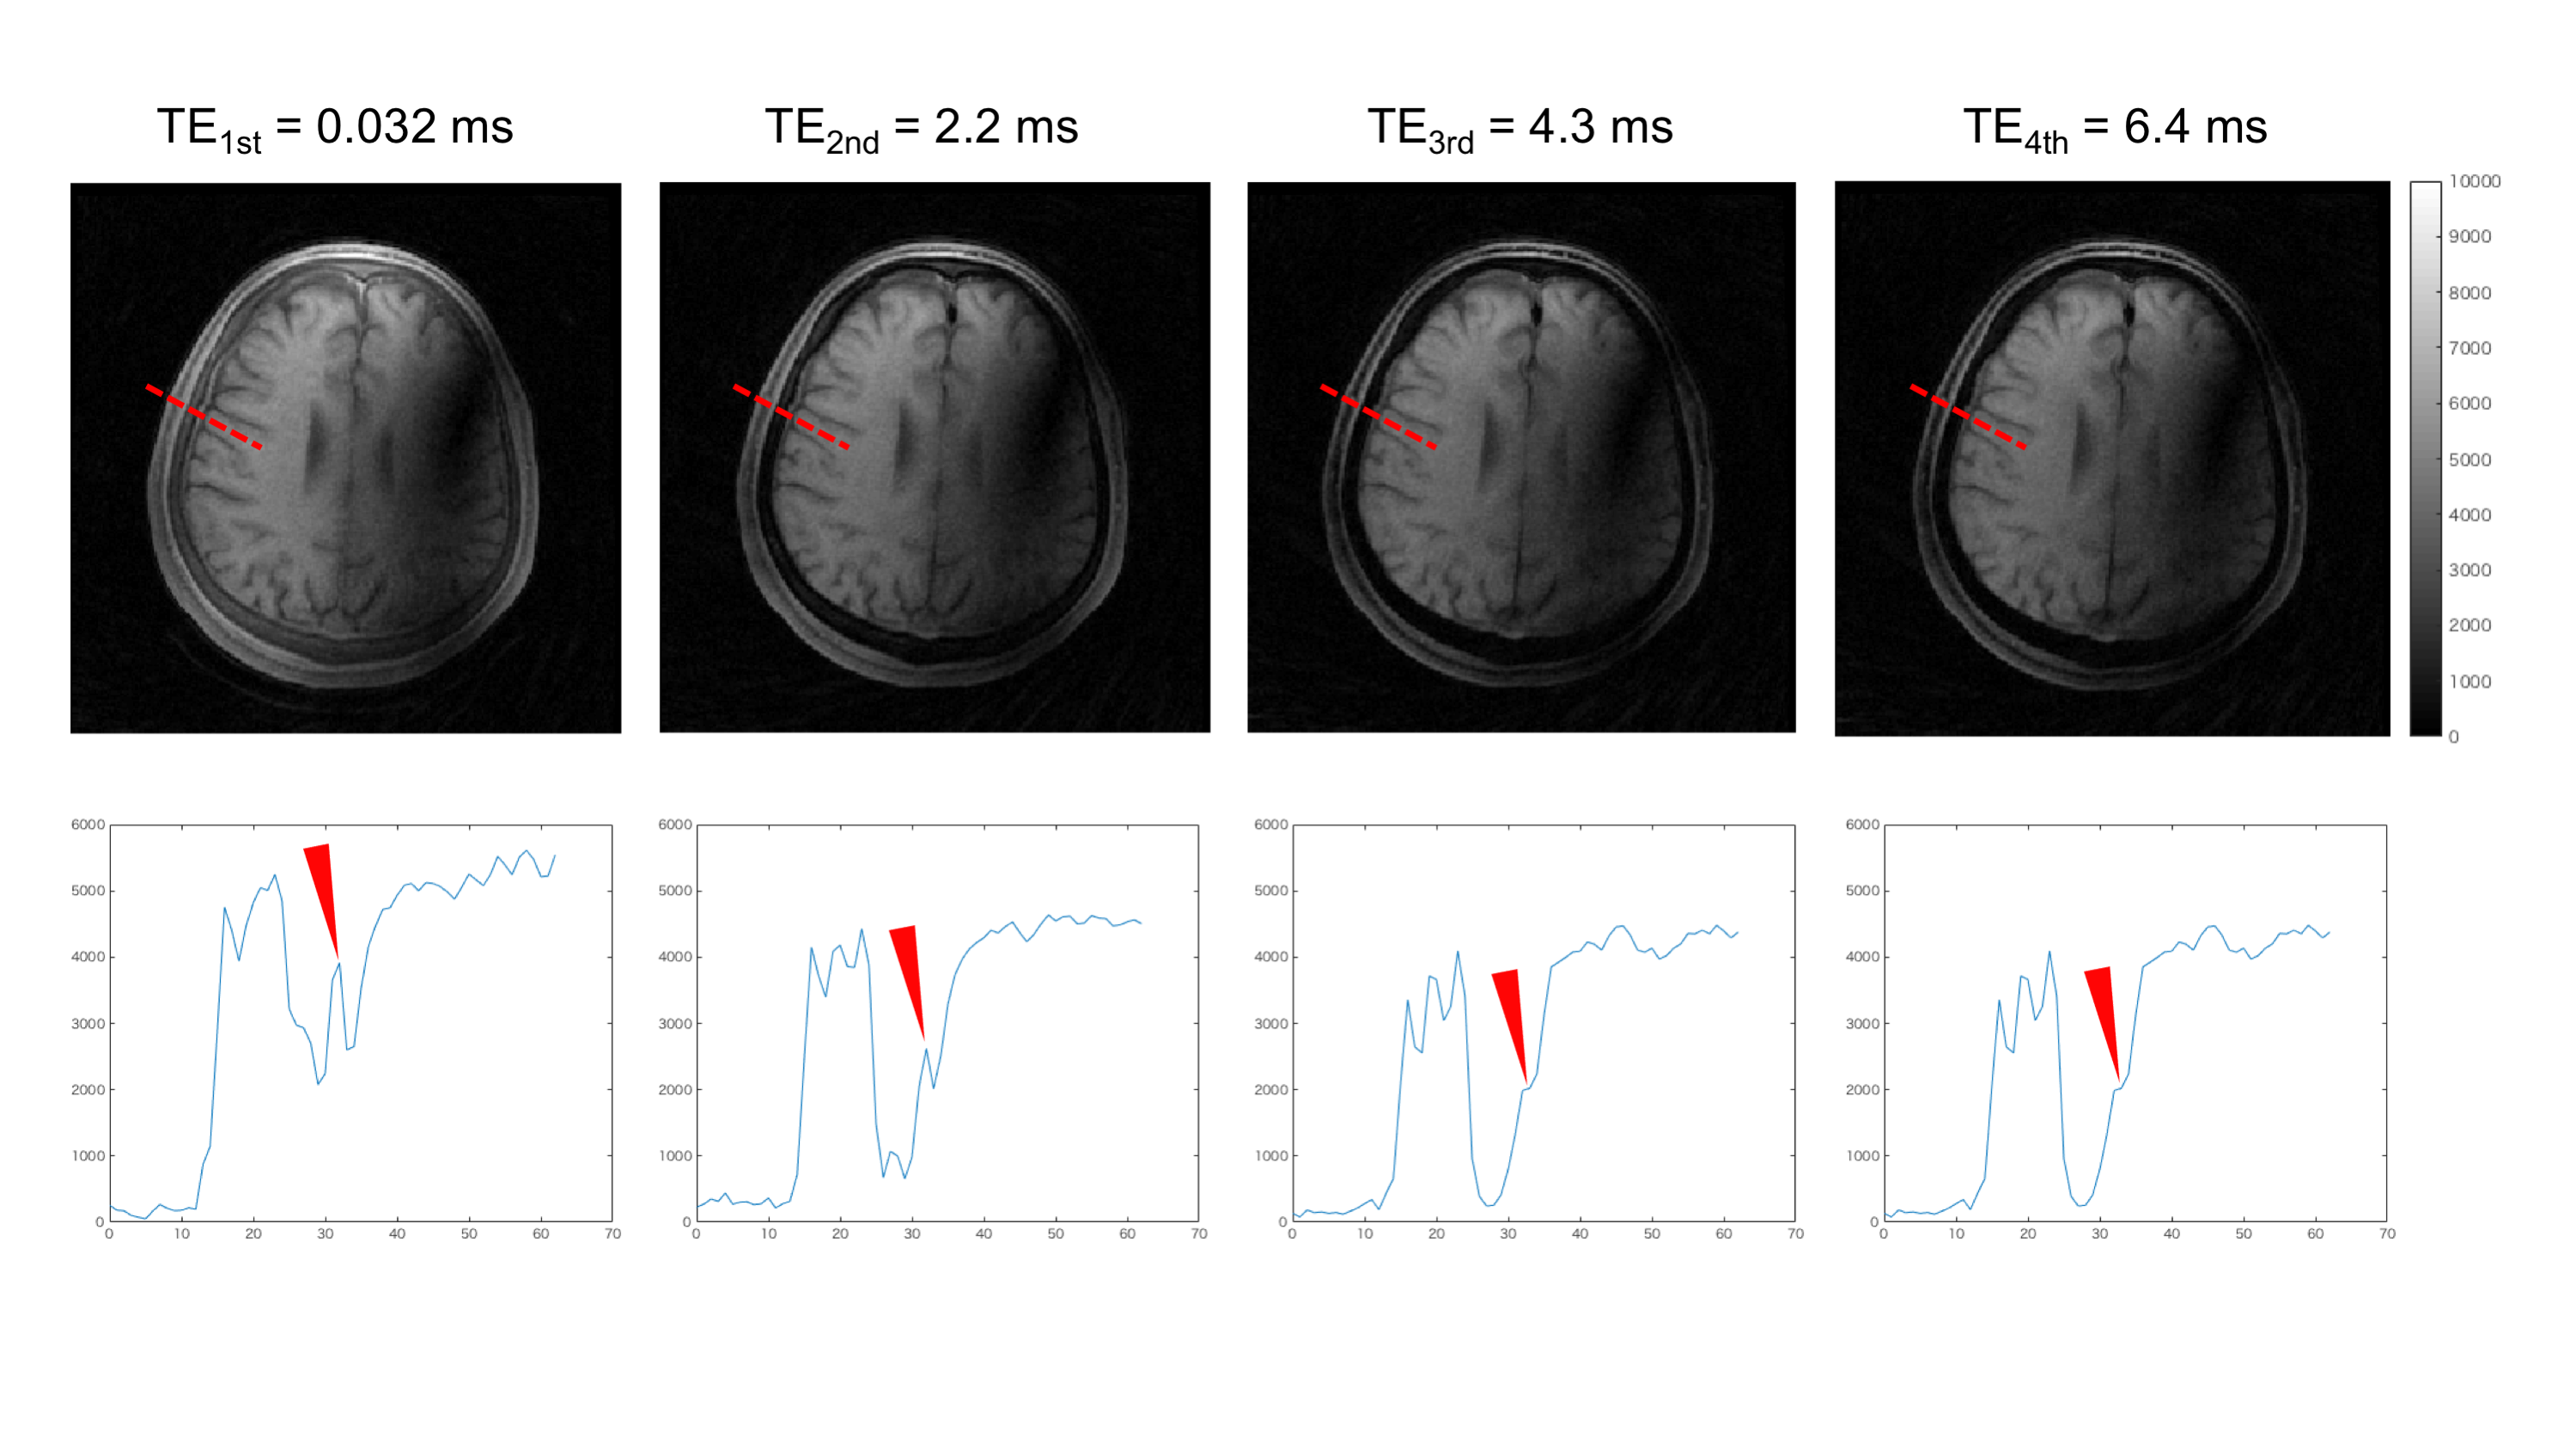
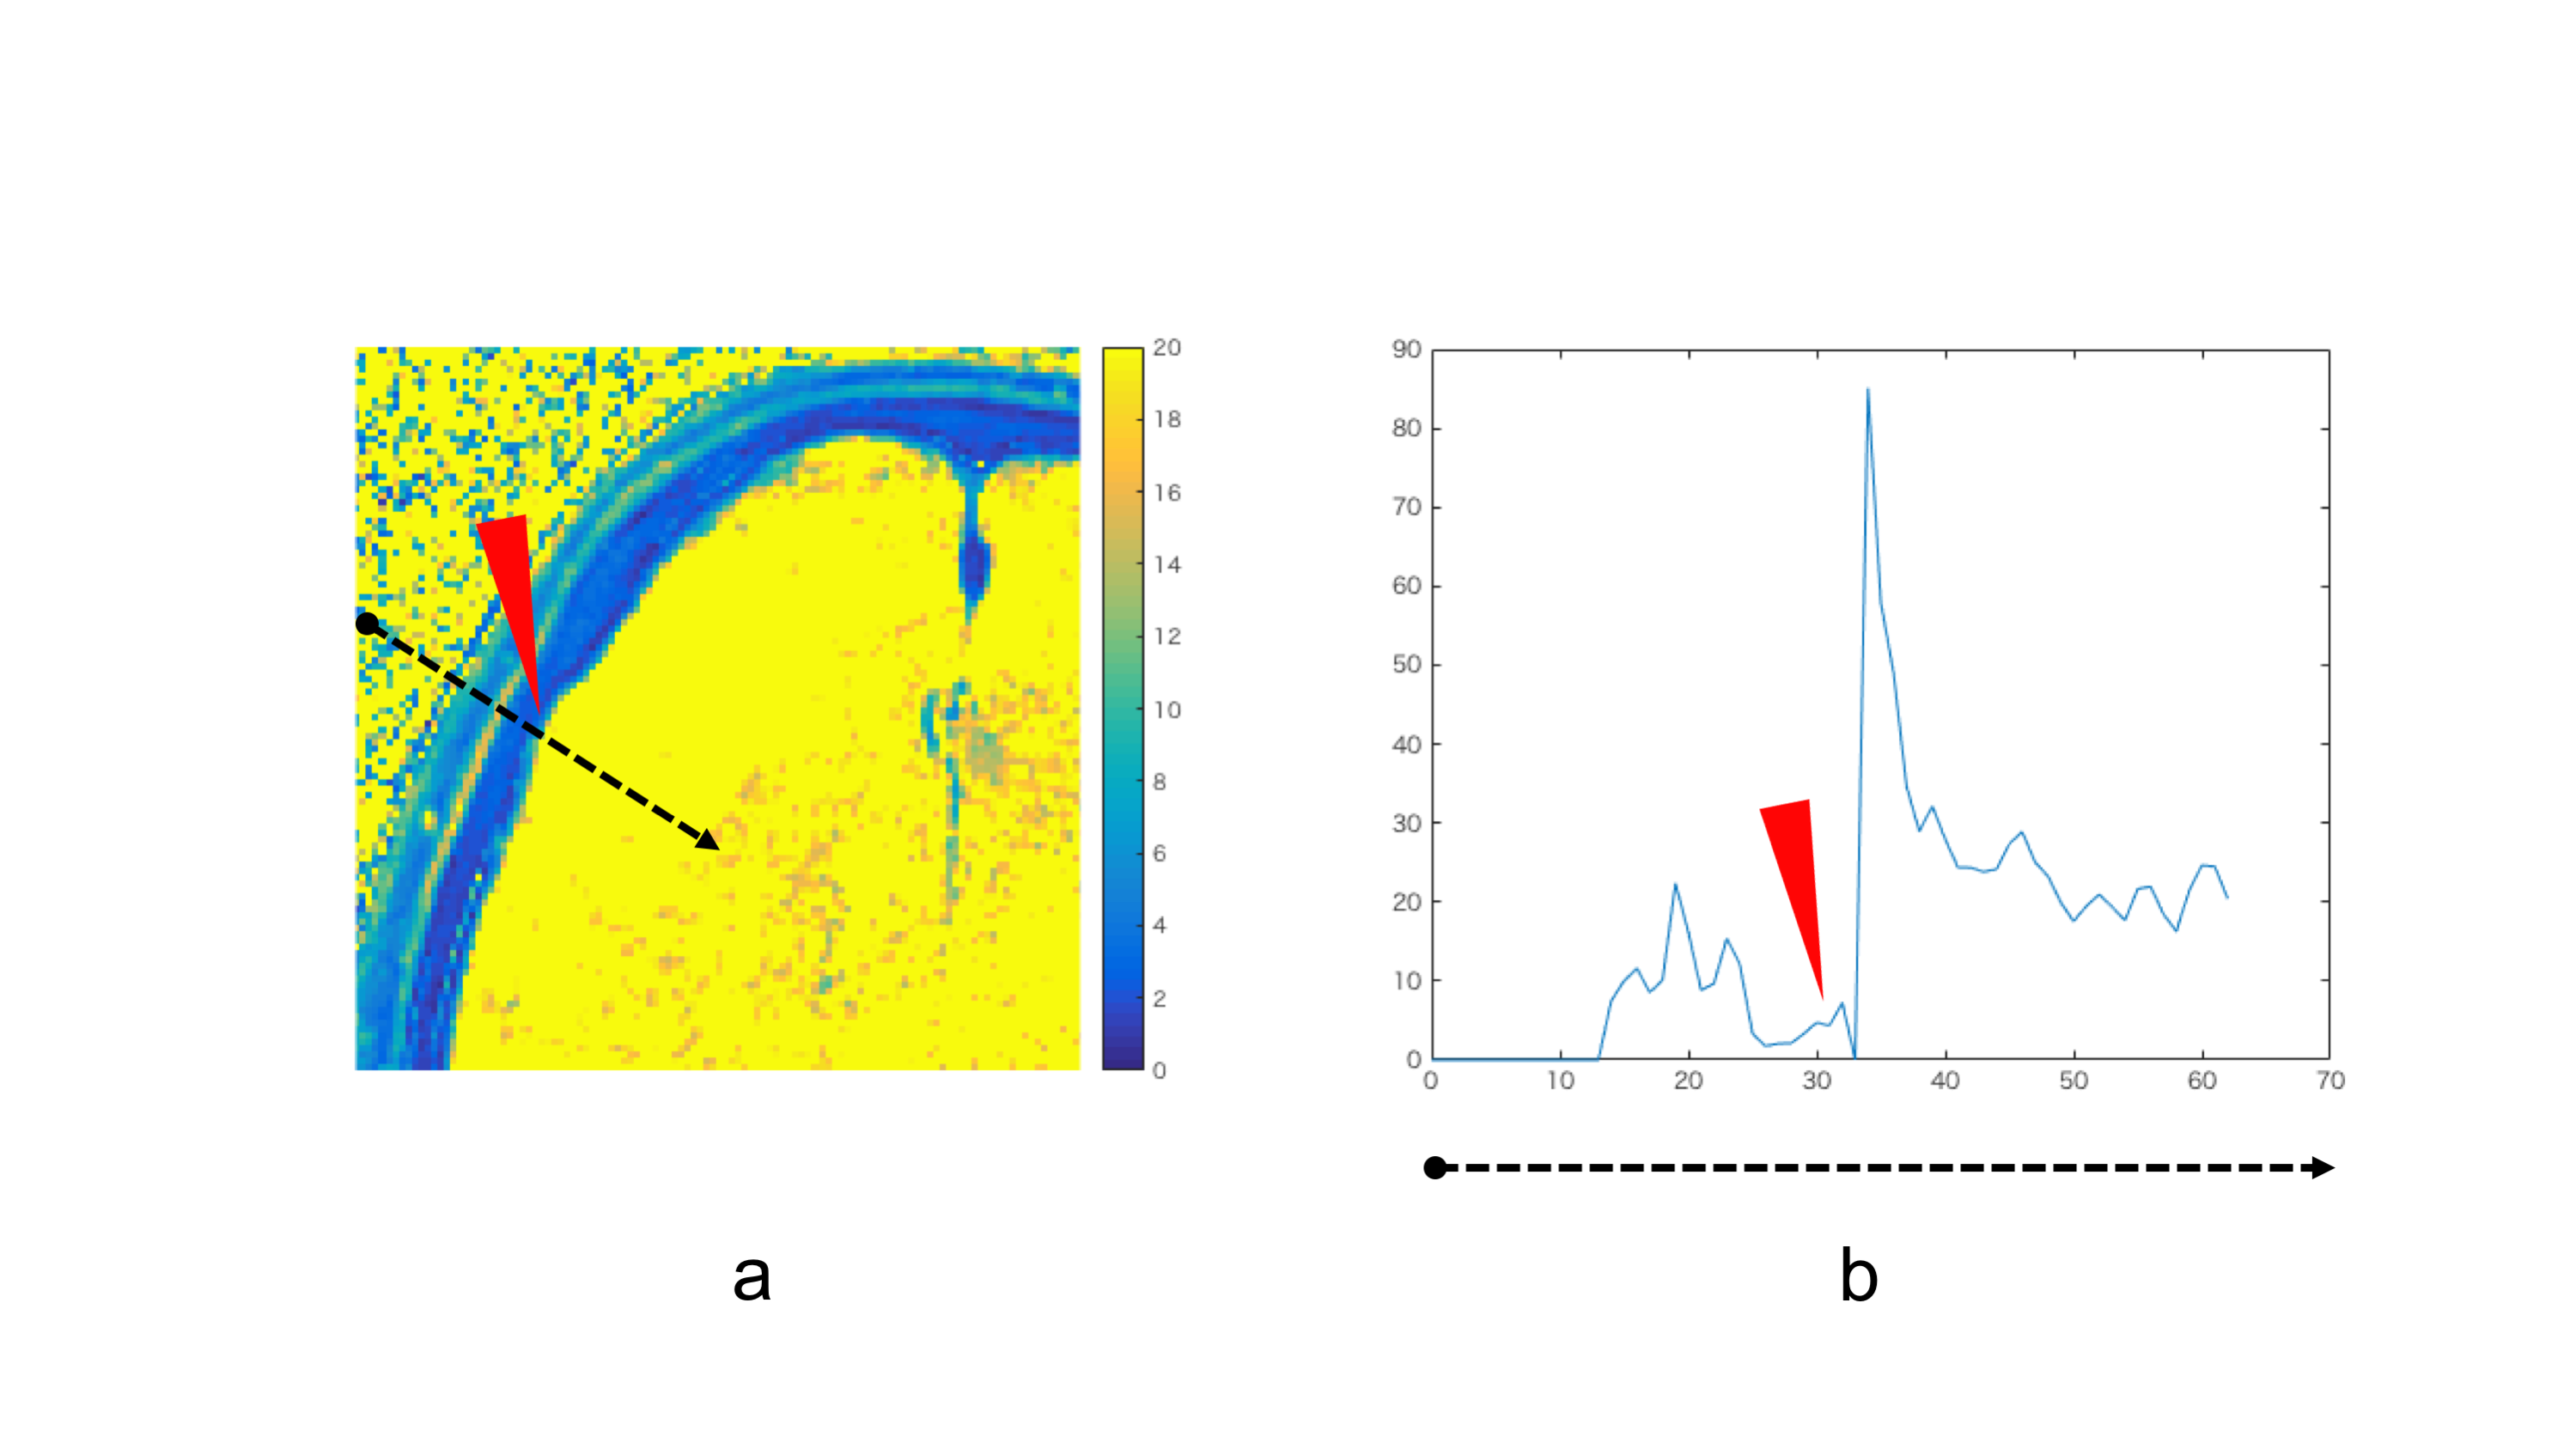
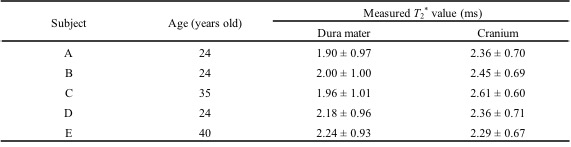
Table 1 shows measured T2* values of dura mater and cranium of each volunteer. Figure 2 shows mean measured T2* values for dura mater and cranium. Mean T2* values for dura mater in the five healthy volunteers was 2.05 ± 0.98 ms, and that of cranium was 2.41 ± 0.67 ms. The mean T2* value of dura mater in five healthy volunteers was significantly higher than that of cranium (P < .05). Figure 3 shows magnitude images of each echo and each line profile curve. Figure 4 shows T2* map and its line profile curve. We discussed the signal having dura mater components, in which was acquired with setting TE from 0.032 to 2.2 ms. Moreover, it is found that the T2* decay of dura mater was faster than the cranium components.Conslusion
By using UTE imaging, we found that the dura mater signal is able to be separated from the cranium signal and brain signal. Moreover, UTE T2* mapping makes it possible to obtain detailed information for meningeal abnormalities.Acknowledgements
No acknowledgement found.References
[1] Goldsher D, Litt AW, Pinto RS, Bannon KR, Kricheff II. Dural "tail" associated with meningiomas on Gd-DTPA-enhanced MR images: characteristics, differential diagnostic value, and possible implications for treatment. Radiology. 1990; Aug;176(2):447-50.
[2] Maroldi R, Ambrosi C, Farina D. Metastatic disease of the brain: extra-axial metastases (skull, dura, leptomeningeal) and tumour spread. Eur Radiol. 2005;15(3):617-26.
[3] Tyler DJ, Robson MD, Henkelman RM, Young IR, Bydder GM. Magnetic resonance imaging with ultrashort TE (UTE) PULSE sequences: technical considerations. J Magn Reson Imaging. 2007;25(2):279-89.
Figures