4681
(free)Surfing ANTs: a comparative study1Mint Labs, Barcelona, Spain
Synopsis
Robust and automated tools such as FreeSurfer or ANTs for brain segmentation and quantification have been of utmost importance in the recent advancements in the Neuroimaging field. However, the reproducibility and variability of their results are often uncertain. In this study, we analyzed their reproducibility and compared their outputs for different brain structures. We observe that both tools give high reproducibility for volumetric studies and give similar results in most of the examined cases. However, in some structures (pallidum, rostral-anterior cingulate) there are more pronounced and significant differences. Our results also indicate slightly better reproducibility of ANTs over FreeSurfer.
Introduction
Robust and automated tools for brain segmentation and quantification have been of utmost importance in the recent advancements in the Neuroimaging field. Open source tools such as FreeSurfer1 or ANTs2 ease, as well as significantly accelerate, the task of conducting large scale and data-driven morphometric studies. However, the reproducibility and variability of their results are often uncertain. Maclaren et al.3 generated a publicly available test-retest dataset and analyzed the reproducibility of FreeSurfer. In our study, the aforementioned dataset is used to compare the reproducibility of volumetry results from both FreeSurfer and ANTs and to study their main differences.Methods
A standard FreeSurfer v5.3 pipeline was used to process 120 scans from the 3 subjects (for details on the data acquisition refer to Maclaren et al.3). The same scans were processed using the following ANTs v2.1 pipeline: 1) AFNI4 skull strip; 2) registration using the OASIS-30 template5; 3) Tissue segmentation iterating between N4 bias field correction6 and Atropos tissue segmentation7; 4) ANTs label propagation. In all cases, volumes from the left and right hemispheres were summed together to generate a single value for each structure for comparability with Maclaren’s study3. Mint Labs’ CloudN platform8 was used to run both pipelines, where the analysis for a total of 120 datasets was completed in ~10h on FreeSurfer and ~2.5h on ANTs with all processes being run in parallel. The same statistical analysis performed in Maclaren et al.3 was conducted in order to assess and compare the intra-session and inter-session variability for both tools. Furthermore, a direct comparison of the volumetric measures calculated by the two methods was performed in a similar way to Tustison et al.9: the percent variability difference between ANTs’ and FreeSurfer’s volumetric measures was computed for each structure and tissue in all of the 120 datasets using the following equation:
$$ \epsilon = \frac{x_{ANTs} - x_{FreeSurfer}}{ 0.5 (x_{ANTs} + x_{FreeSurfer}) } \quad (1) $$
Results
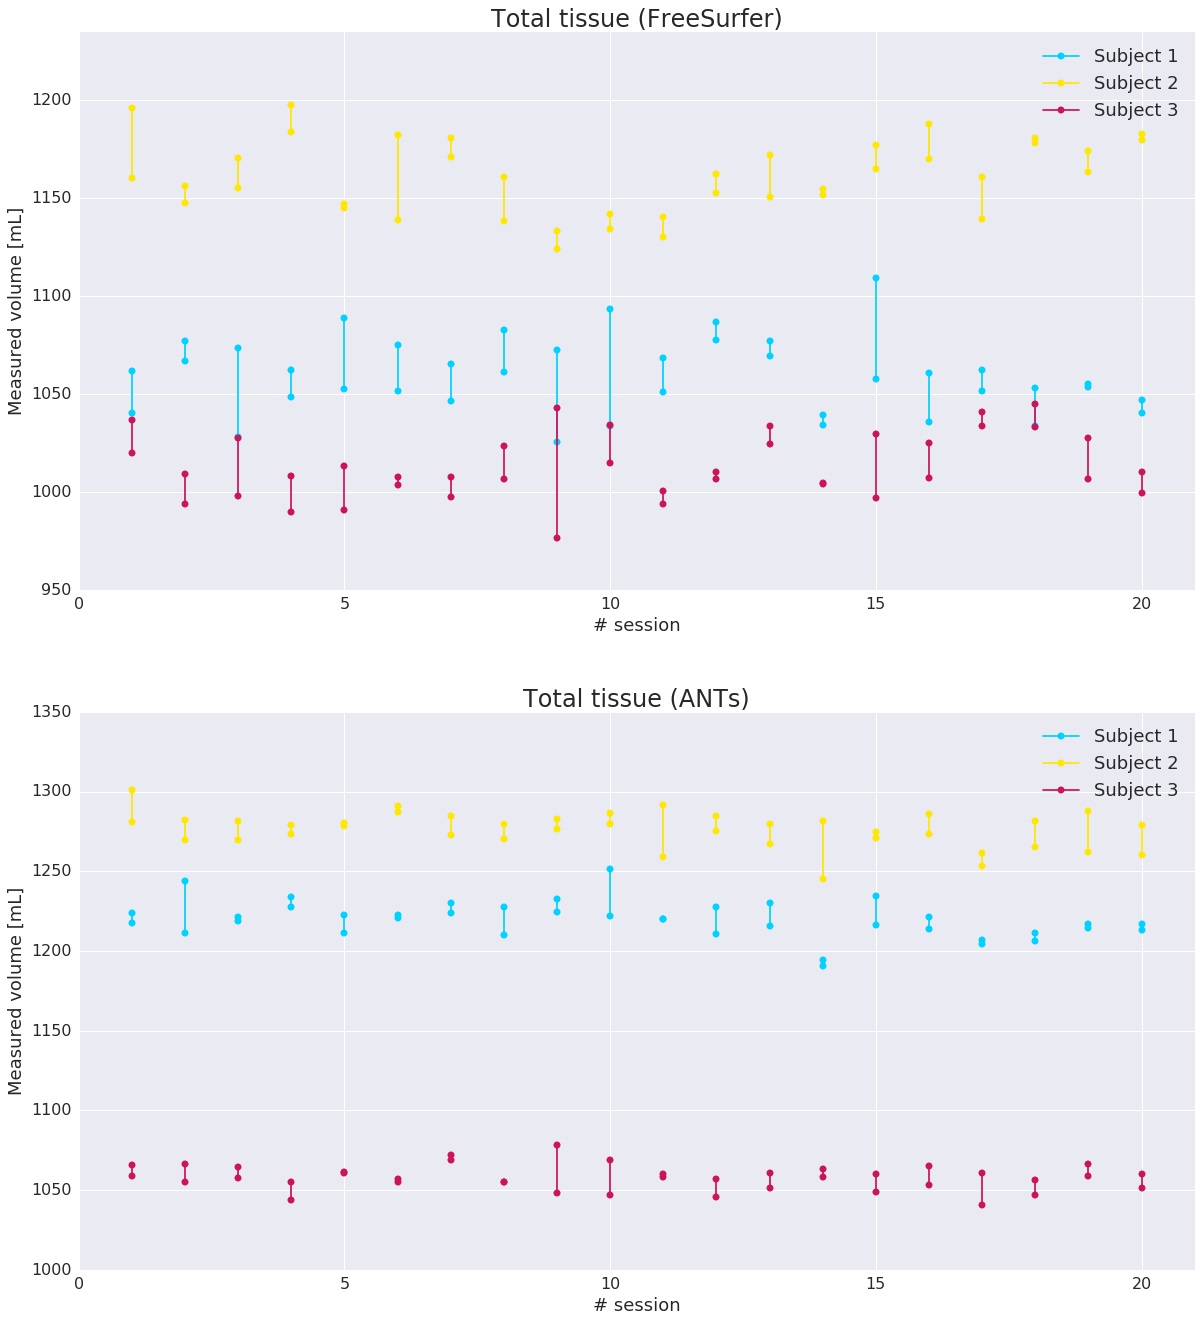
Measurements of the total tissue volume for the 3 subjects along 20 sessions are shown for both FreeSurfer and ANTs in Figure 1. We can observe that ANTs presents less intra-session and inter-session variability than FreeSurfer in the analyzed datasets.
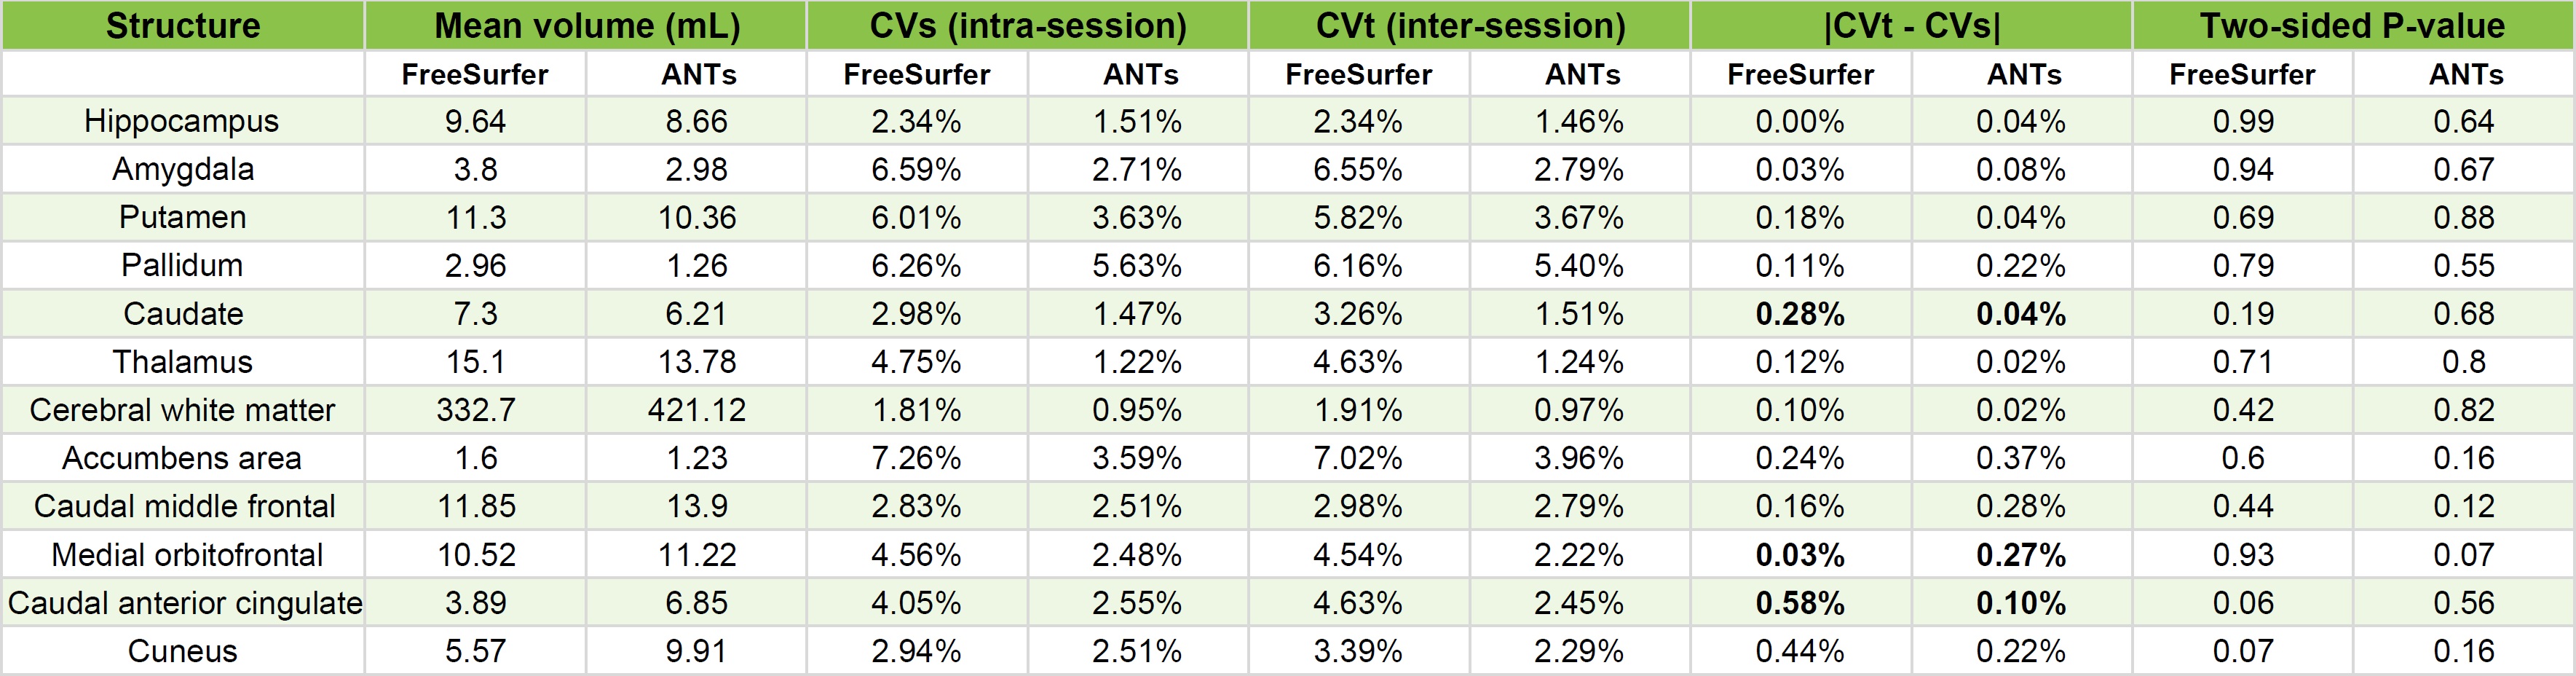
Figure 2 shows the results from the Monte Carlo permutations test. FreeSurfer results are highly similar to the ones presented in Maclaren et al.3, and the small differences can be explained by the tool versions used. No region is statistically significant at the 5% significance level, and the few regions that are significant at the 10% significance level (medial orbitofrontal in ANTs and caudal anterior cingulate and cuneus in FreeSurfer) do not present a high enough inter-session and intra-session variability difference to be related to actual structural changes. The most noticeable difference is found in the caudal anterior cingulate, which presents the greatest inter-session and intra-session variability difference, 0.58%, when using FreeSurfer, whereas it only presents a 0.1% difference when using ANTs.
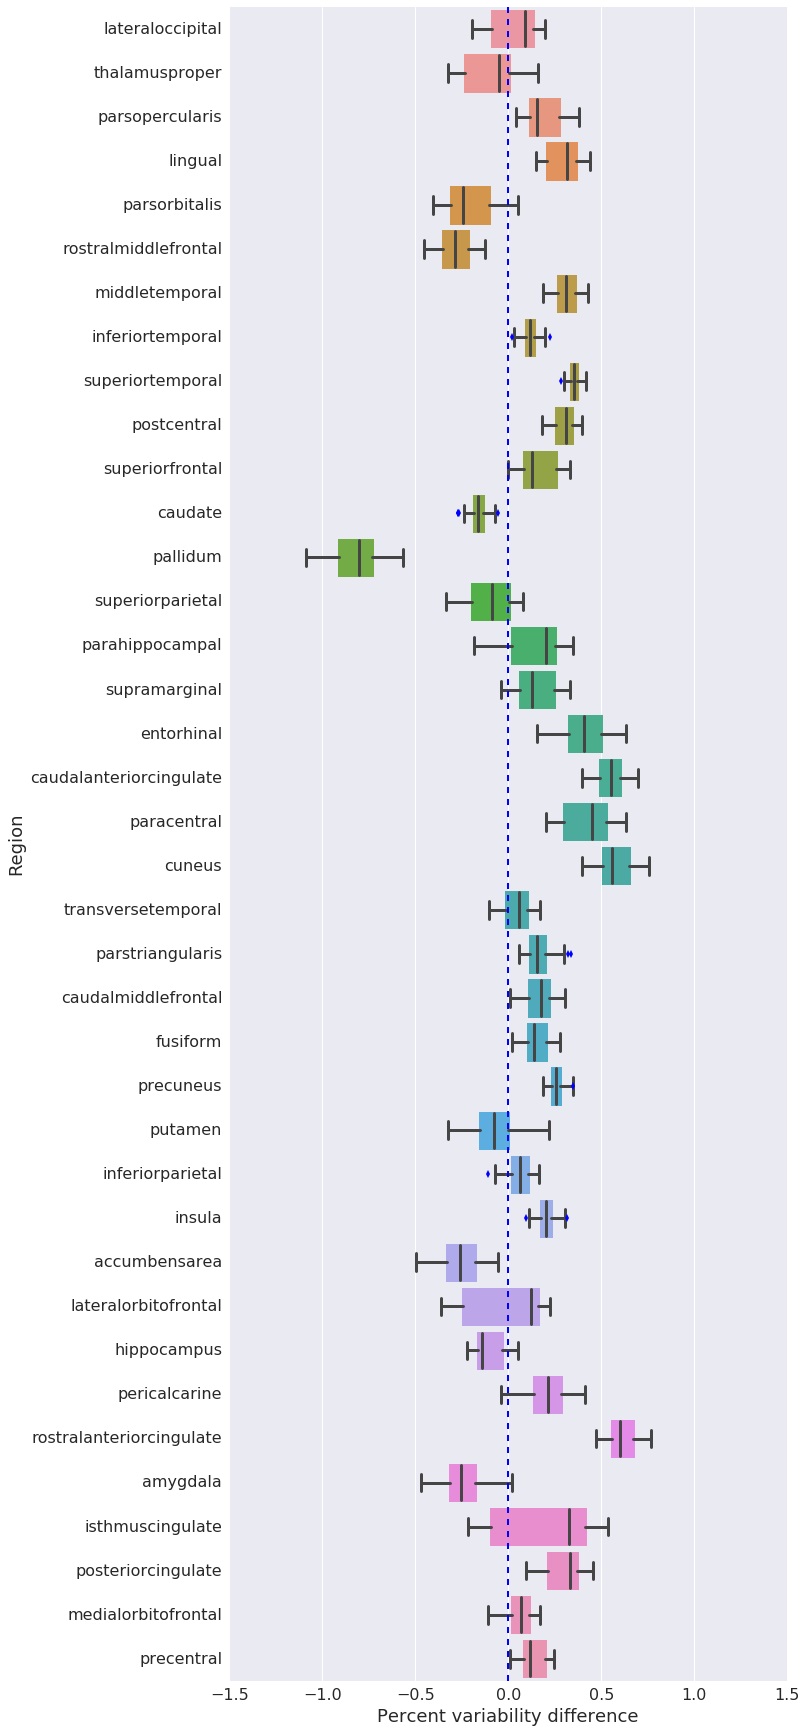
Using Equation 1 on the 120 datasets, we plotted the distribution of the percent variability difference for each structure and tissue in order to assess whether a particular tool overestimates or underestimates the volume with respect to the other. Figure 3 illustrates that the vast majority of structures have a mean value between 0 and 0.5, meaning that both methods provide a similar volumetric measure, which is generally slightly bigger in ANTs than in FreeSurfer. However, regions like the pallidum or the rostral anterior cingulate significantly deviate from this range, being the mean of the former around -0.75 and the mean of the latter around 0.6.
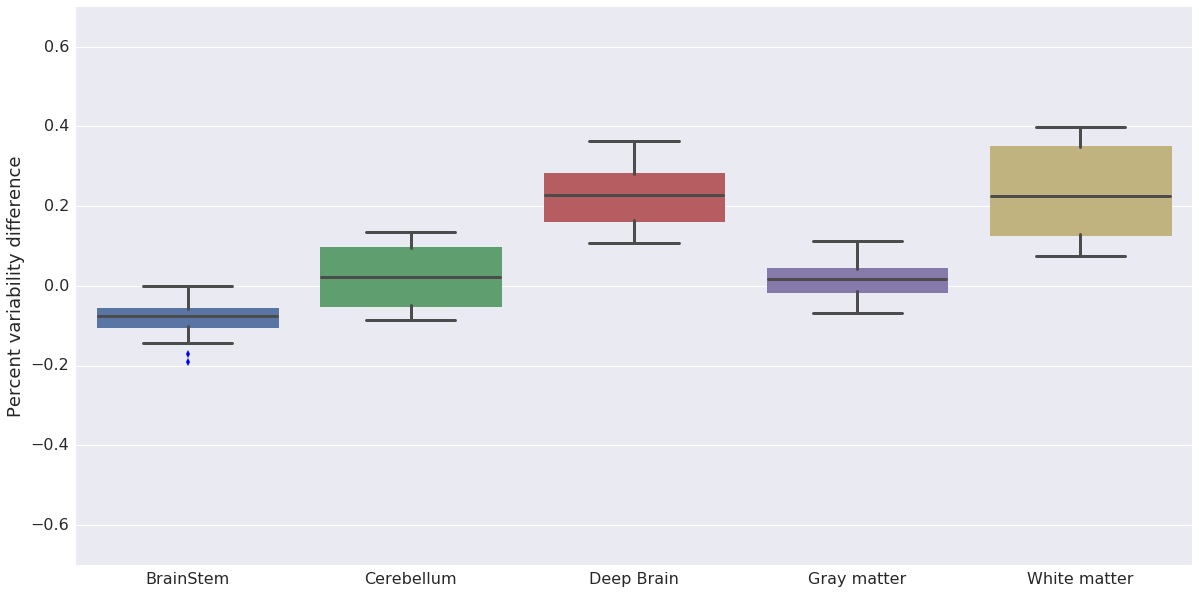
Similarly, we observe in Figure 4 that volumes for deep brain structures and white matter are overestimated in ANTs compared to FreeSurfer, and only the brainstem is slightly overestimated in FreeSurfer compared to ANTs.
Differences between tools were statistically significant for all structures and tissues (except the lateral orbitofrontal) with p-value < 0.001 when using paired T-tests.
Discussion
In this study, we analyzed the reproducibility and differences of FreeSurfer and ANTs for different brain structures as well as generally the WM and GM. We observe that both tools give high reproducibility for volumetric studies and give similar results in most of the examined cases. However, there are few cases where the tools show marked and significant differences. Our results also indicate slightly better reproducibility of ANTs over FreeSurfer. Notwithstanding, this is a preliminary study and more experiments should be performed to understand the nature of the algorithms’ differences.Acknowledgements
No acknowledgement found.References
1. Fischl B, Salat DH, Busa E, Albert M, Dieterich M, Haselgrove C, van der Kouwe A, Killiany R, Kennedy D, Klaveness S, Montillo A, Makris N, Rosen B, Dale AM. (2002). Whole brain segmentation: automated labeling of neuroanatomical structures in the human brain. Neuron 33, 341-355.
2. Avants BB, Tustison NJ, Song G, Cook PA, Klein A, Gee JC. (2011). A Reproducible Evaluation of ANTs Similarity Metric Performance in Brain Image Registration. NeuroImage, 54(3), 2033–2044. http://doi.org/10.1016/j.neuroimage.2010.09.025
3. Maclaren J, Han Z, Vos SB, Fischbein N, Bammer R. (2014). Reliability of brain volume measurements: A test-retest dataset. Scientific Data, 1, 140037. http://dx.doi.org/10.6084/m9.figshare.929651
4. Cox RW. (1996). AFNI: software for analysis and visualization of functional magnetic resonance neuroimages. Comput. Biomed. Res., 29, 3:162-73.
5. Klein A, Tourville J. (2012). 101 labeled brain images and a consistent human cortical labeling protocol. Frontiers in Brain Imaging Methods. 6:171. dx.doi.org/10.3389/fnins.2012.00171
6. Tustison NJ, Avants BB, Cook PA, Zheng Y, Egan A, Yushkevich PA, Gee JC. (2010). N4ITK: improved N3 bias correction. IEEE Trans Med Imaging, 29, 6:1310-20.
7. Avants BB, Tustison NJ, Wu J, Cook PA, Gee JC. (2011). An open source multivariate framework for n-tissue segmentation with evaluation on public data. Neuroinformatics, 9, 4:381-400. doi: 10.1007/s12021-011-9109-y.
8. Mint Labs CloudN neuroimaging platform: https://platform.mint-labs.com/.
9. Tustison NJ, Cook PA, Klein A, Song G, Das SR, Duda JT, Kandel BM, van Strien N, Stone JR, Gee JC, Avants BB. (2014). Large-scale evaluation of ANTs and FreeSurfer cortical thickness measurements. Neuroimage 99, 166–179.
Figures