4680
Microstructural assessment of the cervical spinal cord using high-resolution, 1 dimensional MRI1Imanova, London, United Kingdom, 2Division of Brain Sciences, Imperial College London, London, United Kingdom
Synopsis
A 1-dimensional MR sequence termed Fine Structural Analysis (fineSA) was applied to the human cervical spinal cord in order to determine if spinal tracts and nerve fibres of the dorsal horn could be identified from the spectral regularity of their myeloarchitecture. Repeatable 60 μm peaks could be attributed to the dorsal horn as opposed to projective nerve tracts of the cord. This analysis might be able to identify the loss of neurons via changes in packing density that would be proximal to macrostructural atrophy detectable on more classical MR sequences.
Introduction
Materials and Methods
The fineSA method
uses an orthogonal 90-180 pair of slice-selective pulses to excite a “prism”
that is read out with a strong readout gradient. This produces a 1-dimensional spectrum that
can be decomposed into component frequencies.
The initial validation
phantom used 8 μm ultra-high-molecular-weight polyethylene (UHMWPE) (Dyneema,
DSM Heerlen, NL) fibres wound around a former, as used for diffusion kurtosis
verification3 mimicking white
matter bundles. UHMWPE has little susceptibility shift versus water, but it was
not possible to achieve a regular physical packing (Figure 1). As an alternative, a plastic 3D microgrid was
designed and manufactured in house (Figure 2) using a 3D printer modified to
print small objects at much higher resolution with a custom print head that can
print high temperature nylon.
Phantom and human
cervical cord scans were acquired on a Siemens 3T Tim Trio and Verio (Siemens
Healthcare, Erlangen) using a 10cm loop coil placed behind the neck.
Phantom
prisms were 1x1x10cm, with 4096 readout points in 48ms, giving 0.0244mm resolution
along the prism with 21Hz/pixel bandwidth.
The in-vivo prism used was 1x1x5cm, with 2048 readout points for the
same resolution as phantom scans. 256
averages were acquired with TR=1s, requiring 4m:16s per scan location. Prisms were placed axially at the C3 and C4
level, obliqued to place the long axis of the prism nominally normal to the
right dorsal horn. An additional prism was acquired with the long axis of the
prism along the spinal cord, nominally covering C5 up towards C2.
Results
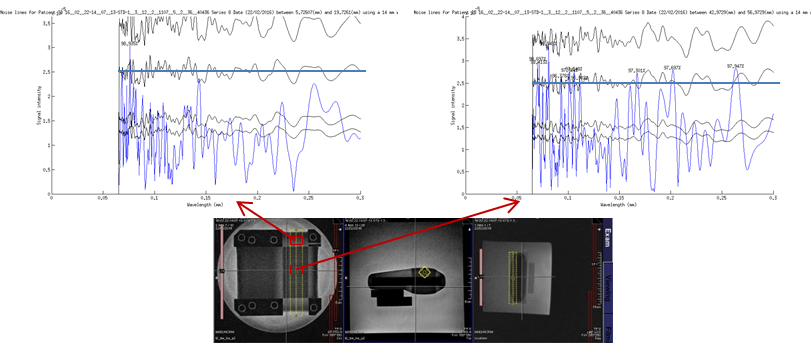
Difficulty in
attaining a regular packing of the 8μm fibres limited interpretability of the
fineSA scans in the diffusion phantom, where multiple regularities were
identified from 80 to 300 μm depending on the pressure applied by the former
plates. The coarser 3D printed structure
was readily and strongly identified at the correct feature sizes.
The in vivo scans
found a strong and reproducible signal at 60 μm between C3 and C5. The dorsal
horn at C3-C5 is characterized by anatomically well-defined crossing bands of
nerve fibres. Thus the scans show expected results for myeloarchitectural
features associated the nerve root entry in the dorsal horn. Consistent with assignment to myelin at root
entry zones, this periodicity was found in the dorsal horn but not elsewhere
across regions interrogated with the prism.
In one additional subject (Figure 4), the spatial frequency was checked
with a vertically positioned prism.
Nerve fibres running along the cord would not be detected in this
position, only the axially running nerve roots.
Discussion
In this study we
demonstrated a repeatable signal at 60 μm periodicity in the spinal cord at the
C3 to C5 levels. The signal was
attributed to the dorsal nerve roots rather than nerve tracts of the cord. We
detected periodicities of appropriate dimensions reproducibly requiring only ~5 min per prism. The dimensions achieved are nearly an order
of magnitude below that which can be achieved with conventional MR imaging,
even at ultra-high field strengths such as 7T.
Acknowledgements
We gratefully acknowledge Acuitas Medical systems
for providing the FineSA sequence and analysis software, and the MS Society for
funding support.
References
2. Kristen
James, S.C., Tim James, Lance Farr, James Raffety, Gareth Thomas MB, David
Chase, Christopher Rogers, Peter Jezzard SG. A new magnetic resonance based
approach to assessment of pathology in early Alzheimer’s disease. In: 7th
Clinical Trials Conference on Alzheimer’s Disease. 2012.
3. Farrher E, Kaffanke J, Celik AA, Stöcker T, Grinberg F, Shah NJ. Novel multisection design of anisotropic diffusion phantoms. Magn Reson Imaging. Elsevier Inc.; 2012;30(4):518–26.
Figures
Figure
1. Phantom constructed of 8 μm wound
fibres. Little structure is found in
wound sections (top left), but when compressed by Perspex plates the increased
packing density results in many periodicities found by FineSA. UHMWPE gives
little MRI signal intensity; it is the fluid between these materials that gives
rise to the FineSA intensities. Although
the material is regular in size, it is the packing that gives rise to the MR
signal and therefore needs to be periodic.
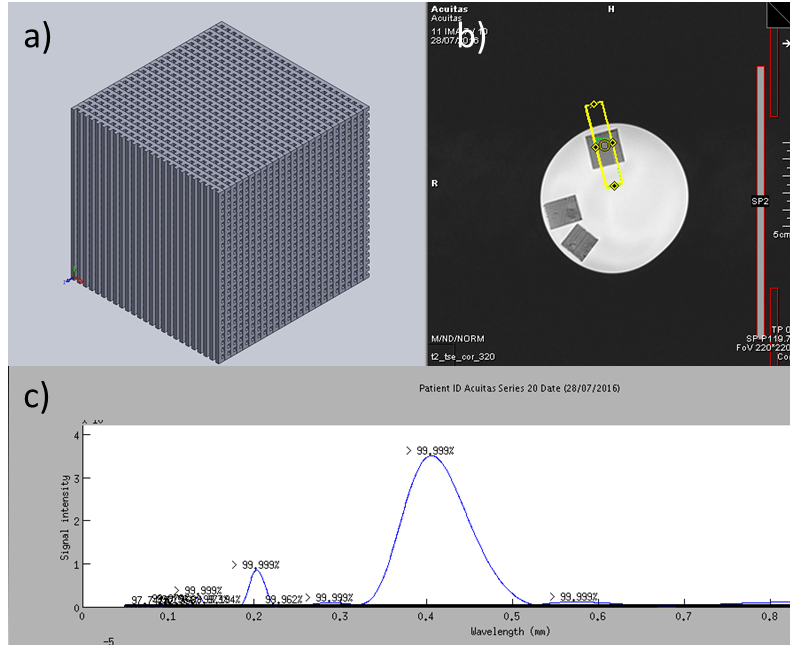
Fig.
2. (a) A 3D printed nylon cube phantom with
small unit dimensions of 400 μm on an edge. Data acquired from the phantom in
plane and parallel to an edge using the prism in (b) showed the expected dominant
spatial periodicity at 0.4 mm (c).
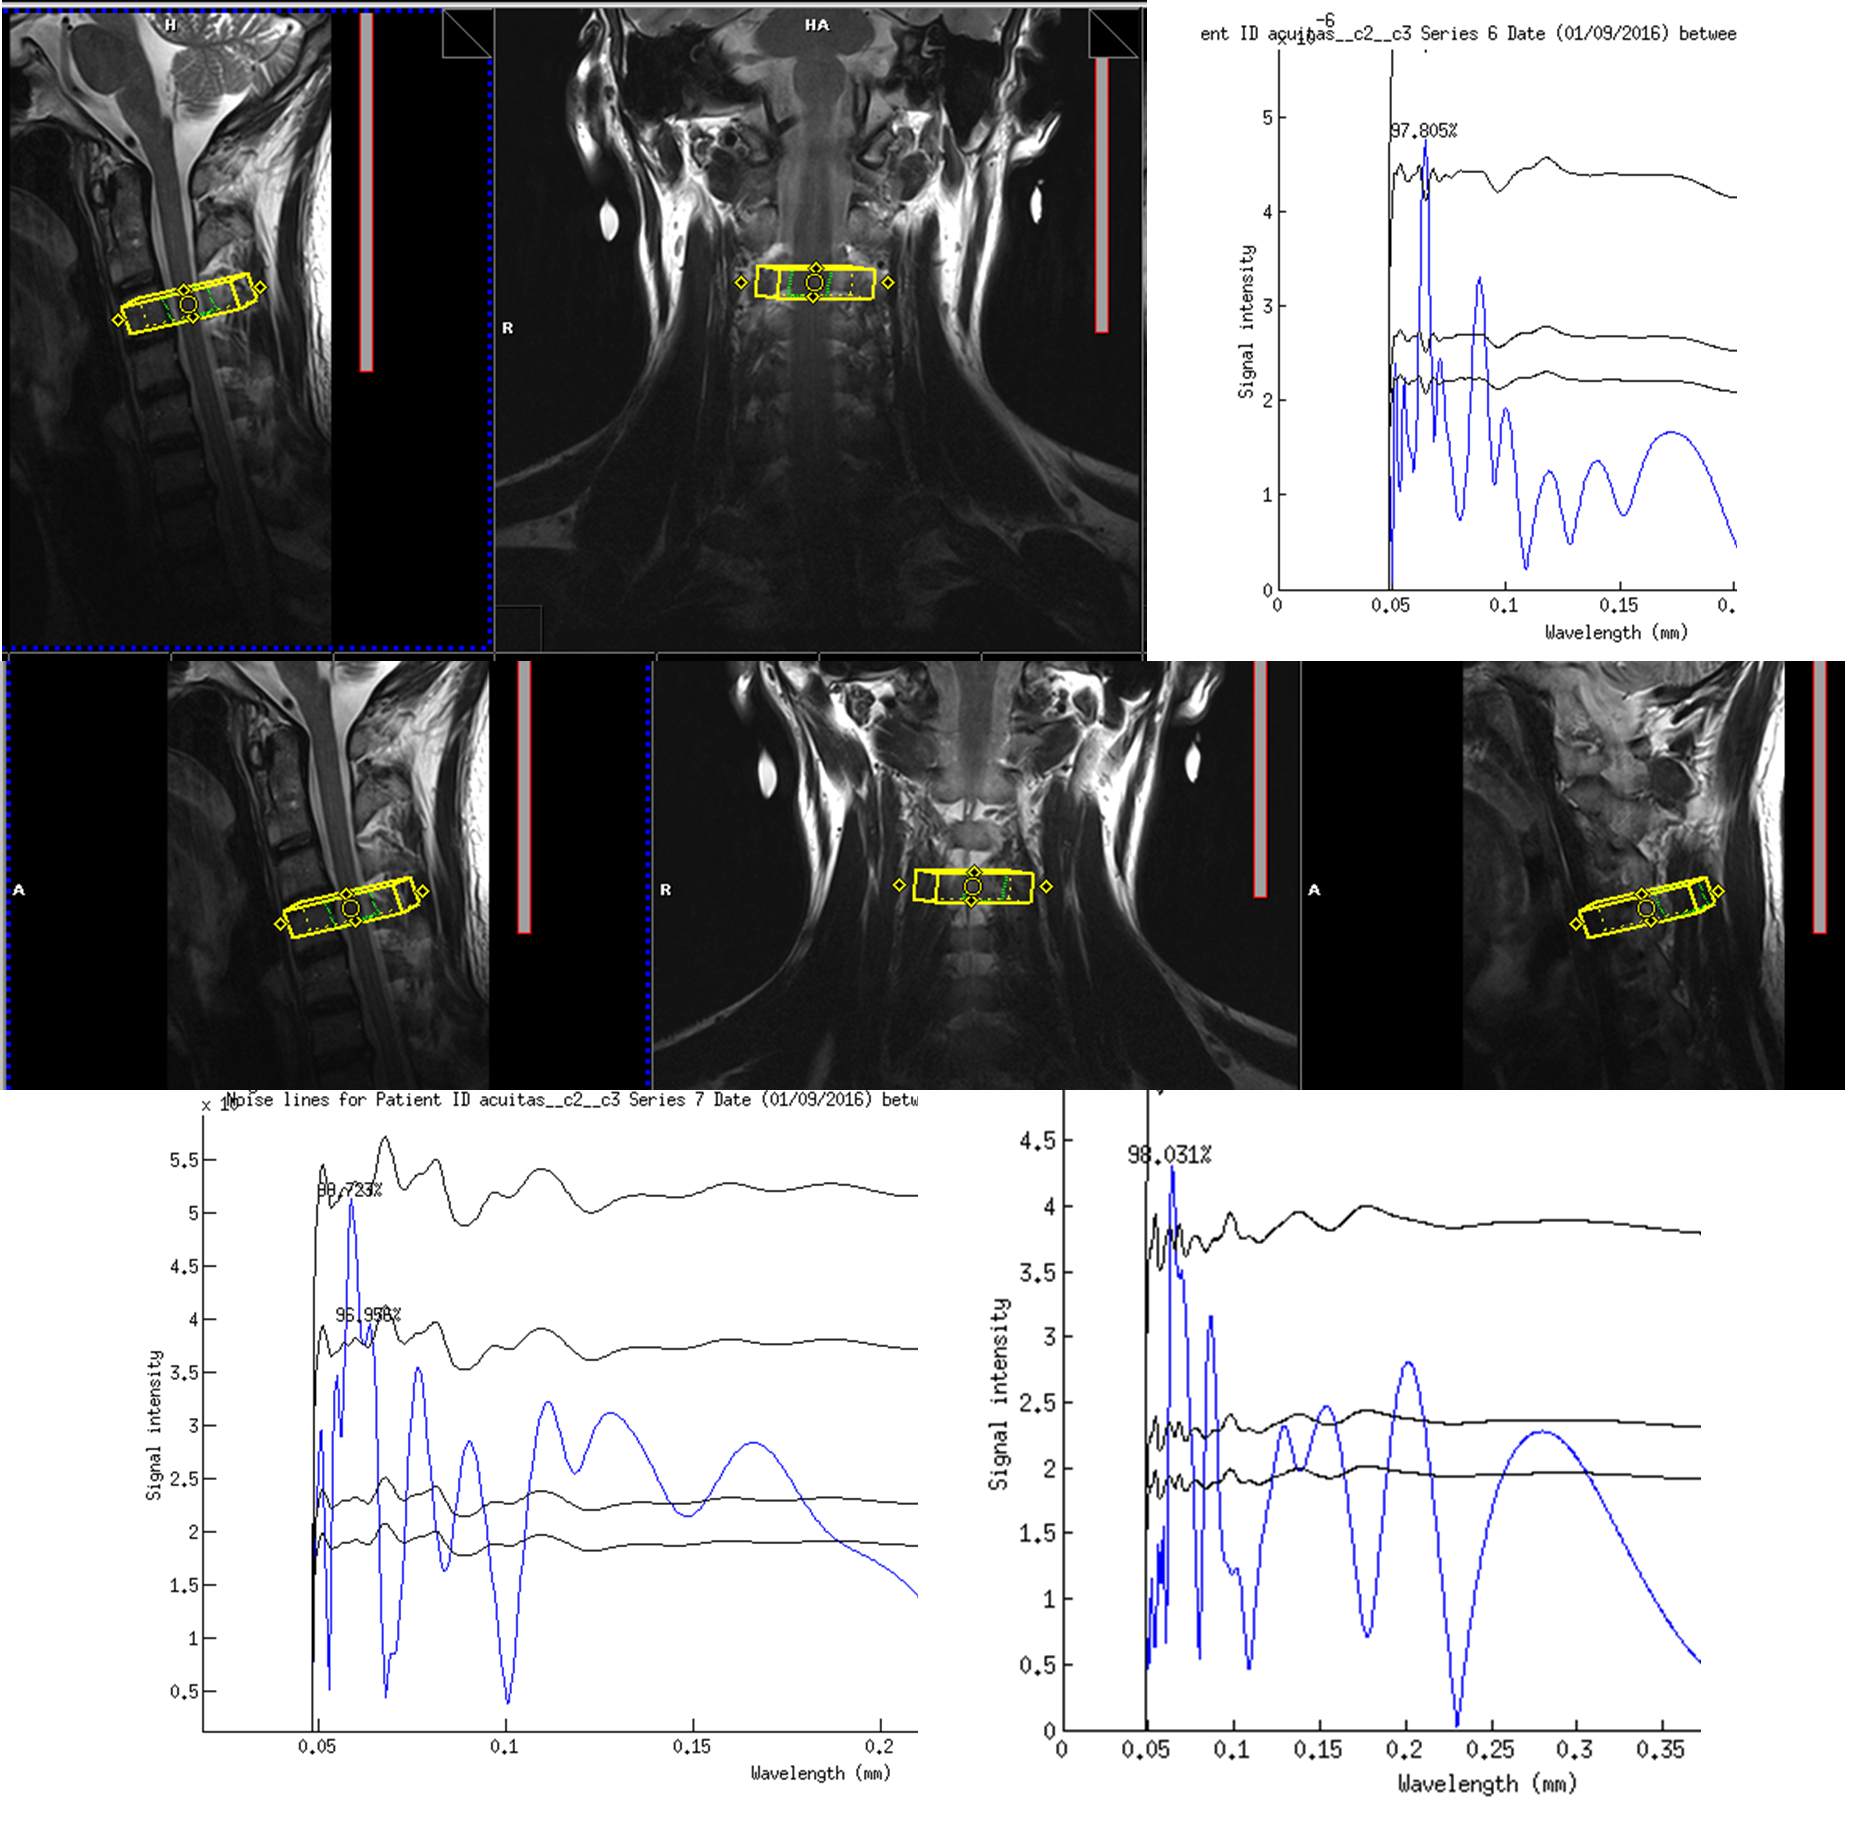
Fig.
3. Using axial prisms angled orthogonal
to the right dorsal horn at C3 (top row) and C4 (middle and bottom row), a
reproducible periodicity at 60 μm is observed with over 98% confidence over the
noise.
Fig
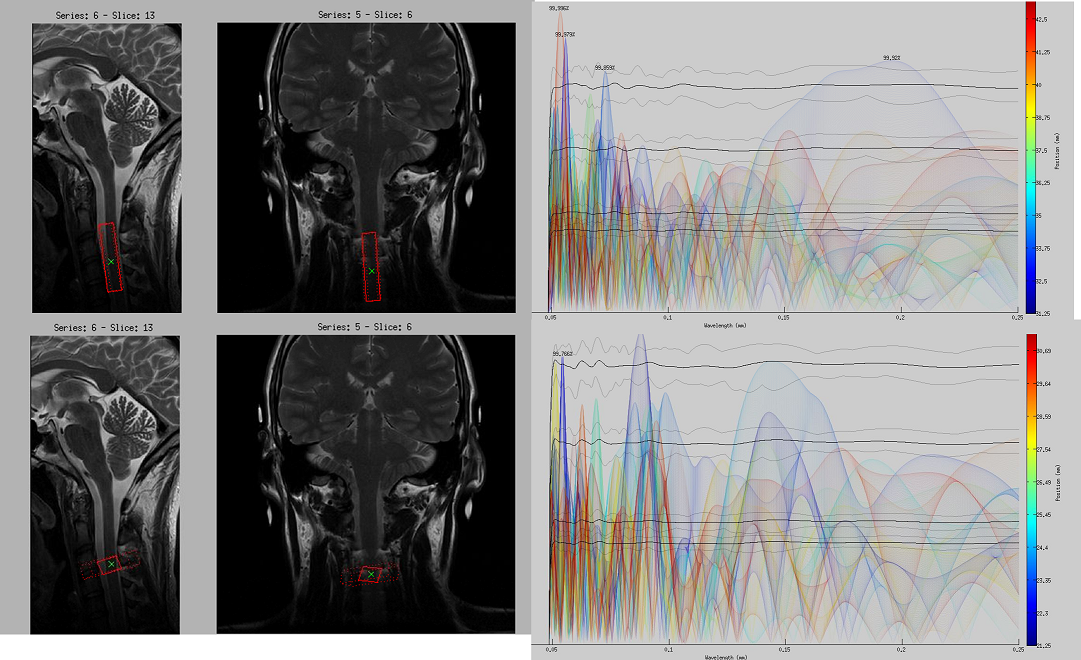
4. A colorized spatial map of
periodicities detected with the T1 weighted one dimensional imaging at the C3
spinal level. The color scale refers to
distance along the imaging prism, which is related to position in the spinal
cord. In the bottom row, the 60 μm peak
appears at 99.8% confidence. Rotating
the prism to follow the spinal cord, the 60 μm peak remains, though other peaks
disappear, consistent with that peak arising from the nerve fibres of the
dorsal horn.