4679
The Utility of DTI and NODDI for Assessment of Disease Severity and in Predicting Postoperative Neuronal Recovery: An Atlas-based Tract Specific StudyTomohiro Takamura1, Ryo Ueda2, Masaaki Hori 1, Ryusuke Irie1, Koji Kamagata1, Michimasa Suzuki1, and Shigeki Aoki1
1Juntendo University, Tokyo, Japan, 2Tokyo Metropolitan University
Synopsis
Quantification of disease severity and prediction of postoperative outcome were essential in management of cervical spondylotic myelopathy (CSM). The purpose of this study was to investigate correlation between diffusion metrics, including DTI or NODDI in spinal cord pathways, and the severity of CSM, as well as their predictive ability for postoperative recovery. We elucidated that the disease severity was significantly correlated with FA and ODI, and postoperative recovery correlated with RD and MD. The lateral funiculi and lateral corticospinal tract seemed to be the predominant spinal cord pathway that correlated with disease severity and postoperative recovery.
Purpose
To investigate correlation between diffusion metrics, including diffusion tensor imaging (DTI) or neurite orientation dispersion and density imaging (NODDI) in spinal cord pathways, and the severity of cervical spondylotic myelopathy (CSM), as well as their predictive ability for postoperative recovery.Methods
Sixteen consecutive patients with CSM (4 women and 12 men; age, 73.9 ± 6.7 years), who underwent laminoplasty at a single institution from August 2014 to May 2016, were studied. The most compressed levels were ranging from the level of C4 to C7 vertebra. Informed consent was obtained from all participants. Patients underwent a MRI examination before and approximately 2 weeks after surgery. Diffusion data were acquired on a clinical 3T-MRI scanner (Discovery 750; GE Medical Systems, Milwaukee, WI, USA): TR/TE, 5000/103 ms; thickness, 3 mm; FOV, 200 ´ 200 mm; matrix size, 256 ´ 256; approximate imaging time of 10 min; 5 b values (0, 500, 1000, 2000, 3000 s/mm2) with diffusion encoding in 6 non-collinear directions for every b value. We generated DTI maps, including axial diffusivity (AD), radial diffusivity (RD), mean diffusivity (MD) and fractional anisotropy (FA), by applying diffusion-weighted images with values of 0 and 1000 sec/mm2. NODDI images, including isotropic volume fraction (Viso), intracellular volume fraction (ICVF), and orientation dispersion index (ODI), were computed by applying diffusion-weighted images with all b values. Clinical data collection included the Japanese Orthopedic Association (JOA) scoring system and the 10-s grip and release test (10-s G&R test) for quantification of disease severity and postoperative recovery rate of JOA score[1]. Postoperative JOA scores were recorded when symptoms were relieved within a year after surgery. Anatomical information of the spinal cord was based on the atlas created by the spinal cord toolbox [2], which creates the regions of interest (ROIs) of specific spinal cord pathways by segmentation, motion correction, registration to white matter atlas, and extraction of regions with correction for partial volume effects automatically. ROIs in the bilateral lateral funiculi (LF), ventral funiculi (VF), dorsal column (DC), lateral corticospinal tract (LCST), whole white matter (WM), and whole gray matter (GM) at C3 were applied for each diffusion map to avoid the potential bias of a misrepresentation at the compressed level. The ROI of the LCST was part of the lateral funiculi, and that of WM was created by adding LF, VF, and DC. Correlations between diffusion metrics and disease severity or JOA recovery rate were analyzed using Spearman’s correlation coefficient. JOA recovery rates were further graded as “good” (>50% recovery rate) or “poor” (<50% recovery rate), and the predictive ability of diffusion metrics for the two groups was assessed by Mann-Whitney U test and receiver operating characteristic (ROC) analysis. P < 0.05 was considered statistically significant.Results
Only FA of GM was significantly correlated with the JOA score, whereas FA of LF, LCST, WM, and GM and ODI of LCST were significantly correlated with the 10-s G&R test score (Table 1). There were no significant correlations between disease severity and AD, RD, MD, Viso, and ICVF. The RD of LF and WM, as well as the MD of LF, DC and LCSTs, were significantly correlated with the JOA recovery rate (Table 2). AD, FA, and NODDI metrics were not significantly correlated with postoperative neuronal recovery. Univariate analysis revealed that the RD of LF, DC, LCST, and WM, as well as the MD of LCST, were significantly different between “good” and “poor” recovery groups. Area under the curve (AUC) for the significant metrics are shown in Table 3. The most predictive diffusion metric was RD of LCST, which showed an AUC of 0.86.Discussion
Our study demonstrated significant correlation between disease severity and FA as well as ODI, especially in the LCST and lateral funiculi (which include LCSTs). As JOA score and 10-s G&R test mainly evaluate motor function, the predominance of these tracts may be understandable. Our results showed that an increase in ODI, which represents a loss of fiber coherence, may be correlated with microstructural damage that causes disease symptoms. Interestingly, only RD and MD could predict postoperative recovery in this study. Myelin clearance at later stages, caused by Wallerian degeneration, contributes to increase in RD [3], and the progression of Wallerian degeneration above compressed levels may cause poor postoperative outcomes.Conclusion
In patients with CSM, disease severity was significantly correlated with FA and ODI, and postoperative recovery correlated with RD and MD. The LFs and LCSTs seemed to be the predominant spinal cord pathway that correlated with disease severity and postoperative recovery.Acknowledgements
No acknowledgement found.References
[1] Hirabayashi K, Watanabe K, Wakano K, Suzuki N, Satomi K, Ishii Y. Expansive open-door laminoplasty for cervical spinal stenotic myelopathy. Spine 1983;8:693-9. [2] De Leener B, Levy S, Dupont SM, Fonov VS, Stikov N, Louis Collins D, et al. SCT: Spinal Cord Toolbox, an open-source software for processing spinal cord MRI data. NeuroImage 2016. [3] Zhang J, Jones M, DeBoy CA, Reich DS, Farrell JA, Hoffman PN, et al. Diffusion tensor magnetic resonance imaging of Wallerian degeneration in rat spinal cord after dorsal root axotomy. The Journal of neuroscience : the official journal of the Society for Neuroscience 2009;29:3160-71.Figures
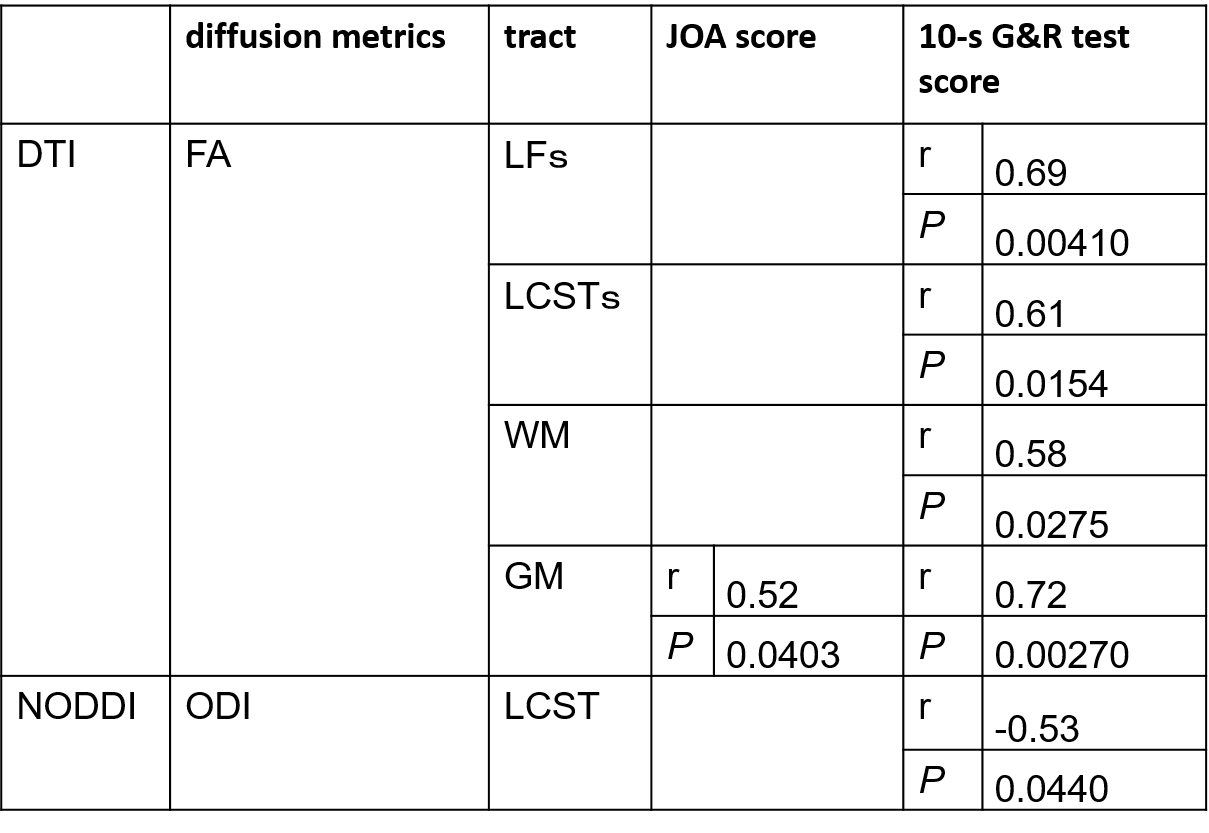
Table
1: Correlation between DTI and NODDI
parameters at C3 level and preoperative disease severity. Spearman’s
correlation coefficients with P < 0.05 are
displayed.
LFs, bilateral
lateral funiculi; LCSTs, bilateral lateral corticospinal
tract; WM, whole white matter; GM, whole
gray matter at C3 level.
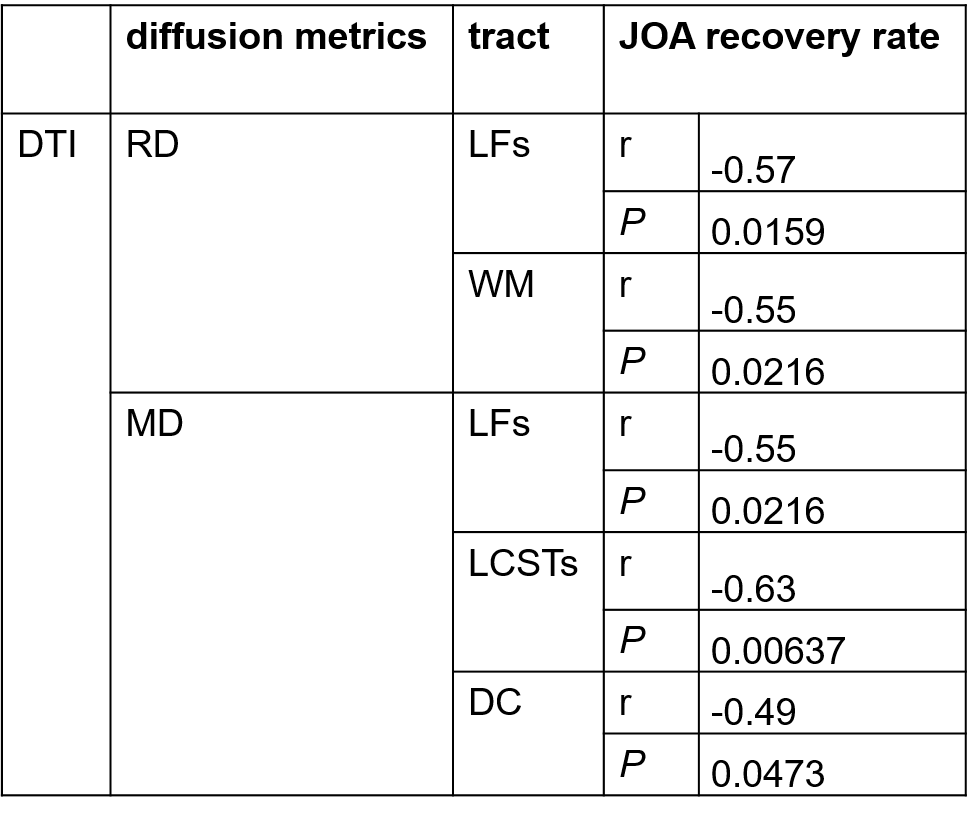
Table
2: Significant diffusion metrics
which correlated with JOA recovery rate. Spearman’s correlation coefficients
with P <
0.05 are displayed.
DC, dorsal column.
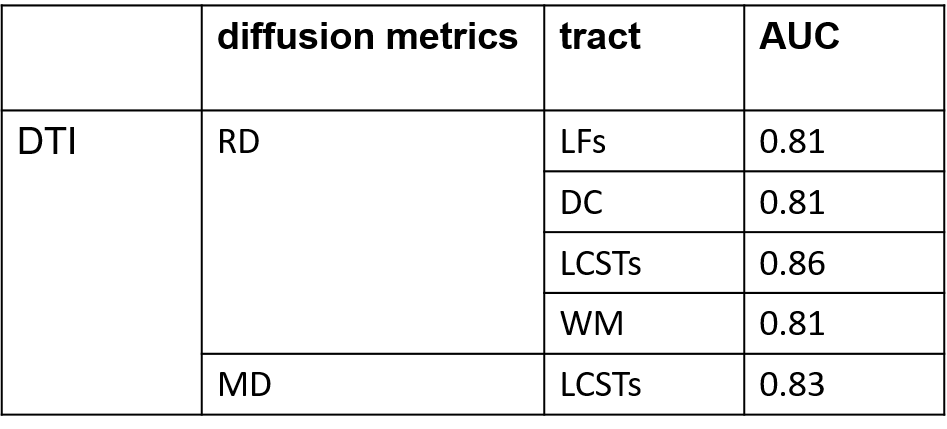
Table 3.
Area under the curve (ACU) for the significant diffusion metrics in predicting the
“good” and “poor”
postoperative recovery.
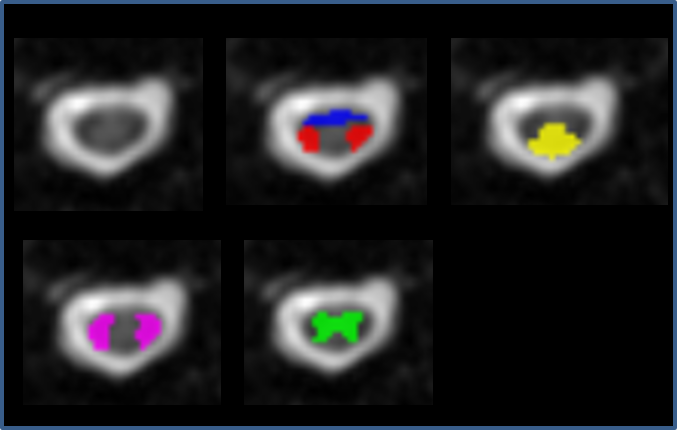
Fig. 1. Automatically created ROIs of LFs (purple),
VFs (blue), LCSTs (red), DC (yellow) and GM (green) at C3 level overlaid on the
b0 image.