4677
Investigating trauma-induced microstructural changes at the lumbosacral enlargement after spinal cord injury1Spinal Cord Injury Center, Balgrist University Hospital, Zurich, Zurich, Switzerland, 2Department of Neurophysics, Max Planck Institute for Human Cognitive and Brain Sciences, Leipzig, Germany, 3Wellcome Trust Centre for Neuroimaging, UCL Institute of Neurology, London, United Kingdom, 4Department of Systems Neuroscience, University Medical Center Hamburg-Eppendorf, Hamburg, Germany
Synopsis
Neuroimaging of the cervical cord has demonstrated above-level neurodegeneration after traumatic spinal cord injury. In this study, we investigated below-level neurodegeneration with optimized high-resolution MRI sequences, including diffusion tensor imaging and structural imaging, applied to the lumbar cord in patients with cervical injury. Our results demonstrate that atrophy and axonal degeneration are prominent in the lumbar cord reflected by structural and diffusivity changes. Furthermore, the extent of these changes is related to clinical impairment. This study shows neurodegeneration below the level of injury and demonstrates the clinical feasibility of acquiring readouts of tissue-specific changes in the lumbar cord.
Introduction
Spinal cord diffusion tensor imaging (SC-DTI) provides sensitive tools to investigate various disorders affecting the spinal cord. In spinal cord injury (SCI), previous investigations have demonstrated microstructural changes in the injured cord above the level of injury reflected by lower fractional anisotropy and higher mean diffusivity values1. However, technical challenges including low SNR, relative position of the cord to the coil and high anatomical variability have prevented reliable measurements in the lumbar cord, and the clinical feasibility of obtaining high-resolution DTI images at the lumbosacral enlargement has been only recently demonstrated2. In this study, we assess trauma-induced and tissue-dependent macro- and microstructural changes in the lumbar region of the spinal cord below a traumatic injury to the spinal cord, similar to those already observed above the level of injury in the cervical cord.Methods
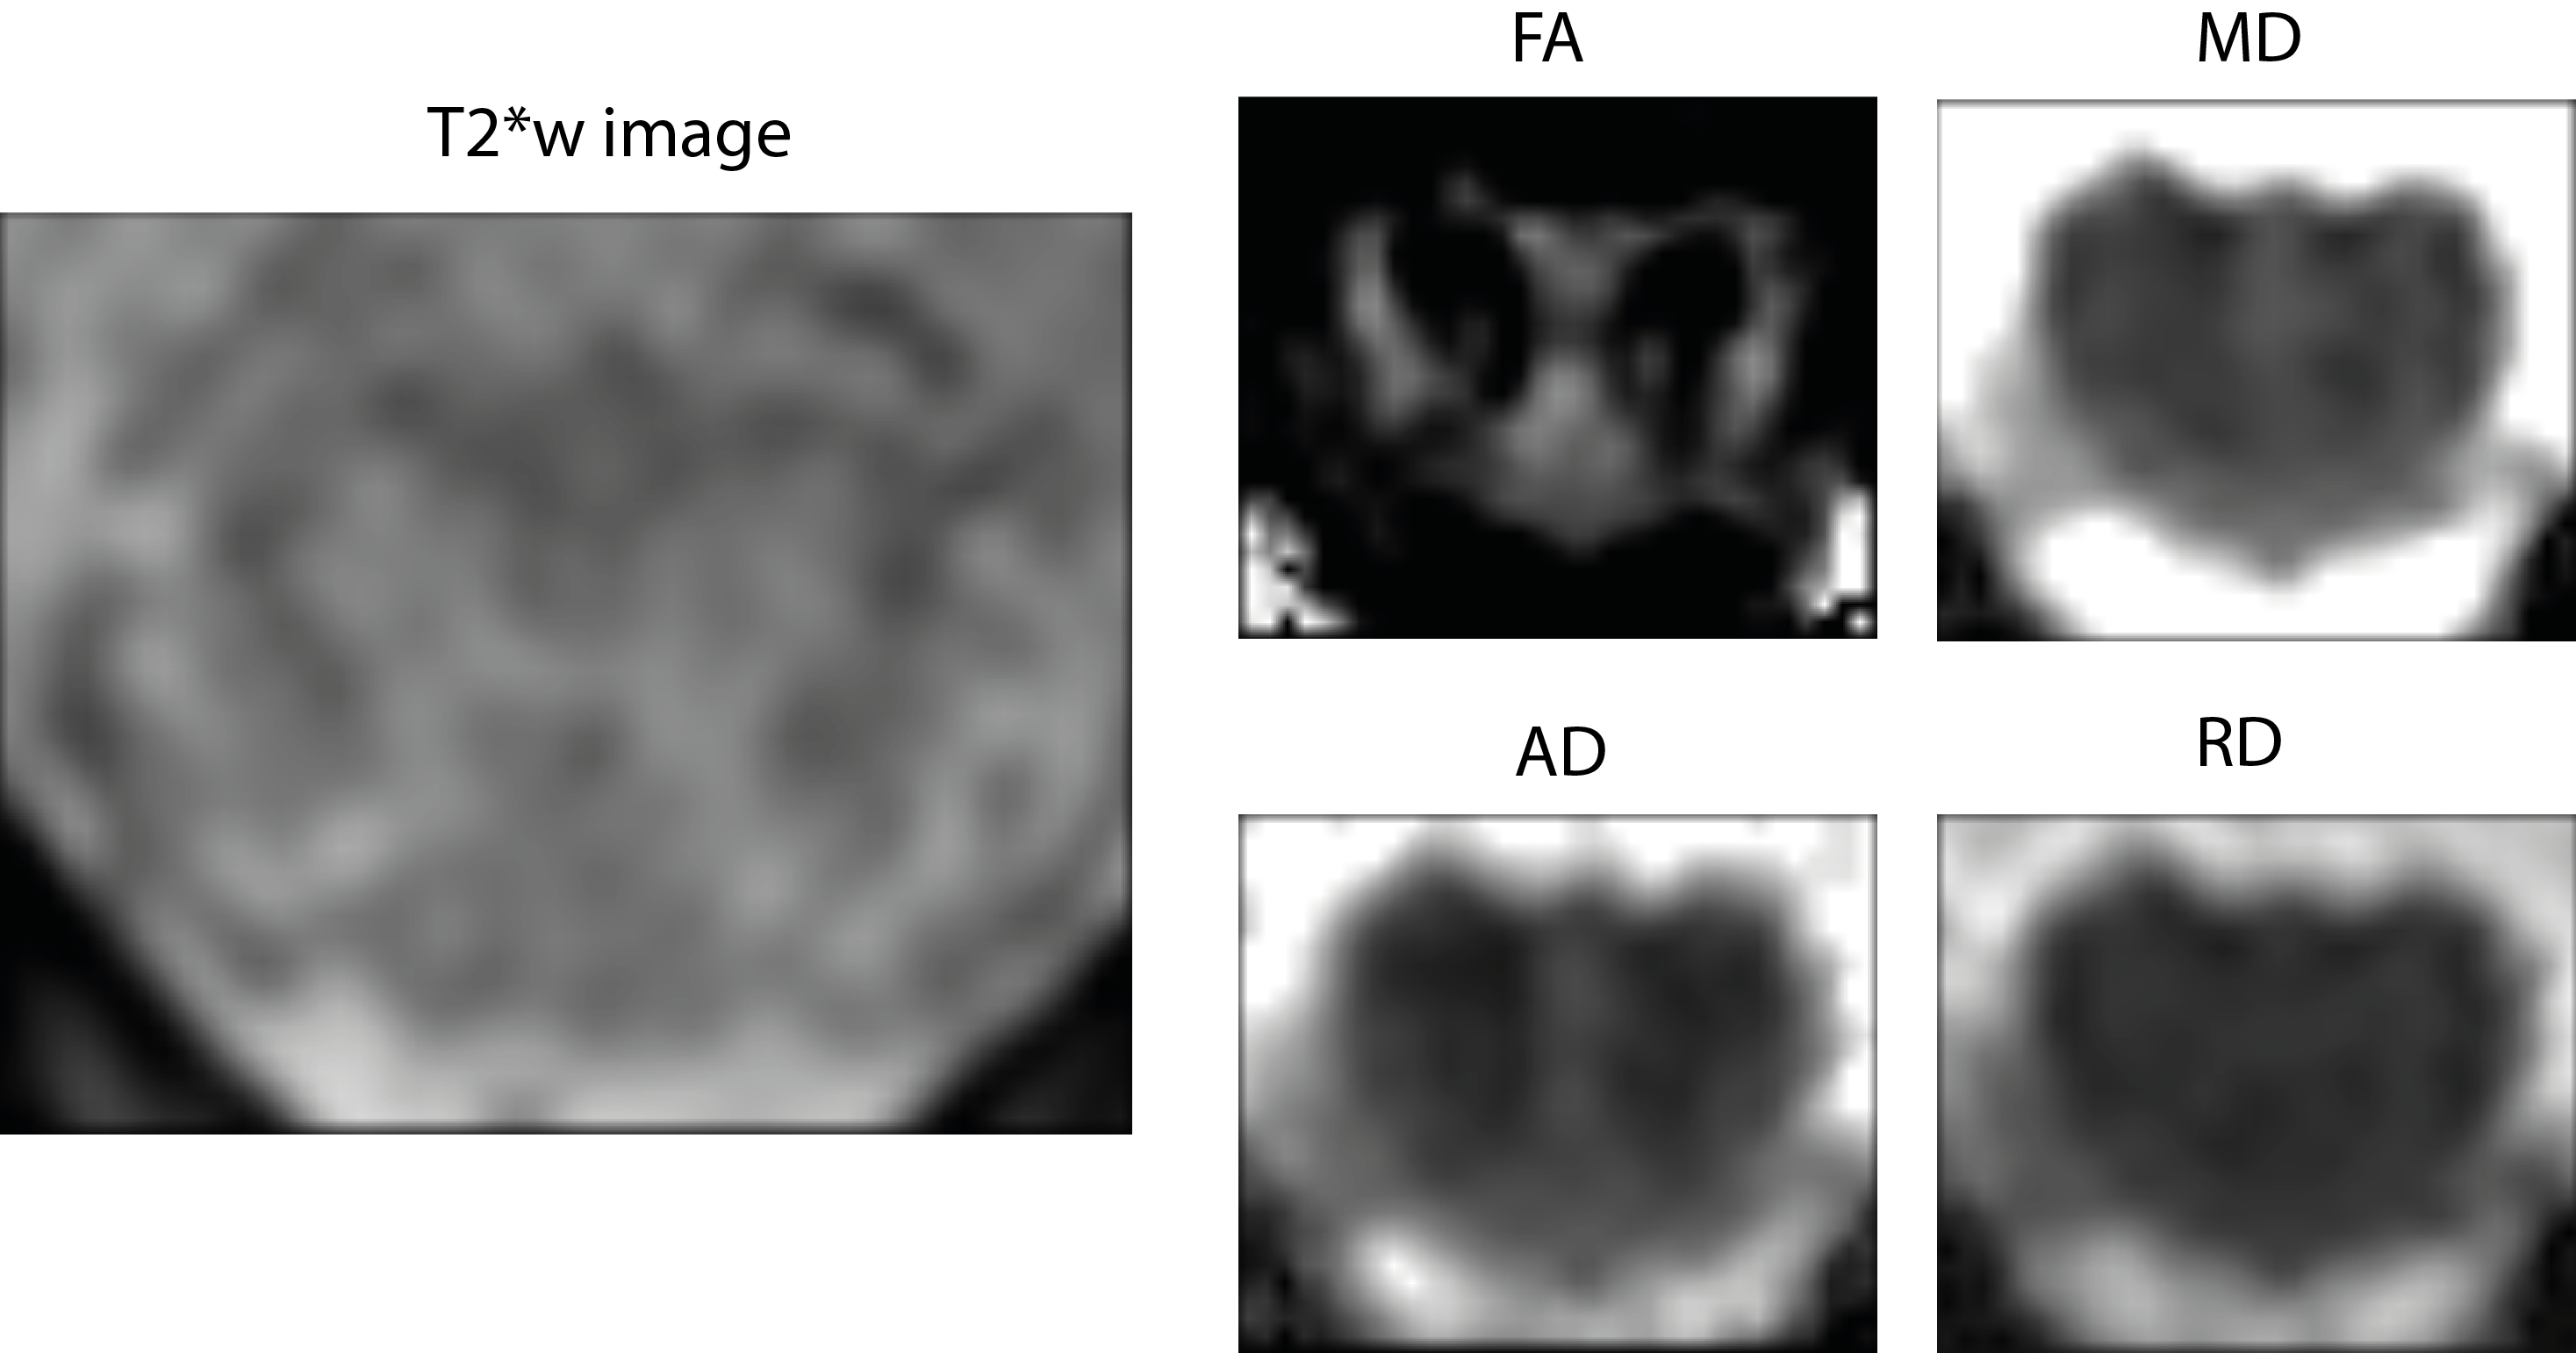
A total of 12 SCI patients and 13 controls were scanned on a clinical 3T Siemens SkyraFIT system. All SCI patients had tetraplegia and three of them were classified AIS A (i.e. complete)3. For slice prescription, a conventional sagittal T2-weighted image of the lumbar cord was acquired. Then, a T2*-weighed 3D multi-echo spoiled GRE image was acquired in the axial-oblique plane and centered at the widest point of the lumbar cord (lumbosacral enlargement) as appearing in the T2-weighted image. Following parameters were used: 10 slices, resolution=0.5x0.5x5 mm3, inter-slice gap=0.5 mm, FOV=192x162 mm2, TE=19 ms, TR=44 ms, flip angle=11°, acquisition time=2:08 min. Diffusion tensor imaging (DTI) data were acquired using a cardiac-gated reduced-FOV single-shot spin-echo EPI (ss-EPI) sequence with identical slice prescription as the T2*-weighed image, and consisting of 60 diffusion-weighted (b=500 s/mm2) and 7 T2w (b=0 s/mm2) volumes. Acquisition parameters were: resolution=0.76x0.76x5 mm3, FOV=133 x 30 mm2, TE=73 ms, TR=350 ms. The total acquisition time was approximately 15 min, depending on the participant's heart rate. DTI scalar maps including fractional anisotropy (FA), mean diffusivity (MD), axial (AD) and radial diffusivity (RD) were obtained using the ACID toolbox4. To ensure reproducible anatomical location for the analysis, only three slices covering the lumbosacral enlargement were considered5. To allow for tissue-specific analysis, the spinal cord (SC), gray (GM) and white matter (WM) were segmented semi-automatically for the T2*w image (JIM 7.0, Xinapse systems) and manually based on the averaged b=0 volume for the DTI scalar maps. DTI maps were averaged within the three ROIs and cross-sectional spinal cord (SCA), white matter (WMA), and gray matter (GMA) area were calculated based on the T2*-weighed image. Group-level differences were assessed in STATA 14 (StataCorp LP.) using two-sample t-test (one-tailed, α=0.05).Results
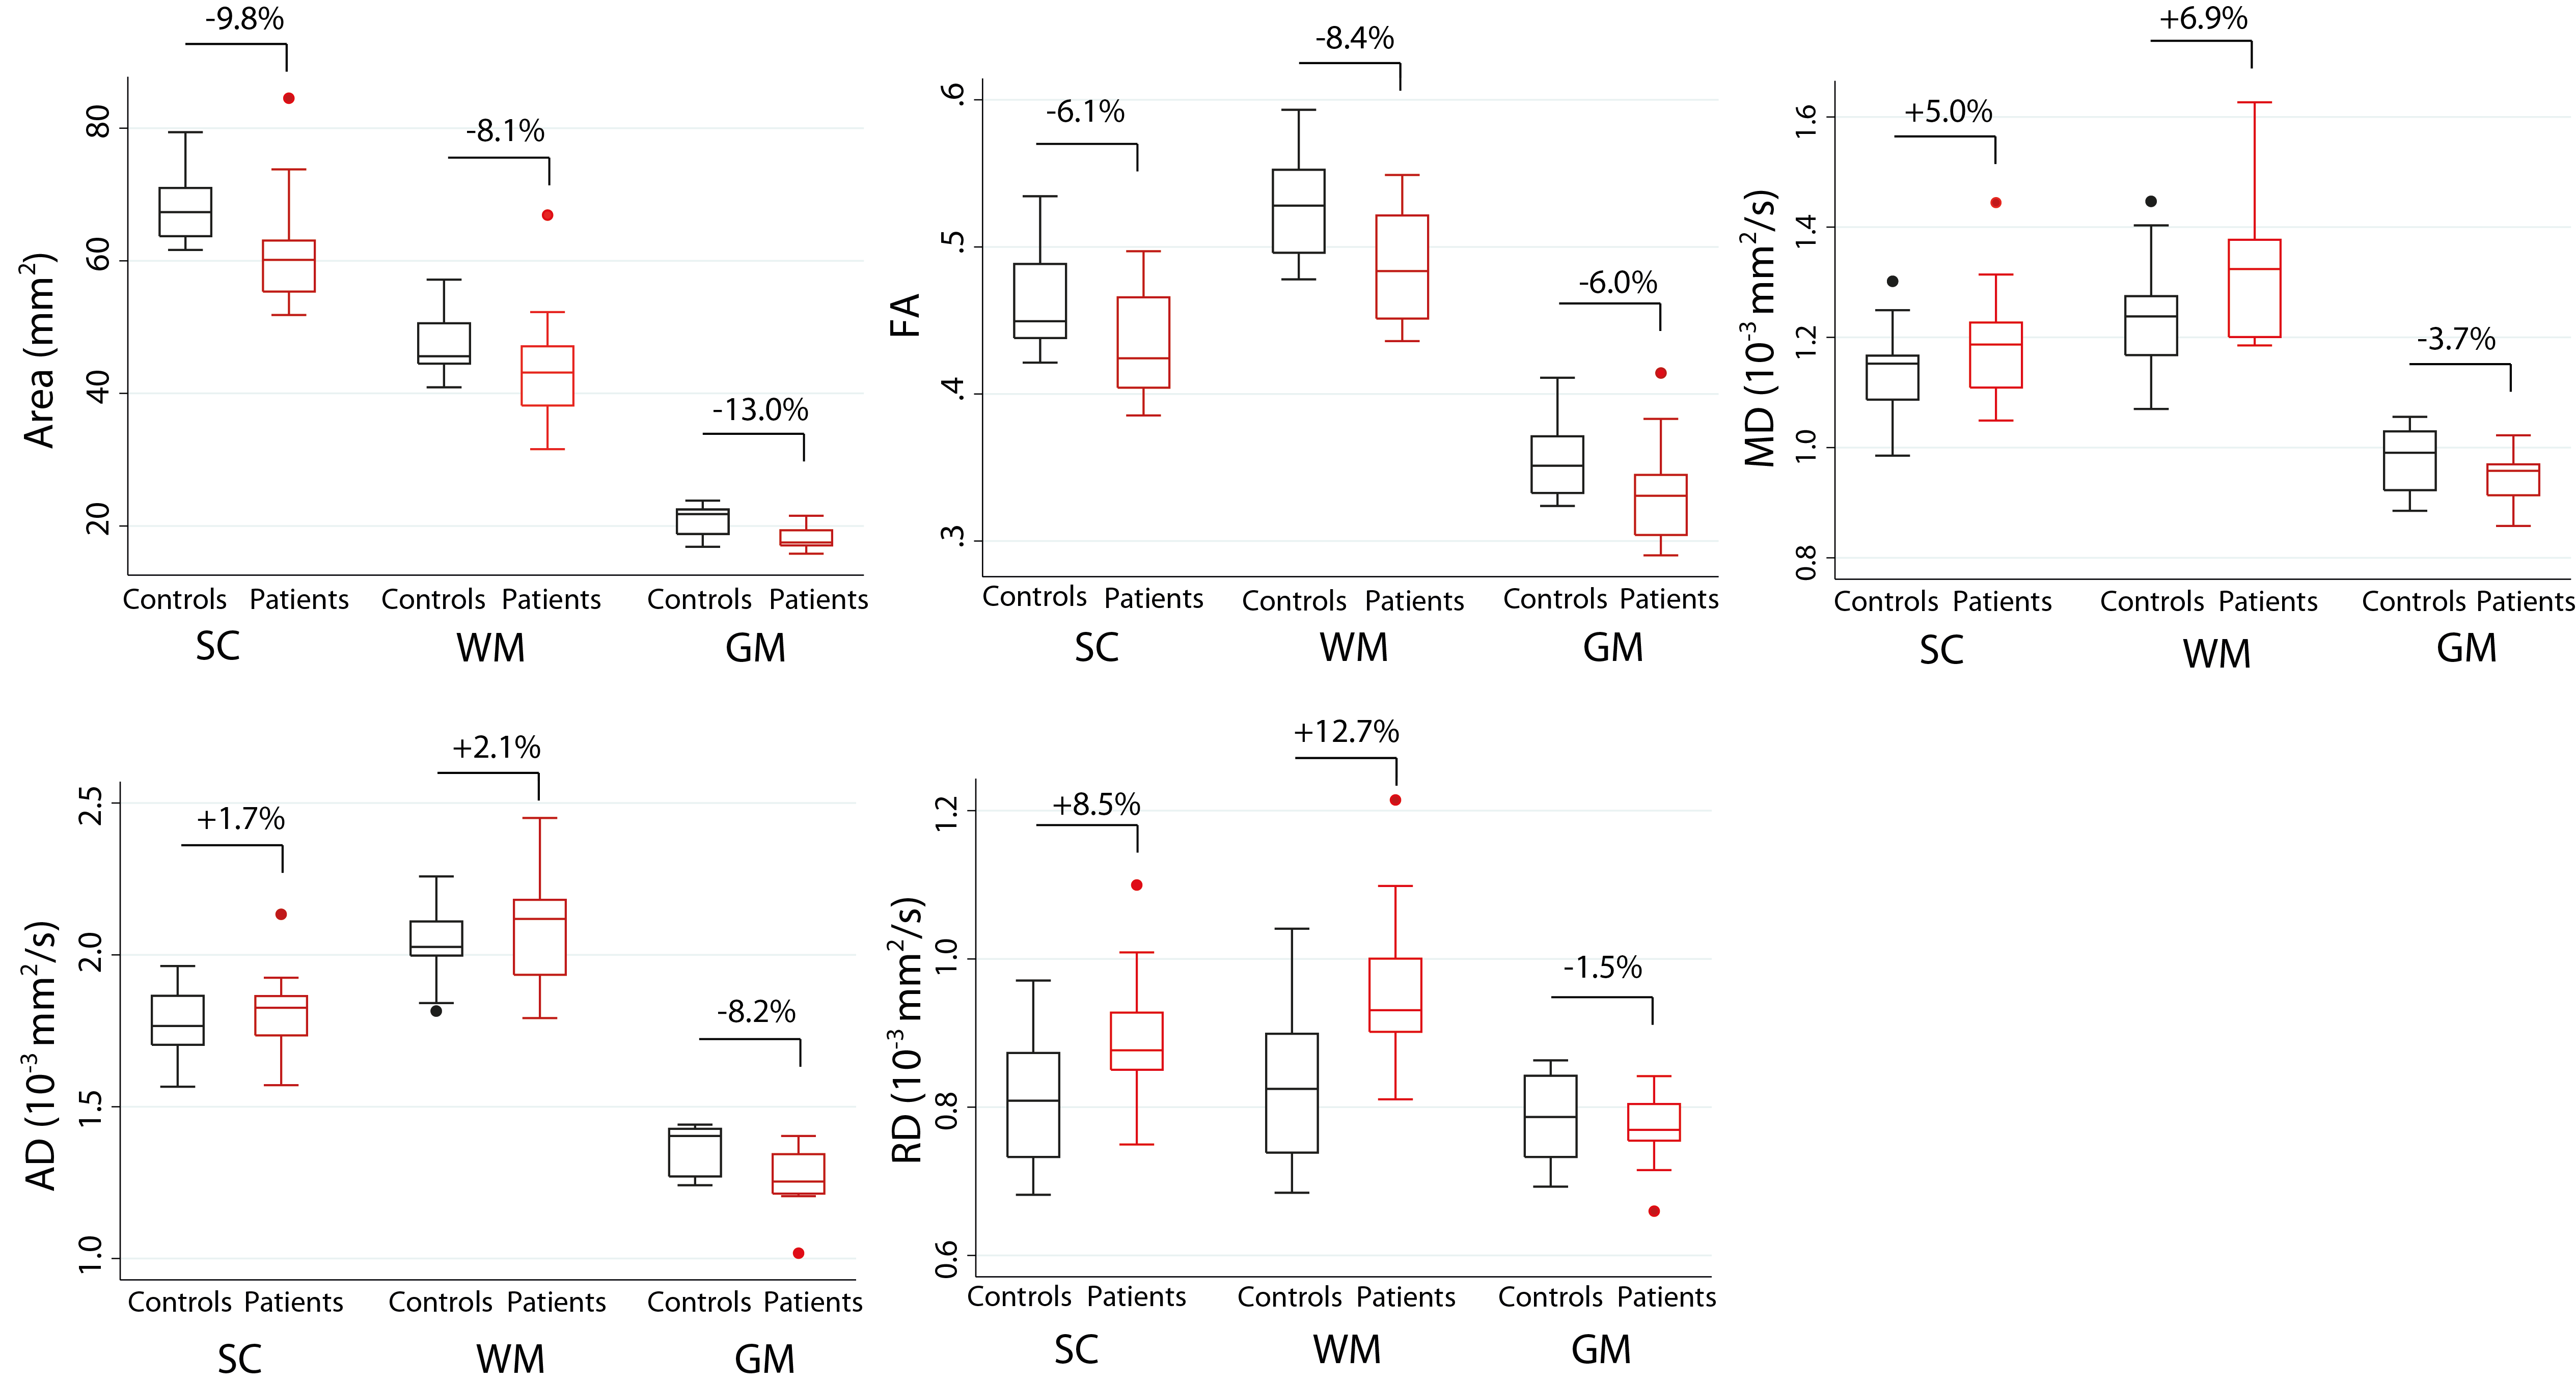
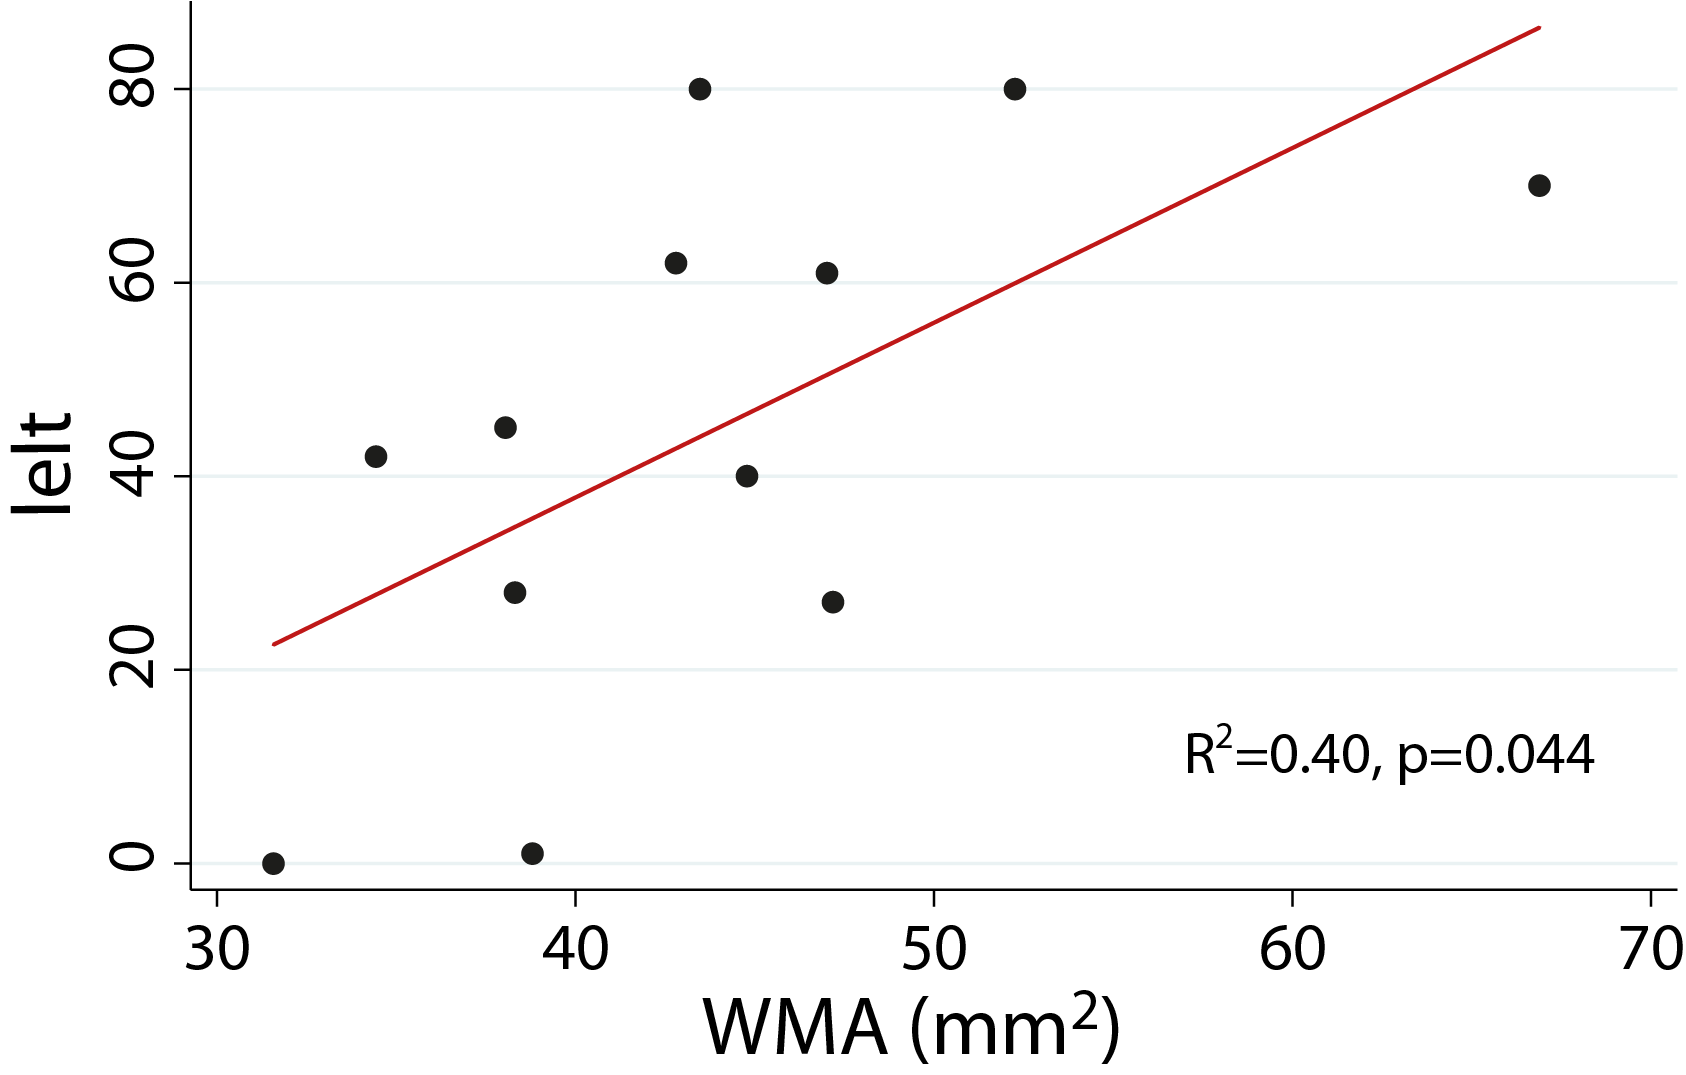
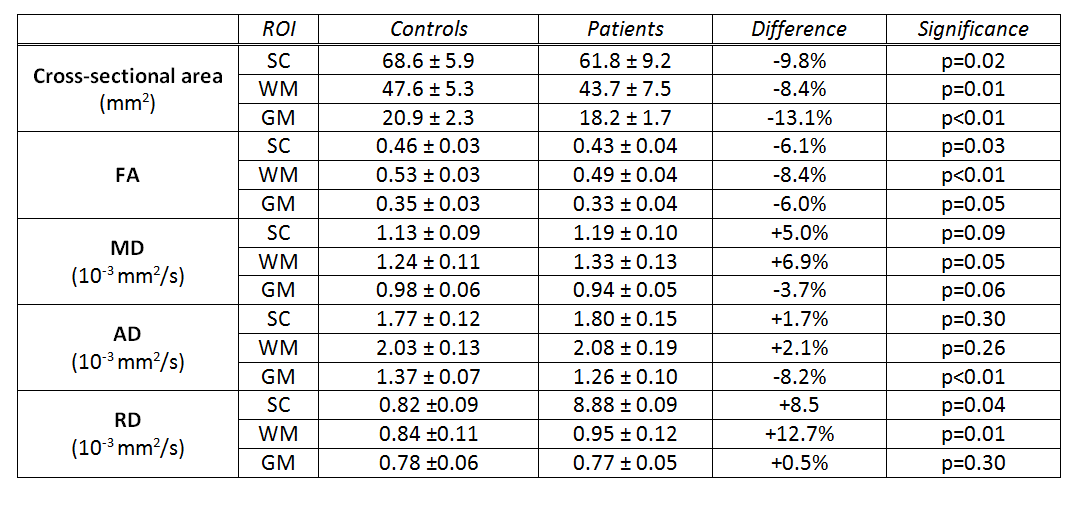
Results are listed in Table 1. and illustrated in Figure 2. In the white matter, patients had lower cross-sectional area (p=0.01) and FA values (p<0.01), and higher MD (p=0.05) and RD values (p=0.01) compared to controls. In the gray matter, patients had lower cross-sectional area (p<0.01), FA (p=0.05) and AD values (p<0.01). Furthermore, white matter area correlated significantly with ASIA lower extremity light touch score (R2=0.40, p=0.044) (Figure 3).Discussion
Besides atrophic changes in the gray and white matter, our work highlights tissue-specific neurodegeneration in SCI patients assessed by high-resolution DTI at the lumbosacral enlargement. These observations provide evidence of remote degenerative changes occurring below the level of lesion. Although both gray and white matter are smaller in patients, results suggest more pronounced degeneration in the gray matter. In the white matter, lower FA and higher MD values in patients were driven by an increase in RD, which might reflect axonal degeneration and demyelination. The gray matter in patients had qualitatively different diffusion alteration with similarly lower FA, which was driven by a decrease in AD values rather than an increase in RD. Given the lack of small animal and ex-vivo studies, the pathophysiological interpretation of the DTI changes in the gray matter is more difficult. The clinical eloquence of the observed alterations is reflected by clinical pathological relationships (ASIA score). The sensory impairment is related to the area of the conducting white matter, while MRI readouts were not significantly related to motor impairment.Conclusion
This paper shows the clinical feasibility of assessing macro- and microstructure below the level of injury in SCI patients. The accuracy and sensitivity for disease-specific changes underline the potential of lumbar cord MRI readouts to supplement clinical scores.Acknowledgements
No acknowledgement found.References
(1) Freund P, Wheeler-Kingshott C, Jackson J, Miller D, Thompson A, Ciccarelli O. Recovery after spinal cord relapse in multiple sclerosis is predicted by radial diffusivity. Multiple Sclerosis (Houndmills, Basingstoke, England). 2010;16(10):1193-1202.
(2) Yiannakas MC, Grussu F, Louka P, Prados F, Samson RS, Battiston M, Altmann DR,Ourselin S, Miller DH, Gandini Wheeler-Kingshott CA. Reduced Field-of-View Diffusion-Weighted Imaging of the Lumbosacral Enlargement: A Pilot In Vivo Study of the Healthy Spinal Cord at 3T. PLoS One. 2016 Oct 14;11(10):e0164890.
(3) Kirshblum SC, Burns SP, Biering-Sorensen F, Donovan W, Graves DE, Jha A, Johansen M, Jones L, Krassioukov A, Mulcahey MJ, Schmidt-Read M, Waring W. International standards for neurological classification of spinal cord injury (revised 2011). J Spinal Cord Med. 2011 Nov;34(6):535-46.
(4) Mohammadi S, Hutton C, Nagy Z, Josephs O, Weiskopf N (2012), Retrospective correction of physiological noise in DTI using an extended tensor model and peripheral measurements. Magnetic Resonance in Medicine, (in press); doi: 10.1002/mrm.24467.
(5) Yiannakas MC, Kakar P, Hoy LR, Miller DH, Wheeler-Kingshott CA. The use of the lumbosacral enlargement as an intrinsic imaging biomarker: feasibility of grey matter and white matter cross-sectional area measurements using MRI at 3T. PLoS One. 2014 Aug 29;9(8):e105544.
Figures