4675
Feasibility of Grey Matter and White Matter Segmentation of the Conus Medullaris: A Pilot In Vivo Investigation in the Neurologically Intact Spinal Cord1UCL Institute of Neurology, Queen Square MS Centre, University College London, London, United Kingdom, 2UCL Institute of Neurology, Uro-Neurology, Department of Brain Repair & Rehabilitation, University College London, London, United Kingdom, 3Translational Imaging Group, Centre for Medical Image Computing, Department of Medical Physics and Biomedical Engineering, University College London, London, United Kingdom
Synopsis
Spinal cord (SC) atrophy as a consequence of neurodegeneration, and its association with clinical scores of disability, may be assessed indirectly by means of cord, grey matter (GM) and white matter (WM) segmentation from magnetic resonance images. Neuropathological evidence suggests that in certain neurological conditions, early degeneration may occur as low as the sacral SC, potentially implicating neural pathways that are essential for the functioning of the lower urinary tract. In this work, the feasibility of GM/WM segmentation of the conus medullaris is assessed in vivo using a clinical 3T system.
Introduction
Grey/white matter (GM/WM) cross-sectional area (CSA) measures are established magnetic resonance imaging (MRI) measures to assess atrophy (i.e. tissue loss, neurodegeneration) of the upper spinal cord (SC). These markers proved to be related with measures of physical disability1,2. Recent MRI developments have demonstrated the feasibility of obtaining similar measures in the lower SC3. Considering the positional variation of the lower SC relative to the spine, the identification of the lumbosacral enlargement (LSE) has been suggested as an intrinsic imaging biomarker for assessments of neurological segments relevant for the functioning of the lower limbs and the lower urinary tract (LUT)3. However, neuropathological evidence suggests that in certain conditions early degeneration may occur also below the level of the LSE4, potentially causing LUT symptoms. Corresponding imaging assessments need to be established to study the conus medullaris (CM) in vivo and overcoming the technical challenges due to the diminishing size of this structure when moving caudally. In this work, the feasibility of tissue-specific segmentation of the CM is assessed in vivo using a clinical 3T-MRI system. Corresponding measurements are provided for the LSE in order to compare with previous work3 and facilitating the interpretation of the results obtained here in the CM segment.Methods
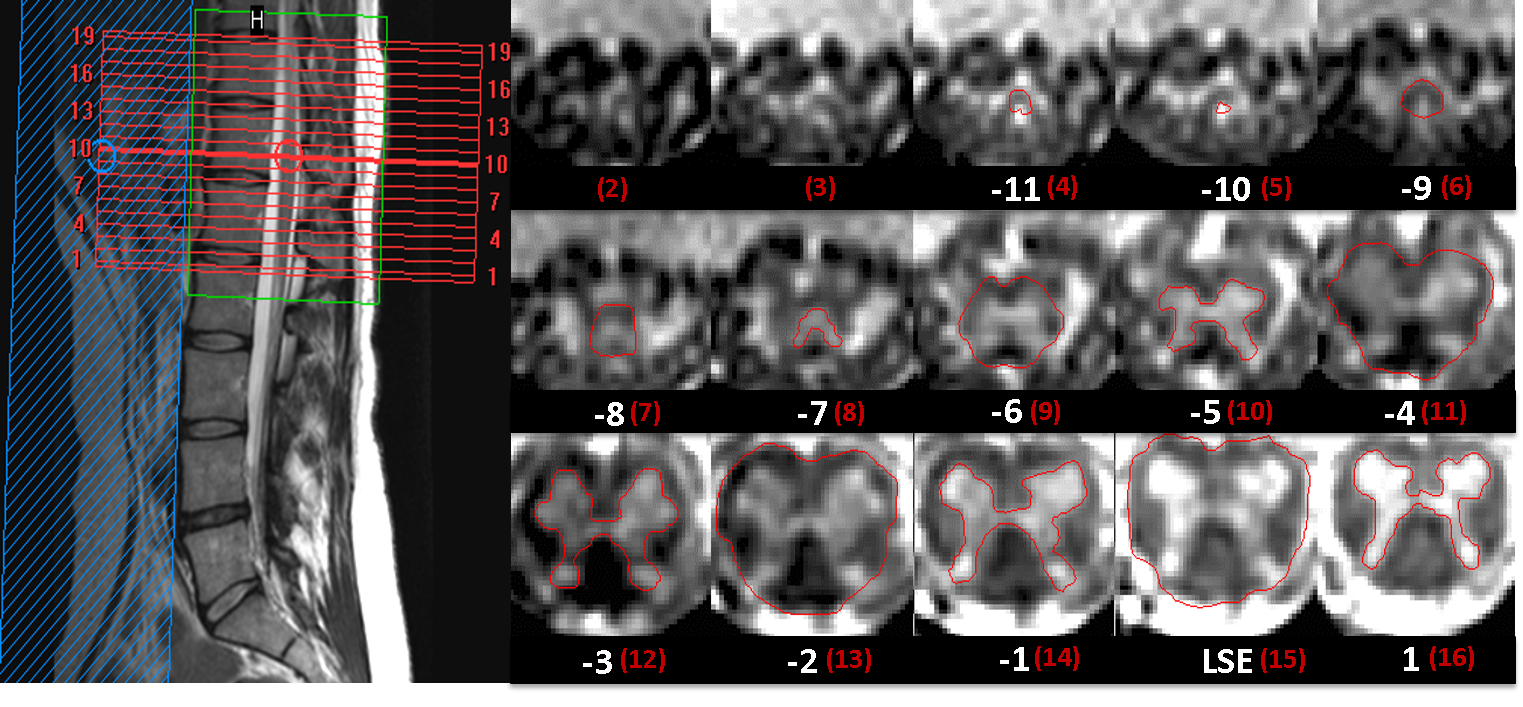
This study was approved by the local ethics committee and written informed consent was obtained from five healthy volunteers (mean age: 30.0, range 24.5-37.1 years; 2 female). Using a Philips Achieva 3T and the product NV-16 and 15-channel SENSE spine coils, the lumbosacral SC was imaged axially with the slices perpendicular to the longitudinal axis of the cord using a fat-suppressed 3D slab-selective fast field echo sequence as follows: Repetition time=23ms; echo time=4.4 ms, flip angle α=10°, field of view=180×180mm2, voxel size = 0.5×0.5×5mm3, 8 averages, 19 slices and scanning time of 19:27min. The first slice of the imaging volume was positioned at the superior margin of the T11 vertebral body with the volume extending caudally towards the inferior margin of the L1 vertebral body (Figure 1). Three raters analysed the data independently three times with a minimum of 2 weeks gap in-between each rating. For each slice, tissue segmentation was performed manually using JIM 6.0 (http://www.xinapse.com) providing corresponding CSA measurements for the cord and GM (Figure 1)3. For each subject, the position of the LSE (referred to as slice 0) was determined based on the median position of the largest CSA between T11-L1 across all ratings, and all slices were renumbered according to their distance from the LSE. Mean volumetric measures were calculated for a 15mm segment around the LSE (LSE-V, LSE-GM-V) spanned by three slices (+1/0/-1), and the CM (CM-V, CM-GM-V) spanned by a variable number (CM-n-Slices) of the remaining slices (slices -2/-3/-4/…/n) moving caudally from the LSE to the tip of the CM (Figure 1). Intra- and inter-rater reproducibility of all measures was assessed from the repeated measurements using the coefficient of variation expressed as a percentage (%COV). In order to estimate the intra- and inter-rater measurement error relative to the biological variability between subjects, the intra-class correlation coefficient (ICC) was calculated. Considering the between-subject biological variability in length of the CM, intra- and inter-rater slice ranges were calculated for CM-n-Slices. Additional slice-wise analyses were conducted for slices LSE+1/0/-1/,…,/-6 with the choice of slices determined from the mutual overlap across all raters and ratings.Results
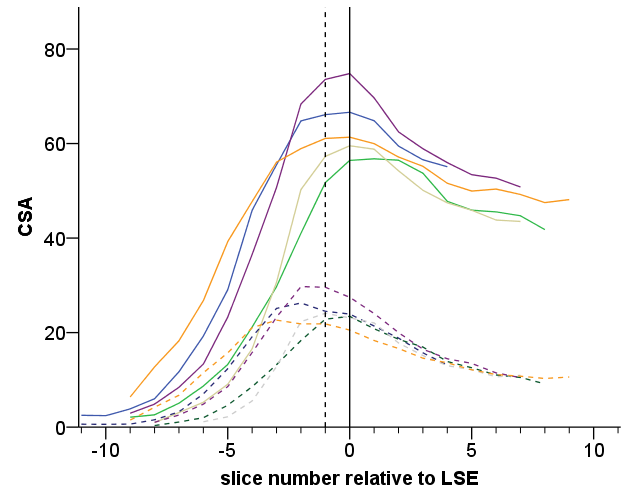
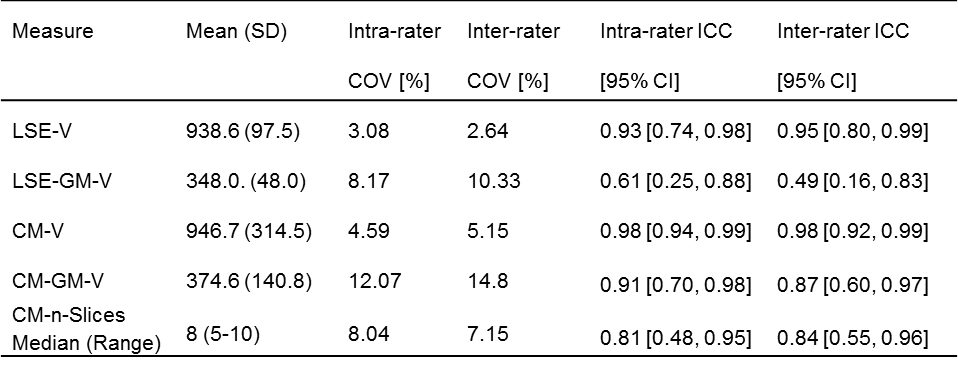
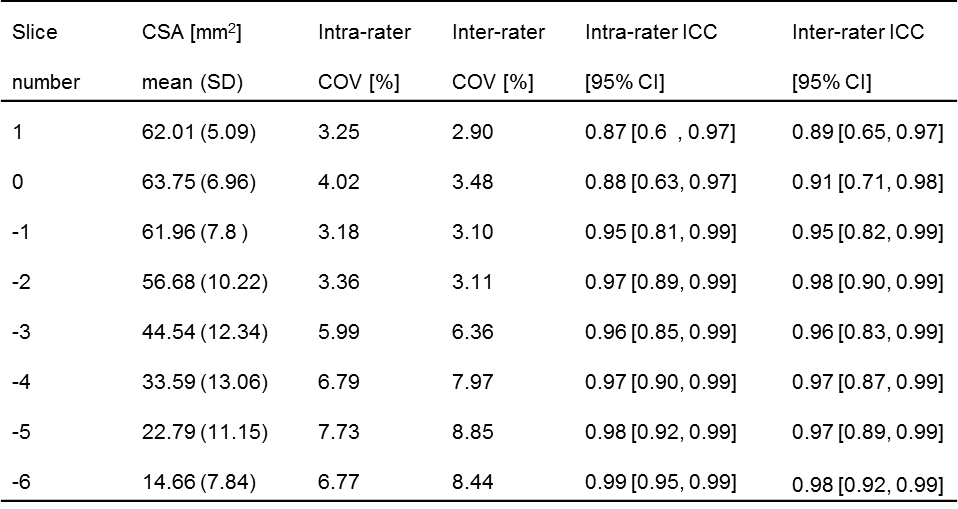
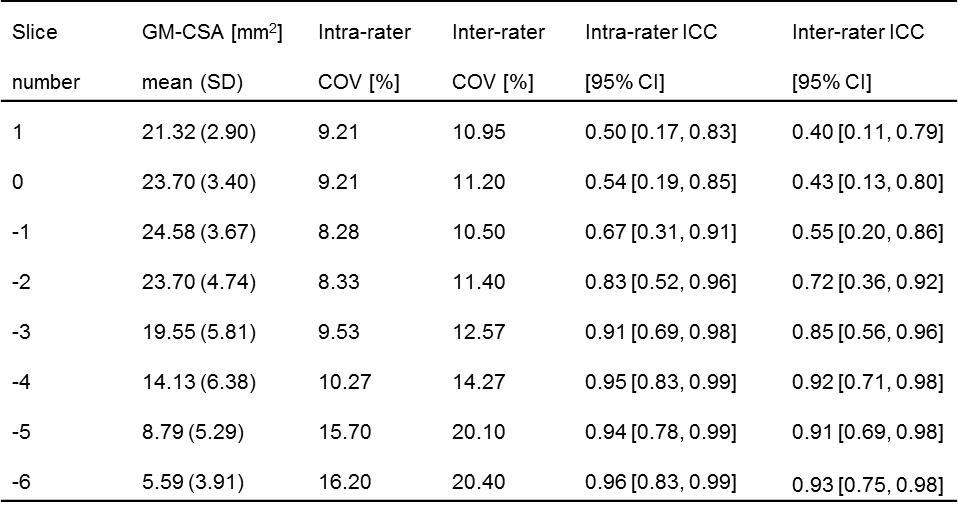
Table 1 summarises the results of the reproducibility assessment for each SC segment (i.e. LSE and CM). The results of the slice-wise reproducibility assessment for slices +1 to -6 are provided separately for the CSA of the cord (Table 2) and GM-CSA (Table 3), respectively. Across subjects similar CSA trajectories were found when aligned relative to the position of their individual LSE with the largest GM-CSA 1-2 slices below the LSE (see Figure 2, Tables 2&3).Discussion and Conclusion
In this work we demonstrate the feasibility of GM/WM segmentation of the CM in the neurologically intact SC in vivo. The results for the LSE segment are in agreement with previous work confirming the robustness of the segmentation method3,5. The marginally lower reliability of the measures obtained in the CM compared to the LSE is consistent with the variable and smaller diameter of this structure, which also becomes evident in the slice-wise analyses (Tables 2&3). Further studies are needed using larger sample sizes and with separate assessments in neurodegenerative conditions. In order to establish new MRI biomarkers for the lumbosacral SC for use in various neurological diseases, genders and age groups, normalization and standardization strategies are warranted.Acknowledgements
The UK MS Society and the UCL-UCLH Biomedical Research Centre for ongoing support. ML received funding from the Swiss National Science Foundation (fellowship P2EZP3_148749 & P300PB_161087), joint research funding from UCL and the Neuroscience Center Zürich, and the UK Multiple Sclerosis Society. CGWK receives funding from ISRT, Wings for Life and the Craig H. Neilsen Foundation for the INSPIRED study.References
1. Losseff NA, Webb SL, O'Riordan JI et al. Spinal cord atrophy and disability in multiple sclerosis. A new reproducible and sensitive MRI method with potential to monitor disease progression. Brain 1996;119:701-708.
2. Schlaeger R, Papinutto N, Panara V et al. Spinal cord atrophy correlates with multiple sclerosis disability. Ann Neurol. 2014;76(4):568-80.
3. Yiannakas MC, Kakar P, Hoy LR et al. The Use of the Lumbosacral Enlargement as an Intrinsic Imaging Biomarker: Feasibility of Grey Matter and White Matter Cross-Sectional Area Measurements Using MRI at 3T. PLoS One 2014;9(8):e105544.
4. Konno H, Yamamoto T, Iwasaki et al. Shy-Drager syndrome and amyotrophic lateral sclerosis. Cytoarchitectonic and morphometric studies of sacral autonomic neurons. J Neurol Sci.1986;73:193-204.
5. Ugorji, CO, Samson RS, Liechti MD et al. Grey and White Matter Magnetisation Transfer Ratio Measurements in the Lumbosacral Enlargement: A Pilot In Vivo Study at 3T. PloS one 2015; 10:e0134495.
Figures