4674
Motor-task based fMRI of the spinal cord reveals neural activity in gray matter hornsSatoshi Maki1, Benjamin N. Conrad1, Robert L. Barry2,3, Lydia J. McKeithan1, John C. Gore1,4, and Seth A. Smith1,4
1Vanderbilt University Institute of Imaging Science, Nashville, TN, United States, 2Athinoula A. Martinos Center for Biomedical Imaging, Department of Radiology, Massachusetts General Hospital, Charlestown, MA, United States, 3Department of Radiology, Harvard Medical School, Boston, United States, 4Department of Radiology and Radiological Sciences, Vanderbilt University Medical Center, Nashville, TN, United States
Synopsis
In spinal cord functional magnetic resonance imaging (fMRI) studies, localization of functional activation is still limited due to low signal to noise ratio and low spatial resolution. We studied blood oxygen level dependent signal changes in individual gray matter horns of the cervical spinal cord using a 3D gradient-echo sequence for fMRI during an upper extremity motor task. Visualization and delineation of neural activity in gray matter of cervical spinal cord elicited by the motor task was successfully demonstrated at fine spatial scales suggesting the potential for noninvasive monitoring of spinal cord function.
Introduction
Previous 3 Tesla studies have attempted to detect blood oxygenation level dependent (BOLD) signal change using spinal cord functional magnetic resonance imaging (fMRI) during motor tasks. However, localization of fMRI activations to individual gray matter horns is limited due to low signal to noise ratio (TSNR) and inadequate spatial resolution. The purpose of this study was to develop a novel, high-resolution 3D gradient echo BOLD-sensitive sequence capable of detecting functional-related signal changes in individual gray matter horns of the cervical spinal cord in healthy volunteers performing an upper extremity motor task.Methods
After approval from the local review board and signed consent, 6 healthy volunteers were recruited for the study. Imaging was acquired using a 3.0 T MR system (Philips Achieva, Best, Netherlands) with a dual-channel transmit body coil and a 16-channel neurovascular coil for signal reception. fMRI data were acquired with a 3D gradient-echo sequence with the following parameters: in-plane field of view =150 × 150 mm, slice thickness = 5 mm, voxel size = 1 × 1 × 5 mm3, 6 slices, repetition time = 36.4 ms, echo time = 10 ms, flip angle = 8°, volume acquisition time = 1.87 seconds, number of volumes (after 5 ‘dummy’ scans) = 278 (520 seconds). High-resolution (0.65×0.65 mm2) anatomical imaging was acquired with the same slice geometry using a multi-echo gradient echo sequence (mFFE). Within each functional imaging session, 4 functional runs were acquired (2 runs for both left and right finger extension tasks). The paradigm consisted of a block design with 8 cycles of alternating 30-second rest and 30-second motor periods in each run. Functional data were processed using AFNI and MATLAB, involving motion correction, RETROICOR, coregistration to anatomical space, low pass filtering with a cutoff frequency of 0.25 Hz, and generalized linear model analysis. Since BOLD fluctuations are expected to manifest predominantly in gray matter, regions of interest (ROIs) were defined for left and right ventral and dorsal horns of the gray matter based on anatomical imaging. According to the given side of motor task, each ROI was defined as ipsilateral and contralateral ventral (iVH and cVH) and dorsal gray matter horn (iDH and cDH). Number of active voxels and percent signal change were calculated in each ROI and analyzed at the group level. Tukey-Kramer test was used for statistical analysis and P < 0.05 was considered significant.Results
Figure 1 presents sagittal and axial anatomical (A, B) and functional (C) data from a healthy volunteer. Axial slices were perpendicular to the cord at C6 and covered from C5-6 to C6-7 disc level (Fig. 1A). High-resolution T2*-weighted mFFE axial images (Fig. 1B) clearly show the butterfly shaped gray matter, and, importantly, a similar pattern is observed in our improved T2*-weighted fMRI data (Fig. 1C). Across all subjects, the median TSNR in the gray matter was 16.5. In Figure 2, a representative fMRI activation map of left and right motor task demonstrates ipsilateral ventral horn activity in several slices. Figure 3 displays number of active voxels in each slice. Number of active voxels in iVH tended to be larger than those of cDH although only reaching significance in slice 4 (approximately C6). Total number of active voxels in each slice was the highest in slice 2. Figure 4 illustrates average fMRI signal time courses extracted from each ROI from slices 1 to 4.Discussion and Conclusions
In this study, we applied an improved, high-contrast 3D gradient echo fMRI sequence to successfully detect and characterize BOLD signal changes in individual gray matter horns of the cervical spinal cord during an upper extremity motor task. We employed a 3D gradient-echo sequence because we have previously reported robust resting state fMRI of spinal cord at 3 and 7 Tesla using a similar sequence since it has less T2* blurring and geometric distortions.1,2 The number of active voxels were the highest in slice 2, which corresponds to C7 spinal segment whose motor innervation is finger extensors. Moreover, we found that activity tended to be higher in the ventral horn of the gray matter on ipsilateral side to the task compared to dorsal horn on contralateral side to the task. The ipsilateral anterior activity likely represents motor neuron activity. In conclusion, visualization and delineation of BOLD signal change in gray matter of the cervical spinal cord during a motor task was demonstrated at fine spatial scales, suggesting the potential for noninvasive monitoring of spinal cord function.Acknowledgements
This research was supported by: W81XWH-13-1-0073 (Smith), NIH/NINDS R21NS087465, National MS Society, and NIH/NIBIB R00EB016689 (Barry).References
1. Barry RL, et al. Neuroimage 2015; 133:31-40. 2. Barry RL, et al. Proc. ISMRM 2016, #4396.Figures
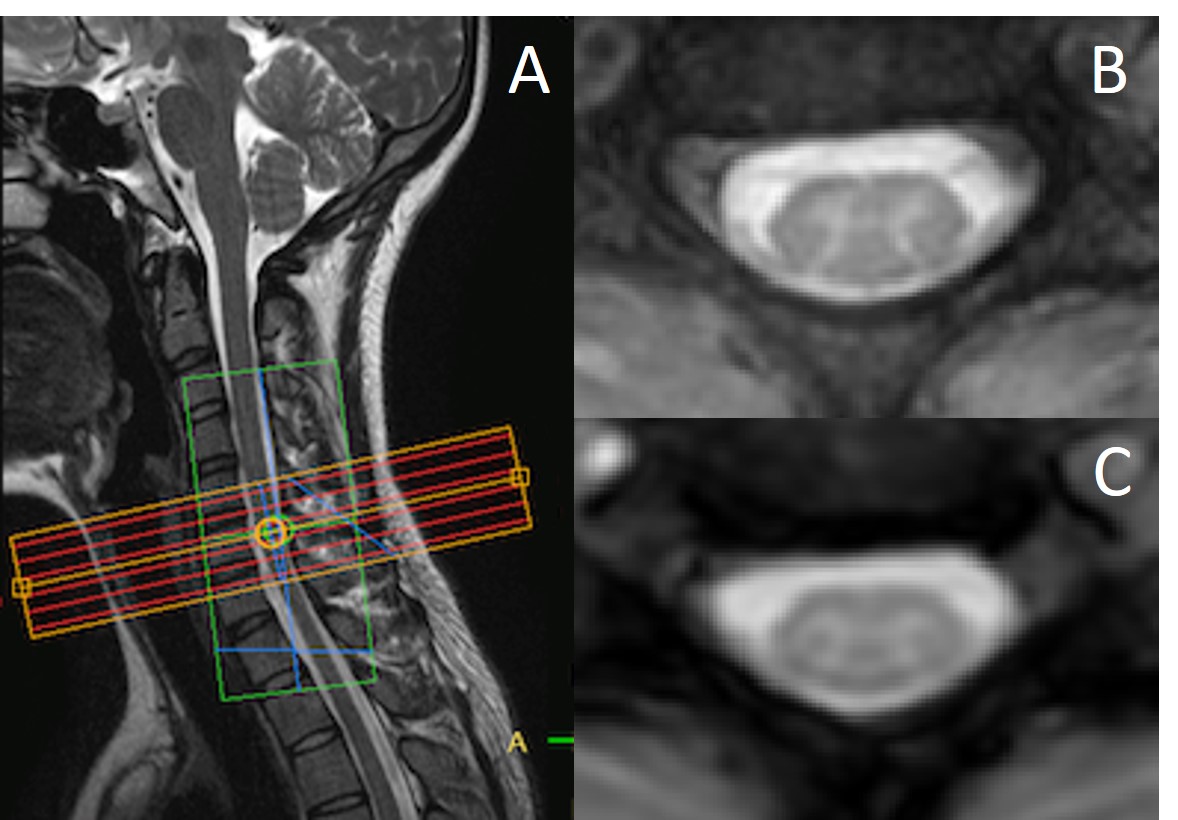
Fig 1: (A) Mid-sagittal slice of the cervical spinal cord showing axial imaging stack centered on the C6 mid-vertebral level. (B) High-resolution T2*-weighted anatomical image at C6. (C) Functional image of the same slice to the anatomical.
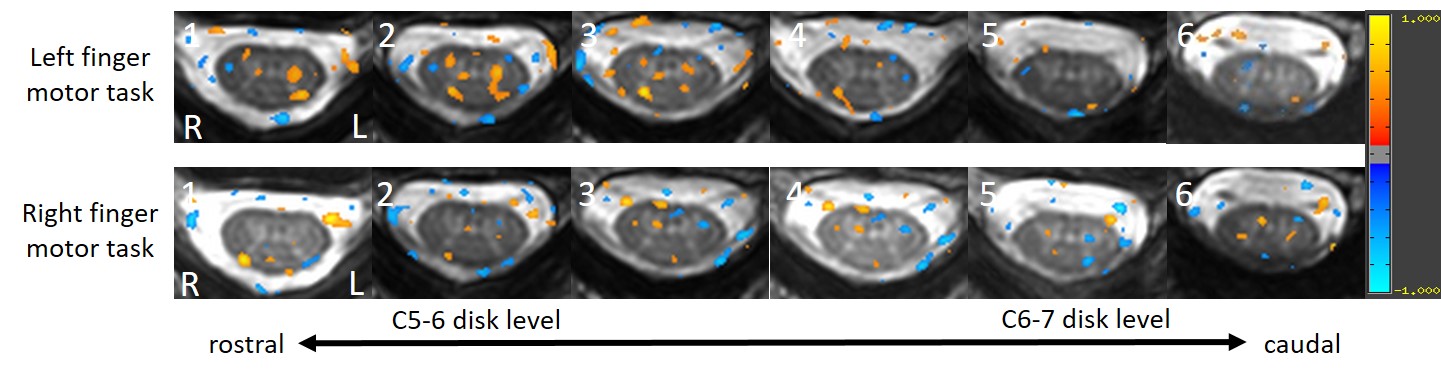
Fig 2: Representative fMRI activation map showing the spatial location of voxels preferentially activated during left (upper row) and right (lower row) finger motor task. All maps are thresholded at P < 0.05. L, left; R, right.
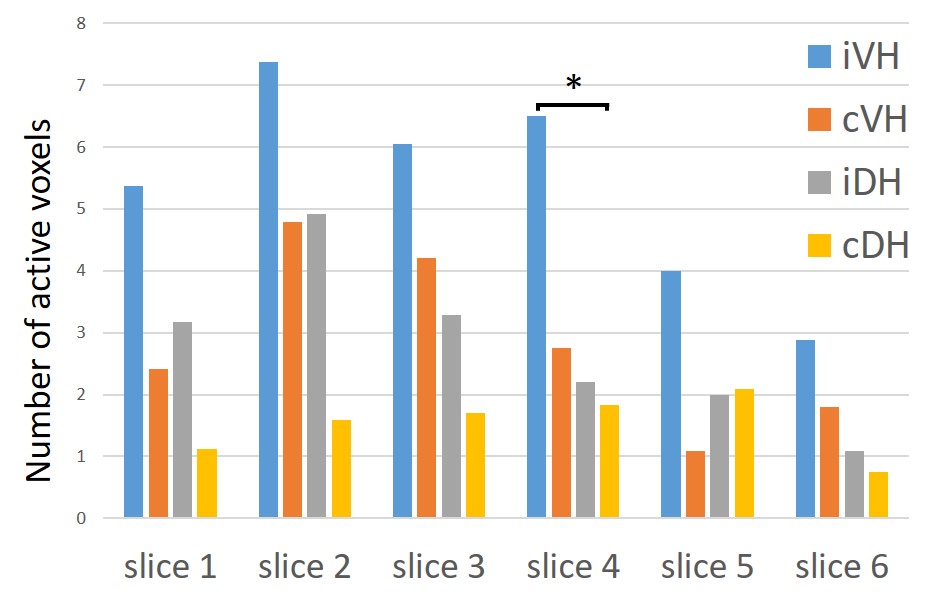
Fig 3: Mean number of active voxel in each slice. *P < 0.05
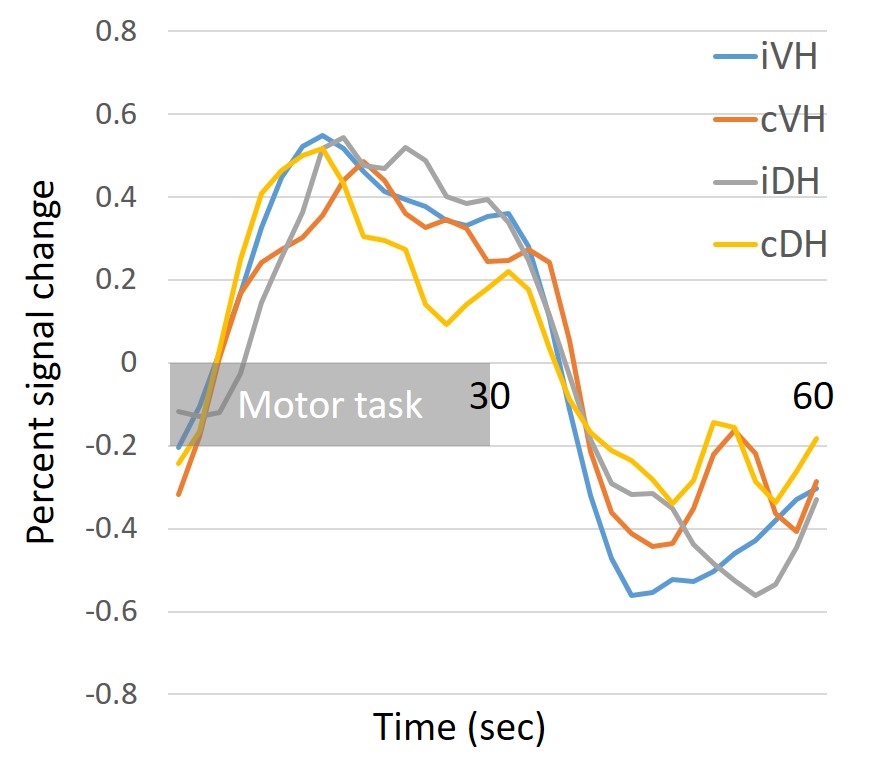
Fig 4: Average fMRI signal change time course extracted from each region of interest from slice 1 to 4 at group level.