4668
Semi-quantitative Parametric Evaluation of Parotid Gland Function Using Proton Density Magnetic Resonance Imaging1Master 's Program of Biomedical Informatics and Biomedical Engineering of Feng Chia University, Taichung, Taiwan, Taichung, Taiwan, 2Department of Automatic Control Engineering, Feng Chia University, Taichung, Taiwan, Republic of China, 3Ph.D. program in Electrical and Communication Engineering in Feng Chia University, Taichung, Taiwan, Republic of China, 4Department of Radiology, Tri-Service General Hospital, Taipei, Taiwan, Republic of China, 5Department of Diagnostic Radiology, The University of Hong Kong, Hong Kong, 6Ph.D. program of Technology Management, Chung Hua University, Hsinchu, Taiwan, Republic of China, 7Department of Medicine, Taipei Medical University, Taipei, Taiwan, Republic of China, 8Department of Dentistry, National Defense Medical Center, Taipei, Taiwan, Republic of China, 9Department of Radiology, National Defense Medical Center, Taipei, Taiwan, Republic of China
Synopsis
The parotid gland function is evaluated by gustatory stimulation using scintigraphy in clinic. It is supposed to measure the water component of parotid gland using PD MRI instead of scintigraphy. In this study, we initially developed the evaluation of parotid gland function by PD MRI, and 10 healthy volunteers underwent double echo EPI with gustatory stimulation. Maximal drop ratio (MDR), time to peak (TTP), drop slope (DS), recovery slope (RS) and recovery ratio (RR) were calculated. The signal intensity dropped significantly after gustatory stimulation on PD image (P<0.01). MRI allows quantification of parotid gland function using semi-quantitative functional parameters.
Introduction
Since 1975, salivary gland function has been evaluated by scintigraphy [1; 2] , which allows dynamic measurements of 99mTc-pertechnate in the salivary glands. Comparing with scintigraphy, MRI is superior to scintigraphy by the merits of radiation free, high spatial resolution, and excellent anatomic characterization. Salivary gland function has been increasingly evaluated by MRI via characterizing changes of parotid diffusion [3], perfusion [4], blood flow [5], and blood oxygenation [6] after gustatory stimulation. Since the main function of parotid glands is to secrete saliva, it is plausible that measuring the changes of water component of the parotid glands might allow direct evaluation of the parotid gland function. Double echo MRI allows calculating proton density (PD) of the parotid glands. Theoretically, the change of parotid PD in gustatory stimulating experiments represents the change of parotid water component. The purpose of this prospective study was to investigate the parotid gland function by semi-quantitative parameters using a high temporal resolution double echo echo-planar imaging (EPI) pulse sequence.Materials and Methods
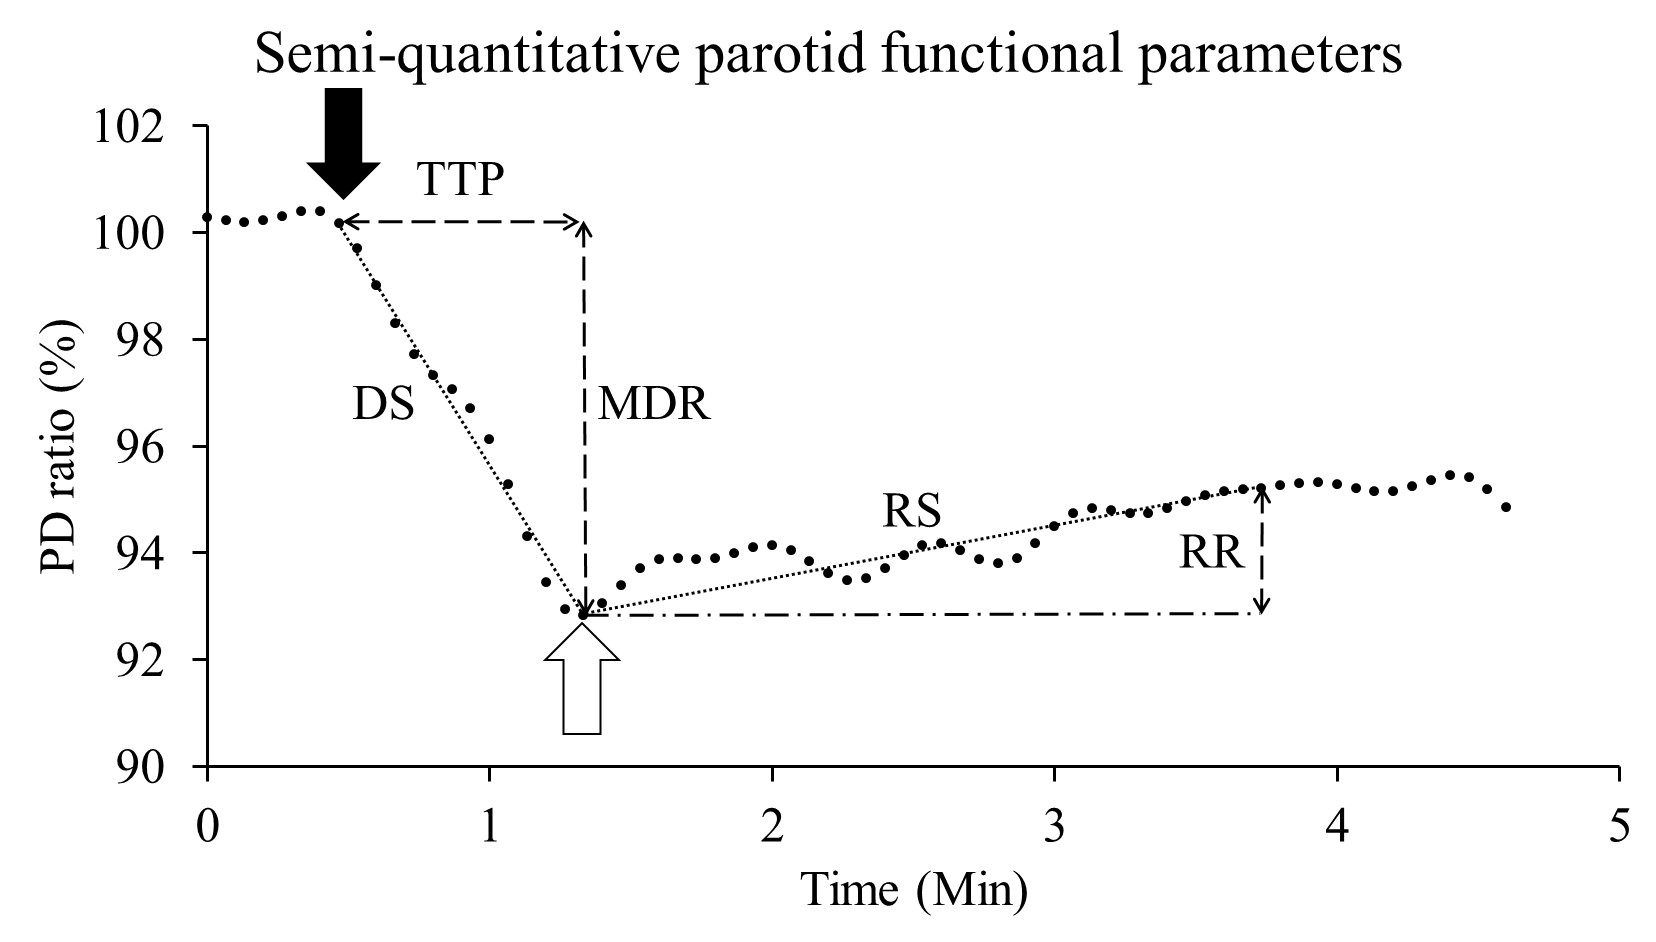
This prospective study was approved by the institution review. A total of 10 healthy volunteers (M:F=6:4; 35.1 ± 14.1 years) were enrolled in this pilot study. All MR scans were performed at a 1.5 T whole-body scanner (GE Healthcare, Signa HDx, US) using an 8NV head and neck array coil. Axial alternative echo EPI (TR/TE1/TE2/NEX: 2000 ms/22.2 ms/80 ms/1) were acquired by using an echo train length of 76, field of view of 240 × 240 mm, matrix size of 128 × 128, bandwidth of 3906 Hz/pixel, and slice thickness of 5 mm. The in-plane resolution was 1.875 ×1.875 mm. During the dynamic scans, 10 ml of lemon juice was manually injected into the oral cavity at the start of the 11th dynamic scan and was swallowed 40 seconds later. Time signal data of PDWI and T2WI were initially treated by a low-pass filter with a cut-off frequency of 0.0375Hz, respectively. T2 and PD time data were then computed based on the corresponding filtered time signal data of PDWI and T2WI, respectively. All filtered signal-time data were further transformed to ratio-time data according to equation 1: ……[1] , where Si denoted the signal intensity at ith dynamic scan, So was the baseline signal intensity averaged from the signal intensity on three time points covering the start of signal drop, and Sr represented the signal intensity ratio. Maximal drop ratio (MDR), time to peak (TTP), drop slope (DS), recovery slope (RS) and recovery ratio (RR) were demonstrated in Fig. 1. RS was defined by the equation 2: [2] , where Sr50 referred to the Sr at the 50th dynamic scan since the initial drop on ratio time curve and Srmin equaled to the MDR. To evaluate the effect of scan time interval on parotid functional parameters, all PD time curves were re-plotted using time intervals of 4 × 2i with i ranging from 0 to 4. Wilcoxon test was applied for group analysis. Kruskal-Wallis test was used for multi-group comparisons regarding different time intervals. A P value less than 0.05 was considered as statistically significant.Results
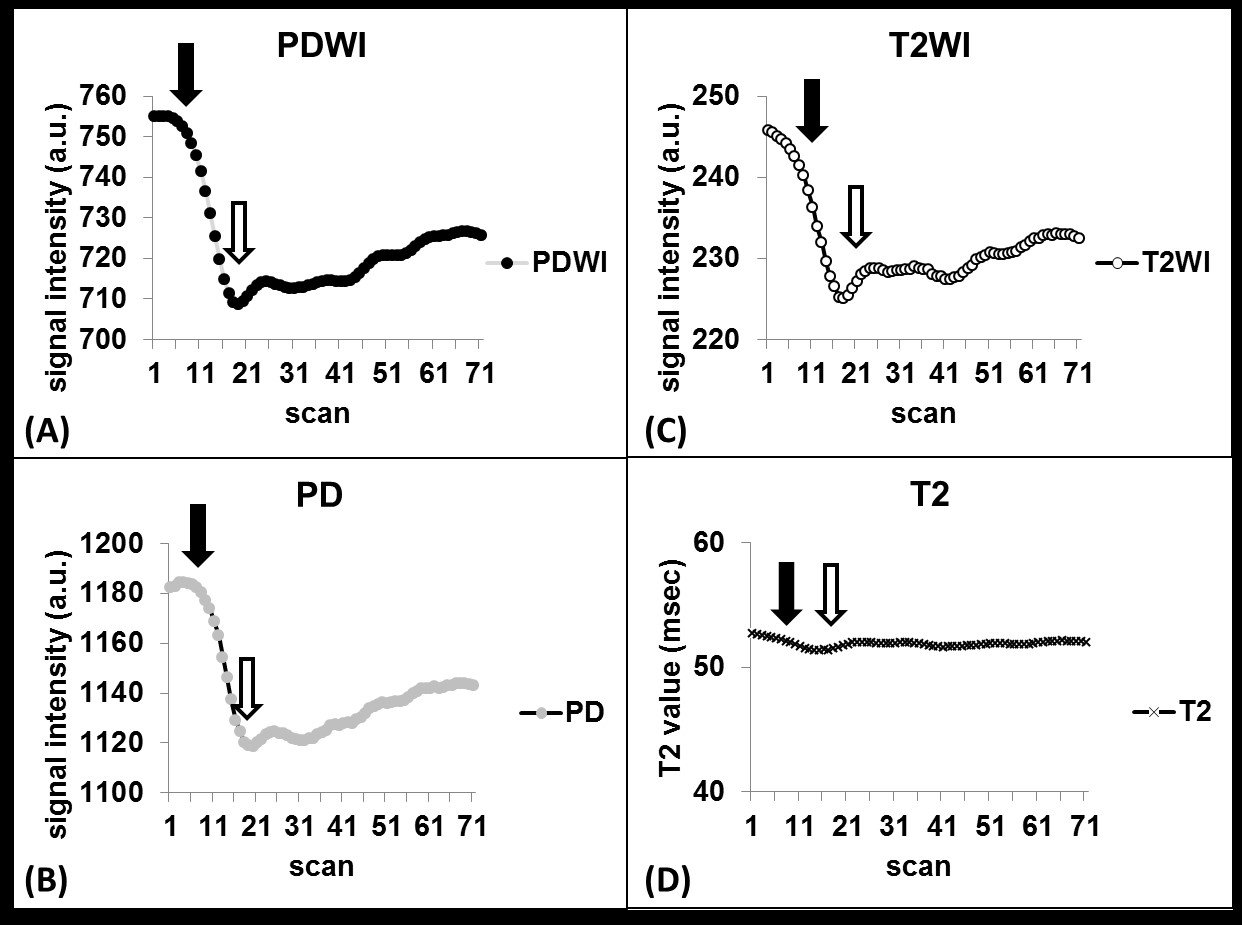
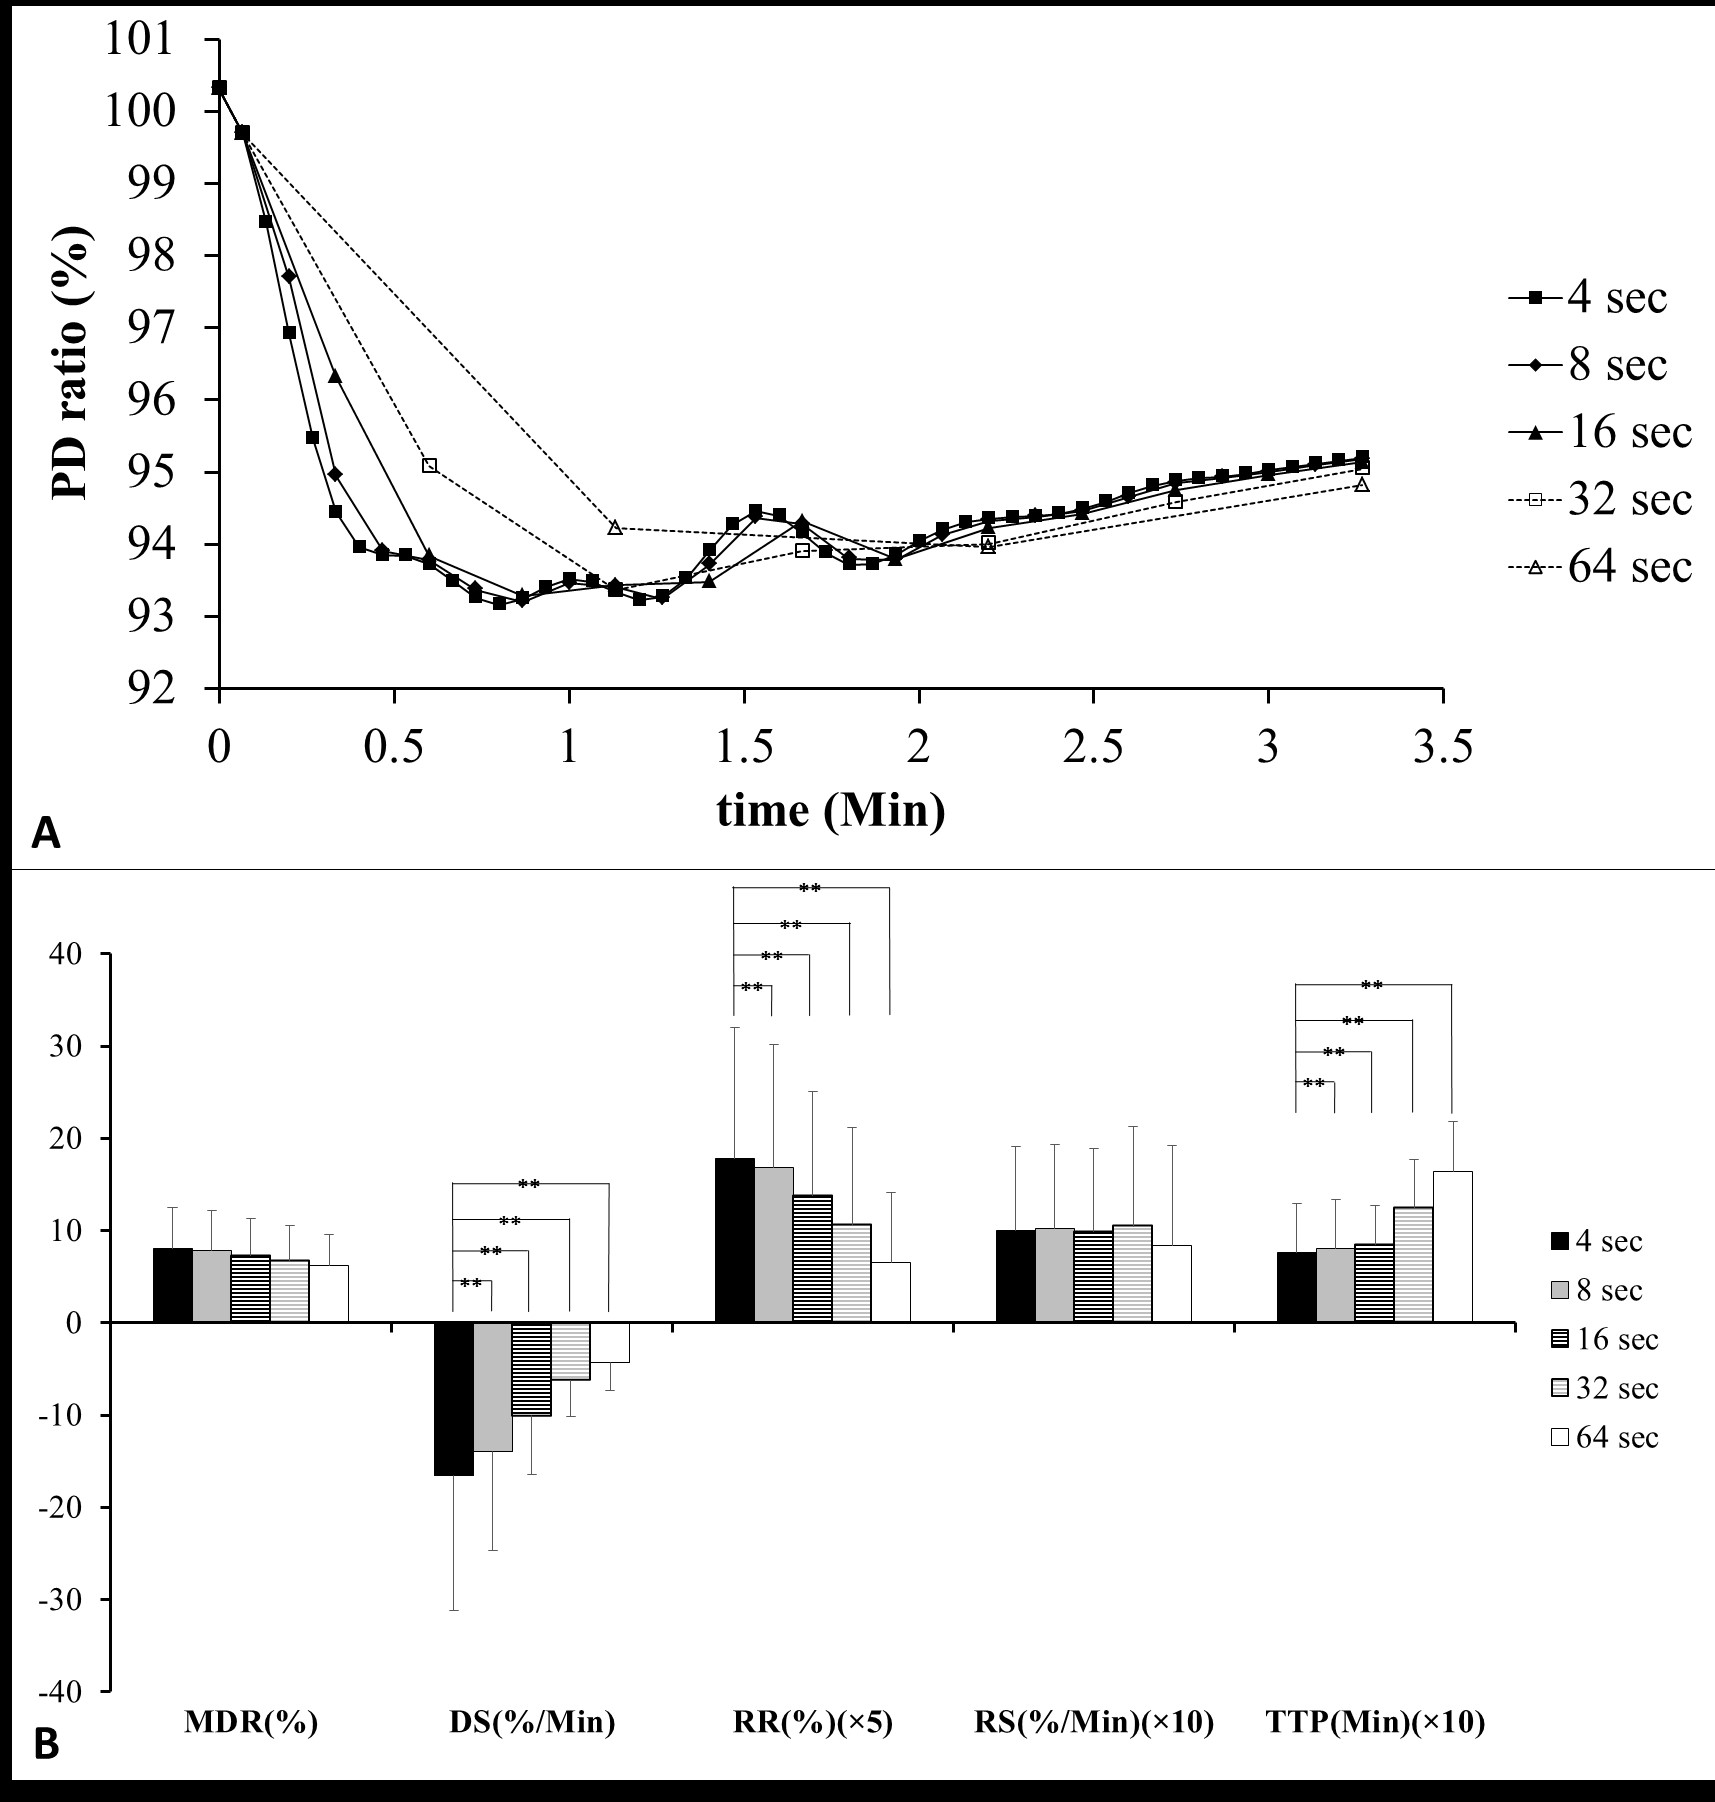
On PDWI (Fig. 2A), PD (Fig. 2B), and T2WI (Fig. 2C), the signal intensity began to drop as soon as the start of lemon juice administration at the time point of 11th scan. The descending trend persisted until reaching the maximal signal drop at 20th dynamic scan. On the other hand, the T2 value of parotid glands remained unchanged after the gustatory stimulation (Fig. 2D). PD ratio time curves of a representative subject with varying time intervals were illustrated on Fig. 3A. Semi-quantitative parotid functional parameters of all subjects with varying time intervals were plotted in Fig. 3B. DS, RR, and TTP showed significant difference between an interval of 4Discussion
Our study is different from scintigraphic studies in several aspects. First, our MR study uses endogenous protons to trace parotid response to gustatory stimulation rather than exogenous 99mTc-pertechnate isotopes in scintigraphy. Therefore, our study is superior to scintigraphy as the used MR technique is free of radiation. Second, our study show an averaged MDR of 8.64%, which is far lower than the salivary excretion fraction of 99mTc-pertechnate ranging from 49.5% [7] to 64.2% [8] in scintigraphy. Third, our study provides high temporal resolution with a 4-second time interval, which is much shorter than a time interval of 16 seconds to 120 seconds used in scintigraphy [2; 7; 8]. Thanks to the higher temporal resolution, our study might allow more accurate quantification of both amplitude and time-related semi-quantitative parameters than the scintigraphy.Acknowledgements
The authors are grateful to Miss Cheng-Hsuan Juan for contributing the comprehensive cartoon illustration of gustatory stimulation and toilet tank concept. The study was supported partly from Tri-Service General Hospital under the Grant No. TSGH-C106-036 and partly from the Ministry of Science and Technology, R. O. C. under the Grant No. MOST 105-2314-B-016 -024 -MY2 and MOST 105-2221-E-035 -049 -MY2. This prospective study was approved by the institution review board of Tri-Service General Hospital.References
1. Ingrand J, Danchot J, Menkes CJ, Delbarre F, Roucayrol JC (1975) [Quantitative functional exploration of the salivary glands. Measurement of salivary elimination of technetium 99]. Nouv Presse Med 4:395-400
2. Loutfi I, Nair MK, Ebrahim AK (2003) Salivary gland scintigraphy: the use of semiquantitative analysis for uptake and clearance. J Nucl Med Technol 31:81-85
3. Habermann CR, Cramer MC, Graessner J et al (2004) Functional imaging of parotid glands: diffusion-weighted echo-planar MRI before and after stimulation. Rofo 176:1385-1389
4. Clark HD, Moiseenko VV, Rackley TP, Thomas SD, Wu JS, Reinsberg SA (2015) Development of a method for functional aspect identification in parotid using dynamic contrast-enhanced magnetic resonance imaging and concurrent stimulation. Acta Oncol:1-5
5. Schwenzer NF, Schraml C, Martirosian P, Boss A, Claussen CD, Schick F (2008) MR measurement of blood flow in the parotid gland without contrast medium: a functional study before and after gustatory stimulation. NMR Biomed 21:598-605
6. Simon-Zoula SC, Boesch C, De Keyzer F, Thoeny HC (2008) Functional imaging of the parotid glands using blood oxygenation level dependent (BOLD)-MRI at 1.5T and 3T. J Magn Reson Imaging 27:43-48
7. Klutmann S, Bohuslavizki KH, Kroger S et al (1999) Quantitative salivary gland scintigraphy. J Nucl Med Technol 27:20-26
8. Gune S, Yilmaz S, Karalezli A, Aktas A (2010) Quantitative and visual evaluation of salivary and thyroid glands in patients with primary Sjogren's syndrome using salivary gland scintigraphy: relationship with clinicopathological features of salivary, lacrimal and thyroid glands. Nucl Med Commun 31:666-672
Figures