4667
Measurement of blood flow in normal parotid glands using pseudo-continuous arterial spin labeling: comparison between 2D echo-planar and 3D turbo spin-echo sequences.1Department of Radiology, Mie University Hospital, Mie, Japan, 2Department of Radiology, Mie University School of Medicine, Mie, Japan, 3Department of electronic and Computer Engineering, Ritsumeikan University, Shiga, 4Philips Electronics Japan, Tokyo, Japan, 5Department of Advanced Diagnostic Imaging, Mie University School of Medicine, Mie, Japan, 6Department of Radiology, Mie University School of Medicine, Tsu, Mie, Japan
Synopsis
Evaluation of parotid blood flow (PBF) may provide an insight into the pathophysiology of parotid diseases. We evaluated and compared the blood flow of normal parotid glands in six volunteers using 2D-echo-planar (EP) and 3D-turbo-spin-echo (TSE) pseudo-continuous ASL (pCASL) sequences. Visual assessment indicated that 3D-TSE pCASL maps were significantly better for delineating normal parotid glands. 3D-TSE pCASL showed larger PBF values than 2D-EP pCASL. Fewer measurement errors were observed in 3D-TSE pCASL data. We concluded that 3D-TSE pCASL is more suitable for the evaluation of PBF than 2D-EP pCASL.
INTRODUCTION
Arterial spin labeling (ASL) facilitates the noninvasive quantitative assessment of tissue perfusion without a contrast agent and is now used in clinical settings. However, the use of ASL to assess perfusion in normal and diseased parotid glands is limited [1, 2]. In previous studies, researchers have used different ASL sequences such as two-dimensional echo-planar (2D-EP) and three-dimensional turbo spin-echo (3D-TSE) [1, 2]. However, the literature has not yet identified which ASL sequence is better for evaluating parotid gland perfusion.PURPOSE
The purpose of this study is to evaluate the blood flow in normal parotid glands using two types of pseudo-continuous ASL (pCASL) sequences, 2D-EP and 3D-TSE, and determine which is better for evaluating parotid perfusion in clinical settings.MATERIALS and METHODS
For this study, we used a 3T MRI (Ingenia, Philips Healthcare, Best, Netherlands) with a dS HeadNeckSpine coil. We measured the blood flow of normal parotid glands in six volunteers (aged 24 ± 2.9 years, three men and three women) using 2D-EP and 3D-TSE pCASL. The 2D-EP pCASL parameters were as follows: TR/TE = 4500/14, number of excitations = 36, flip angle = 70º, matrix = 80 × 80, field of view (FOV) = 240 mm, label type = parallel slab, label gap = 73.36 mm, label duration = 1,650 ms, post-labeling delay = 1,800 ms, and scan time = 5 min 33 s for 22 slices. The 3D-TSE parameters were as follows: TR/TE = 6000/40, number of excitations = 3, flip angle = 90º, matrix = 80 × 80, FOV = 240 mm, label type = parallel slab, label gap = 73.36 mm, label duration = 1,650 ms, post-labeling delay = 1,800 ms, and scan time = 5 min 36 s for 44 slices. Labeling and control-dynamic data were transferred to a personal computer, processed, and analyzed for parotid blood flow (PBF) calculation using quantitative measurement software (C++ programming language, Philips Healthcare Korea, Republic of Korea). A region of interest (13 pixels) was identified within the normal parotid gland. Standard deviation within the parotid glands was used for the analysis of measurement errors. Two reviewers reached a consensus on the visual assessment of the PBF image for each pCASL map. A four-point scoring system was used: excellent (4), good (3), fair (2), or poor (1). We compared PBF quantitative data and the images obtained using PBF between 3D-TSE pCASL and 2D-EP pCASL. We used a Wilcoxon signed-rank test for statistical analysis.RESULTS
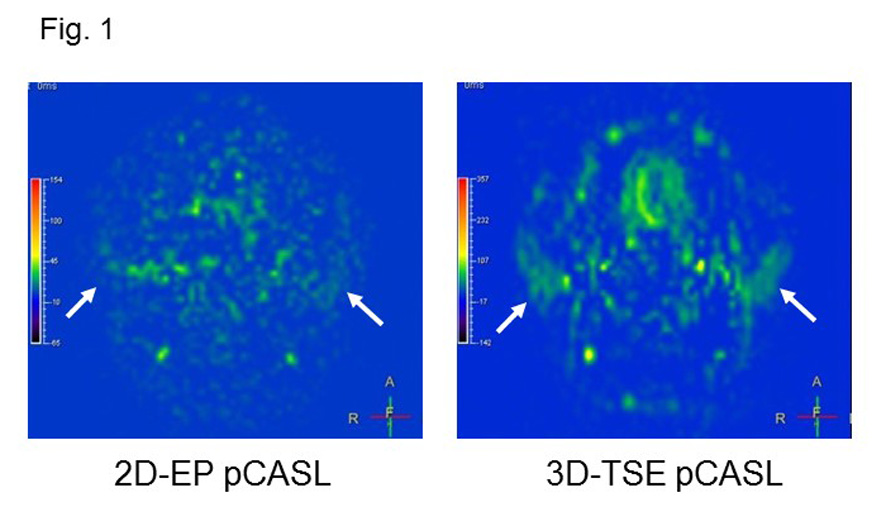
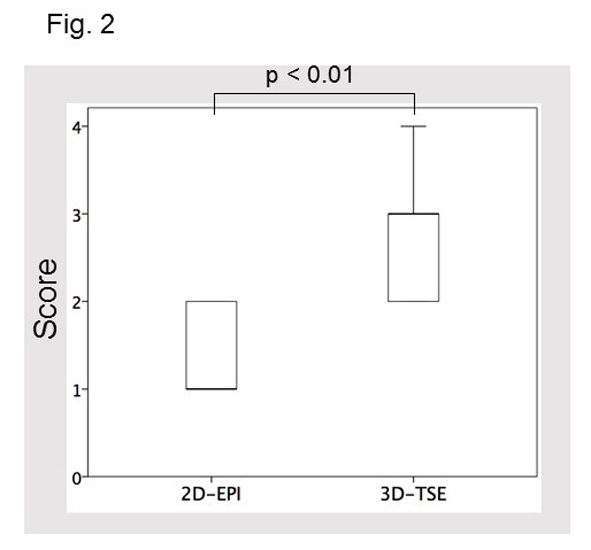
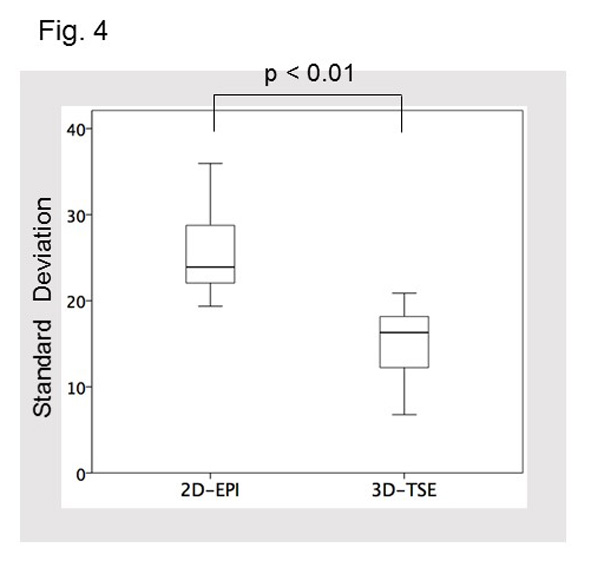
Visual assessment indicated that 3D-TSE pCASL maps were significantly better for delineating normal parotid glands (p < 0.01, Figs. 1, 2). 3D-TSE pCASL showed larger PBF values than 2D-EP pCASL (50.3 ± 8.5 vs. 37.7 ± 5.9 ml/min/100 mg; p < 0.01, Fig. 3). Standard deviation was significantly smaller in 3D-TSE pCASL compared with that in 2D-EP pCASL (13.6 vs. 25.6; p < 0.01, Fig. 4), indicating fewer measurement errors in 3D-TSE pCASL data.DISCUSSION
Blood-flow measurements in normal parotid glands were significantly higher in 3D-TSE pCASL than those in 2D-EP pCASL. This was probably due to the differences in readout and dimensions between the two techniques. 3D-TSE pCASL showed better delineation of the parotid gland and fewer measurement errors, which was likely due to a higher signal-to-noise ratio and less image distortion on 3D-TSE pCASL maps. Therefore, we conclude that 3D-TSE pCASL is more suitable for the evaluation of PBF than 2D-EP pCASL.Acknowledgements
No acknowledgement found.References
1. Kato H, et al. Perfusion imaging of parotid gland tumours: usefulness of arterial spin labeling for differentiating Warthin's tumours. Eur Radiol. 2015;25(11):3247-54.
2. Kami YN, et al. Arterial spin labeling imaging for the parotid glands of patients with Sjögren's syndrome. PLoS One. 2016;9;11(3):e0150680
Figures