4662
Modified 3D T2W DRIVE sequence for high resolution inner ear imaging at 7T1Sir Peter Mansfield Imaging Centre, University of Nottingham, Nottingham, United Kingdom, 2Ear Nose and Throat, University of Nottingham, Nottingham, United Kingdom, 3Beijing University of Chemical Technology, People's Republic of China
Synopsis
Despite the promise of increased sensitivity, non-contrast-enhanced imaging of inner ear at 7T is challenging due to local variations in B1 and B0. Here we optimize T2-weighted scanning to improve image quality in the inner ear and evaluate the normal variation in the geometry of the cochlea using 3D T2W DRIVE sequence with dielectric pads and RF shimming. The resulting images show well-defined internal structure of the cochlea and the branches of cranial nerve.
Introduction
It is important to have an understanding of the geometry of the cochlea for planning cochlea implantation. The increased sensitivity of 7T has been shown to improve visualization of the cochlea structure1-3, but B1 and B0 inhomogeneities can still compromise image quality and relatively long scan times are needed for high resolution imaging. Other have used 7T to image inner ear at high resolution (maximum 0.4 mm3 isotropic resolution) long scan times (29 mins)2. The aim of this study was to optimize T2-weighted scanning for high resolution imaging of the inner ear in a clinically feasible imaging time and to use it to evaluate anatomical variability of the human cochlea in adults with normal hearing.Methods
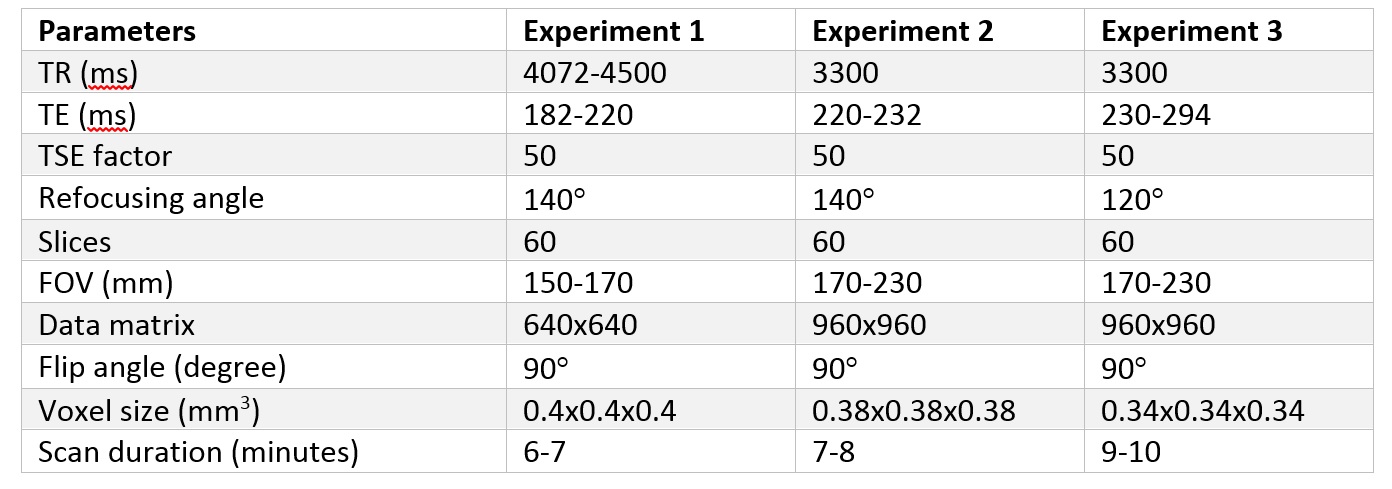
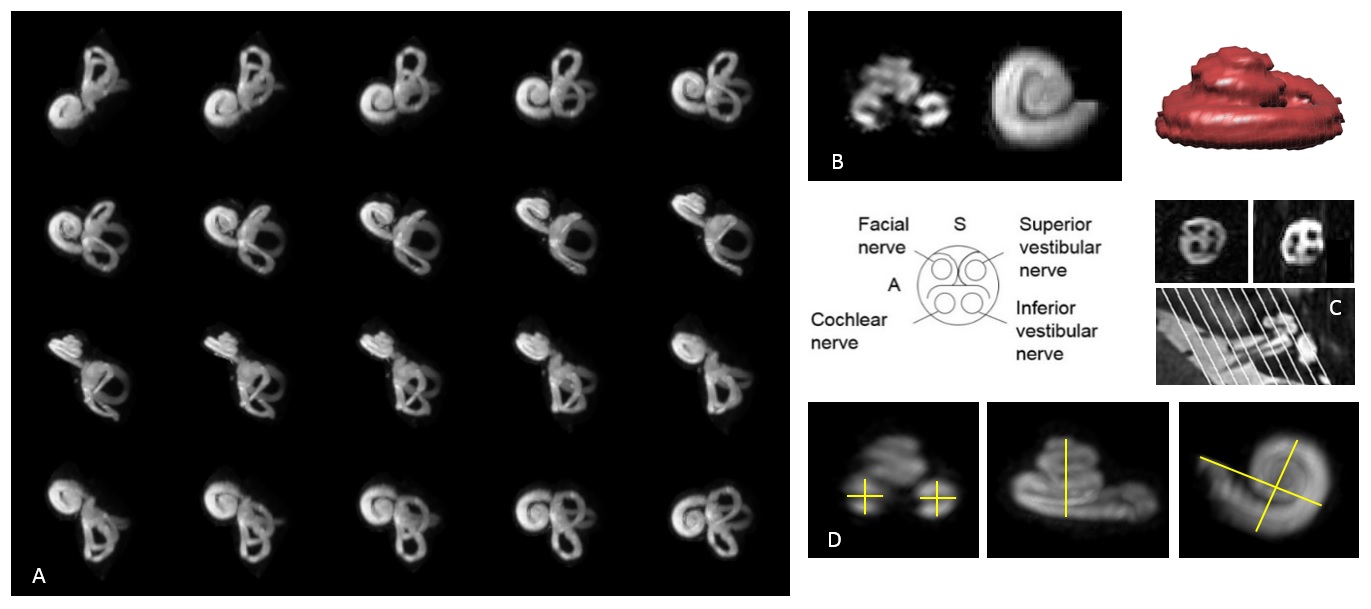
Thirteen healthy volunteers were scanned on a 7T scanner (Philips Achieva, the Netherlands) with a 32-channel receive coil (Nova Medical) with ethics approval. We used the DRIVen Equilibrium (DRIVE) sequence5 to provide T2-weighted contrast in relatively short scan times. Three experiments were conducted. Firstly, axial 3D T2W DRIVE were acquired with the parameters shown in Figure1. Second data was acquired with dielectric pads placed over both ears (size 18x18 cm, containing a suspension of calcium titanate with weights in the ratio 2.8:1 in deuterated water)6. Finally RF shimming was used, with the dielectric pads. Maximum intensity projections were created to visualize the cochlea structure. Cochlea dimensions (e.g. size, width, length and volume) were then evaluated (Figure 2). Results from measurement were presented as mean±SD to determine the variation of observed cochlea geometry. Finally, the results were compared using a paired t-test.Results
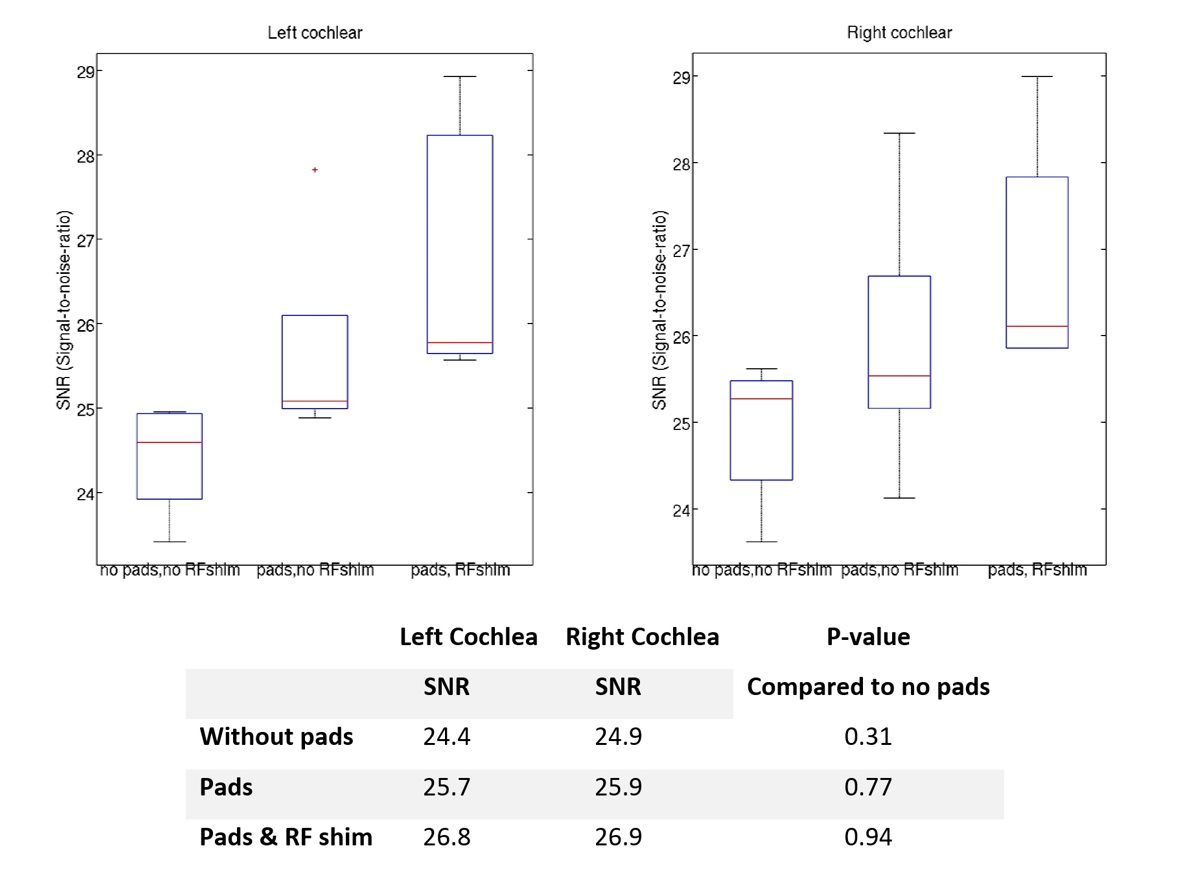
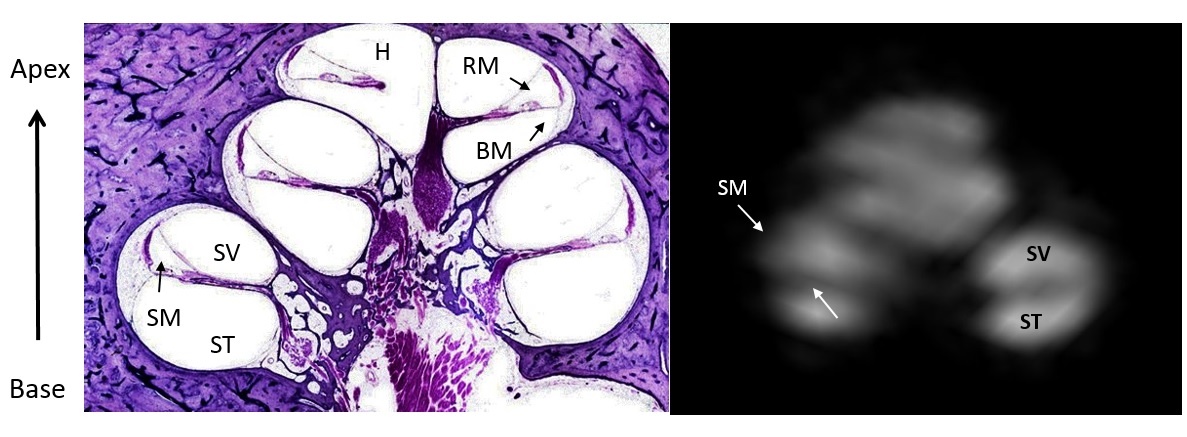
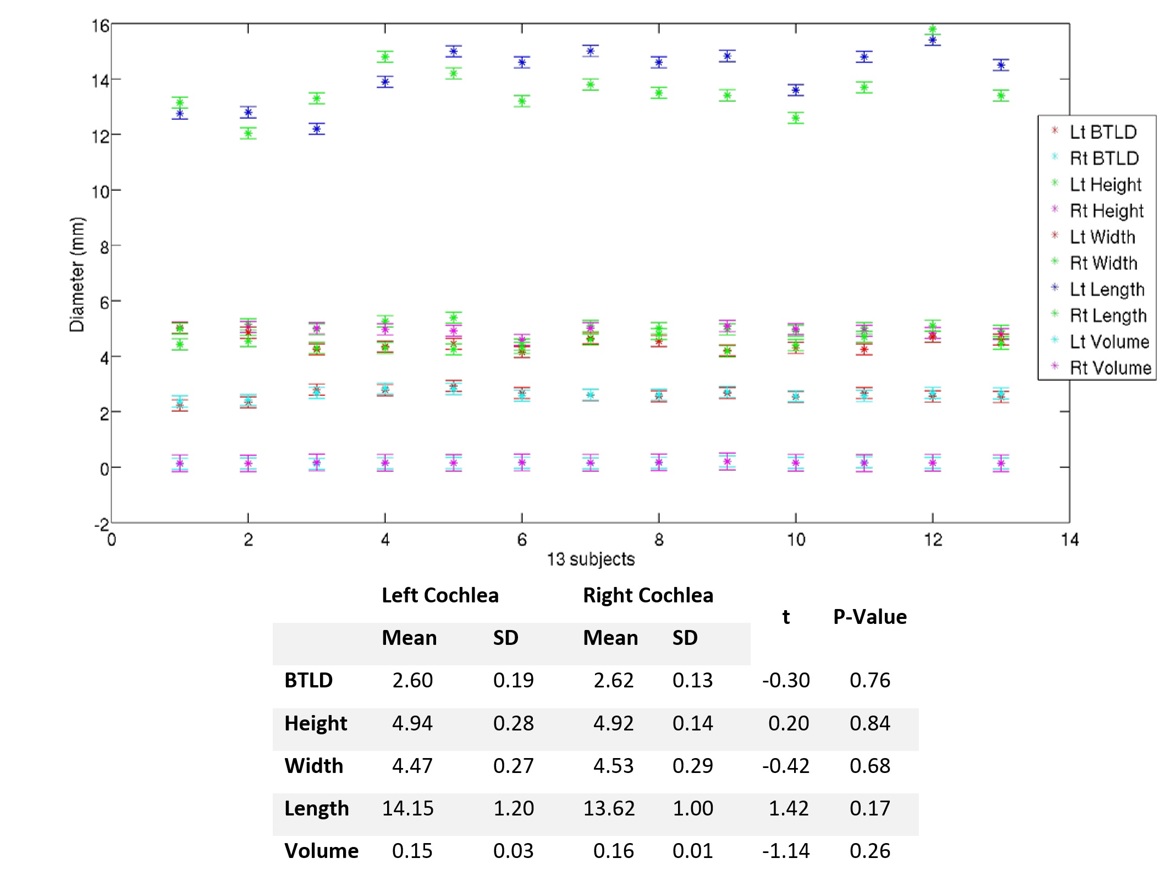
The best image quality was achieved when using the pads and RF shimming with a trend for increasing signal to noise ratio (Figure 3). All scans clearly demonstrated the scalar vestibule and scalar timpani separately within the cochlea, the cranial nerves (CN VII, VIII) and the three semicircular canals in particular a region between ampulla and canal. On the highest resolution scans we observed some evidence of the scalar media (Figure 4). The measurements confirmed that the cochlea is a spiral tube with 2.5 turns around its axis. Figure 5 shows individual variations in the dimension of the cochlear with subject averaged values tabulated below. There was no significant difference between right and left side for any measurement (p>0.05).Discussion
7T MRI provided excellent visualization of the internal structure of cochlea, three semicircular canals and cranial nerve in a 10 minute scan, at 0.34 mm3 isotropic resolution using dielectric pads1, 8 and RF shimming to overcome RF inhomogeneities. This allowed the geometry of the cochlea to be characterized in normal subjects. Our results concur with similar measurements of length and height reported previously7. This will important in planning cochlea implant surgery which can be complicated by abnormalities of cochlea structure4. Better visualization of the vestibular system with respect to the magnetic field will also be important in understanding the origin of vertigo effects in some people at high magnetic field9.Conclusion
3D T2W DRIVE sequence with dielectric pads and RF shimming allows very high resolution (isotropic voxels of 0.34 mm3) imaging of the cochlear reasonable scan duration (10 mins).Acknowledgements
Financial support from Naresuan University Thailand and the University of NottinghamReferences
1. Van Der Jagt M.A, et al. Visualization of human inner ear anatomy with high-resolution MR imaging at 7T: Initial clinical assessment. AJNR Am J Neuroradiol. 2014; 36:378–383.
2. Van Egmond S.L, et al. Ex vivo and in vivo imaging of the inner ear at 7 Tesla MRI. Otology & Neurotology. 2014; 35(4):725–9.
3. Van Egmond S.L, et al. In Vivo Imaging of the Inner Ear at 7T MRI: Image Evaluation and Comparison With 3T. Otology & Neurotology. 2015; 36(4):687–693.
4. Giesemann A, Hofmann E. Some Remarks on Imaging of the Inner Ear: Options and Limitations. Clinical Neuroradiology. 2015; 25:197–203.
5. Ciftci E, et al. Driven equilibrium (drive) MR imaging of the cranial nerves V-VIII: Comparison with the T2-weighted 3D TSE sequence. European Journal of Radiology. 2004; 51(3):234–240.
6. Teeuwisse W.M., Brink W.M., Webb A.G. Quantitative assessment of the effects of high-permittivity pads in 7 Tesla MRI of the brain. Magnetic resonance in medicine. 2012; 67(5):1285–93.
7. Pelliccia P, et al. Cochlea size variability and implications in clinical practice. Acta otorhinolaryngologica Italica. 2014; 34(1):42–9.
8. Brink WM, van der jagt AM, Versluis MJ, et al. High Permittivity dielectric pads improve high spatial resolution magnetic resonance imaging of the inner ear at 7T. Invest Radiol. 2014; 49:271-77.
9. Mian, O.S. et al. Effect of head pitch and roll orientations on magnetically induced vertigo. The Journal of physiology, 2015; 594(4): 1051-1067.
Figures