4660
Detectability and anatomical location identification of cholesteatoma with thin-slice non-echo planar imaging diffusion-weighted image (nEPID) using fused nEPID and CT(nEPID-CT)1Diagnostic Radiology, Yamagata University Faculty of Medicine, Yamagata, Japan
Synopsis
Non-echo planar imaging diffusion-weighted imaging (nEPID) is a useful tool for diagnosing middle ear cholesteatoma. The cut-off value of nEPID has not yet been determined, however, as fused thin-slice nEPID and computed tomography (nEPID-CT) color imaging cannot correctly distinguish cholesteatoma from other soft tissue. We examined the detectability of cholesteatoma with nEPID using nEPID-CT color images obtained as preoperative studies. The appropriate cut-off value of the signal intensity ratio on nEPID is 0.925 on the receiver operating characteristic (ROC) curve with Youden’s index. Here, we evaluate the efficacy of nEPID-CT color images based on this nEPID cut-off value.
Abstract
Purpose:
Middle-ear cholesteatoma is a common inflammatory disease that requires prompt surgical treatment to prevent local and intracranial complications. High-resolution computed tomography (HRCT) provides information regarding bony changes and intracranial complications, enabling diagnostic imaging of cholesteatoma. HRCT cannot, however, accurately characterize the soft tissue mass in the temporal bone. The efficacy of diffusion-weighted imaging to diagnose cholesteatoma, especially thin-slice non-echo planar imaging diffusion-weighted imaging (nEPID), and fused nEPID and computed tomography (nEPID-CT) color imaging, has been reported 1-2). The cut-off value of nEPID for cholesteatomas has not yet been determined, however, as fusion color imaging cannot distinguish cholesteatoma from other soft tissue. We examine the detectability of cholesteatoma with nEPID using fused thin-slice nEPID and CT (nEPID-CT) color imaging carried out as preoperative studies, and the cut-off value of nEPID.
Methods:
A total of 32 consecutive patients were included in this study. All subjects had undergone surgery in our otorhinolaryngologial department between September 2014 and August 2015. There were 15 males and 17 females, with a mean age of 45.7 years old (range: 2-76 years), and no past otologic surgery on the therapeutic side of the suspected primary cholesteatoma.
Patients underwent preoperative CT imaging with two CT scanners (3D Accuitomo J Cone-beam CT, Morita Mfg. Corp., Japan, and SOMATOM Definition Flash, Siemens) and magnetic resonance (MR) imaging with a 3.0 T unit (Intera Achieva, Philips, The Netherlands). The imaging parameters used for nEPID were as follows: 32 transverse slices, TR 84 ms, TE 2,311 ms, b factor 800 s/mm2, field of view (FOV) 240 mm, slice thickness 1 mm. We measured the nEPID value by fused nEPID-CT color imaging developed by Aquarius NET (TeraRicon, Inc., California, USA). nEPID was adjusted on AquariusNET with CT images in terms of angle and position by MR cisternography. We measured the signal intensity ratio (SIR) of nEPID on nEPID-CT. Using CT images fused with nEPID, we classified four parts of the middle ear: attic (A), tympanic cavity (TC), mastoid antrum (MA), and mastoid cells (MC). We defined the SIR on nEPID, which is the maximum average nEPID value of soft tissue/the maximum average nEPID value of the cerebellar hemisphere. The region of interest (ROI) of the cerebellar hemisphere is the 150 mm2 circle on the affected side at the inner ear canal level in all cases. The ROI of soft tissue is the maximum circle of the smaller size of soft tissues that had fewer than three soft tissue measurement sites per middle-ear part.
We evaluated the location of cholesteatoma using the operative records, and divided the soft tissue of the middle ear into three classifications: cholesteatoma only (Cho only), cholesteatoma and other soft tissue (Cho mix), and soft tissue without cholesteatoma (Cho-). We measured the nEPID value of soft tissues based on nEPID-CT, and evaluated the SIR on nEPID of Cho only and Cho- in the overall middle ear, MA+MC, and TC+A with the Mann-Whitney U test. We determined the appropriate SIR using the ROC curve with Youden’s index by SPSS.
Results:
・The presence of cholesteatoma in the measurement sites of all patients
We measured the nEPID value of 151 soft tissues in the overall middle ear, 68 sites in MA+MC, and 83 sites in A+TC. For the overall middle ear, Cho only: 81, Cho mix: 40, and Cho-: 30 sites. For MA+MC, Cho only: 24, Cho mix: 24, and Cho-: 20 sites. For A+TC, Cho only: 57, Cho mix: 16, and Cho-: 10 sites.
・Evaluation of the SIR on nEPID of Cho only and Cho-
In the overall middle ear, the median SIR on nEPID of Cho only is 1.03 (range 0.13-2.71) and 0.62 for Cho- (range: 0.42-1.40) (p = 0.001). The appropriate SIR is 0.925 on the ROC (sensitivity: 55.6%, specificity: 93.3%, area under the curve [AUC] = 0.700). In MA+MC, the SIR on nEPID of Cho only is 1.37 (range: 0.44-2.71) and that of Cho- is 0.62 (range: 0.42-0.92) (p = 0.000215). The appropriate SIR is 0.925 on the ROC (sensitivity: 66.7%, specificity: 100%, AUC = 0.827). In TC+A, the SIR on nEPID of Cho only is 0.93 (range: 0.13-2.64) and that of Cho- is 0.61 (range: 0.42-1.40) (p = 0.190).
Discussion:
Although a previous report showed that no clear cut-off value could be detected on nEPID using MR images only 3), our results showed a clear cut-off SIR on nEPID using nEPID-CT fusion images, especially MA+MC. In the future, we will evaluate the efficacy of nEPID-CT fusion color imaging based on this nEPID cut-off value.
Acknowledgements
The authors would like to acknowledge Mr. Chris Rowthorn for the English language profreading of this manuscript.References
1. Watanabe T, Ito T, Furukawa T, et al. The efficacy of color-mapped diffusion-weighted images combined with CT in the diagnosis and treatment of cholesteatoma using transcanal endoscopic ear surgery. Otol Neurotol. 2015; 36: 1663-1668.
2. Kanoto M, Sugai Y, Hosoya T, et al. Detectability and anatomical correlation of middle ear cholesteatoma using fused thin slice non-echo planar imaging diffusion-weighted images and magnetic resonance cisternography. Magn Reson Imaging. 2015; 33: 1253-1257.
3. Suzuki H, Sone M, Yoshida T, et al. Numerical assessment of cholesteatoma by signal intensity on non-EP-DWI and ADC maps. Otol Neurotol. 2014; 35: 1007-1010.
Figures
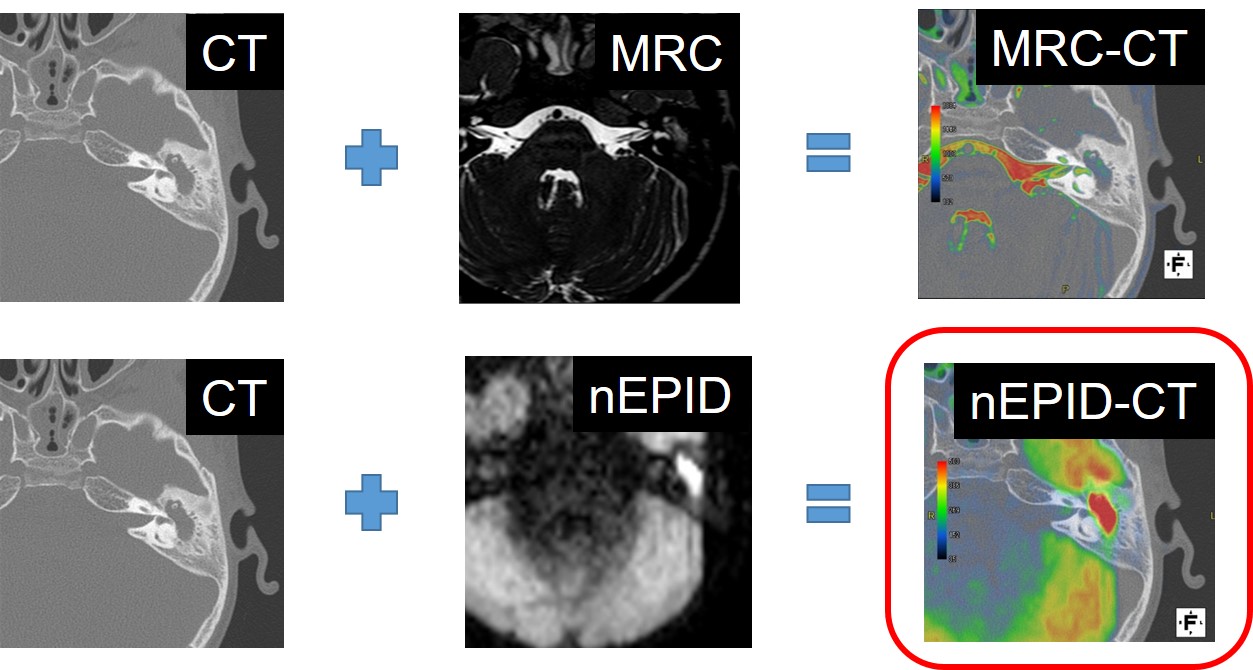
Fig.1 Fusion images of nEPID and CT
Non-echo planar imaging diffusion-weighted image (nEPID) was adjusted in terms of angle and position by magnetic resonance cisternography. Later, nEPID was fused with CT using a three-dimensional workstation, AquariusNET (TeraRecon).
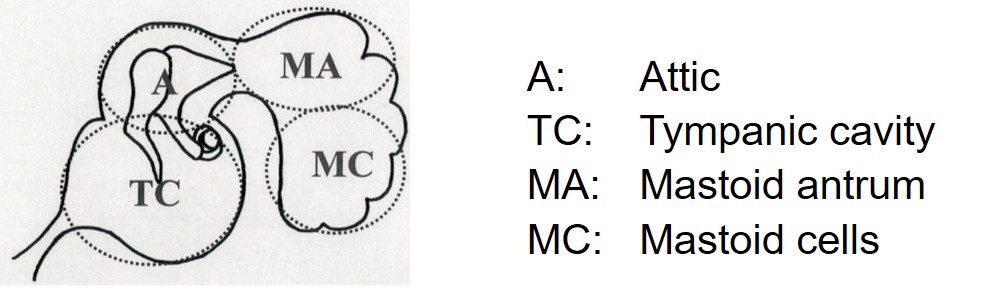
Fig.2 Anatomical classification of the middle ear
The attic (A) portion is above the lateral semicircular canal and ahead of the posterior margin of the lateral semicircular canal. The tympanic cavity (TC) is under the lateral semicircular canal and ahead of the posterior margin of the lateral semicircular canal. The mastoid antrum (MA) is above the lateral semicircular canal and behind the posterior margin of the lateral semicircular canal. The mastoid cells (MCs) are under the lateral semicircular canal and behind the posterior margin of the lateral semicircular canal.
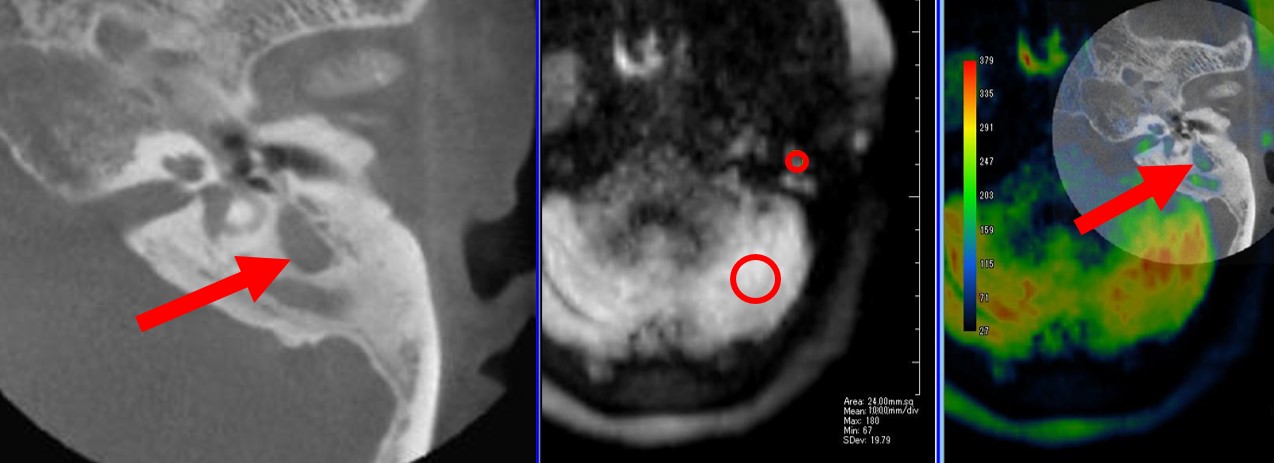
Fig.3 Measurement of the SIR on nEPID
The signal intensity ratio (SIR) on non-echo planar imaging diffusion-weighted imaging (nEPID) was defined as the maximum average nEPID value of soft tissue divided by the maximum average nEPID value of the cerebellar hemisphere (SIR on nEPID = soft tissue/cerebellar hemisphere). The region of interest (ROI) of the cerebellar hemisphere is the 150 mm2 circle on the affected side at the inner ear canal level. The ROI of soft tissue is the maximum circle of smaller size of soft tissues that had fewer than three soft tissue measurement sites per middle ear part.
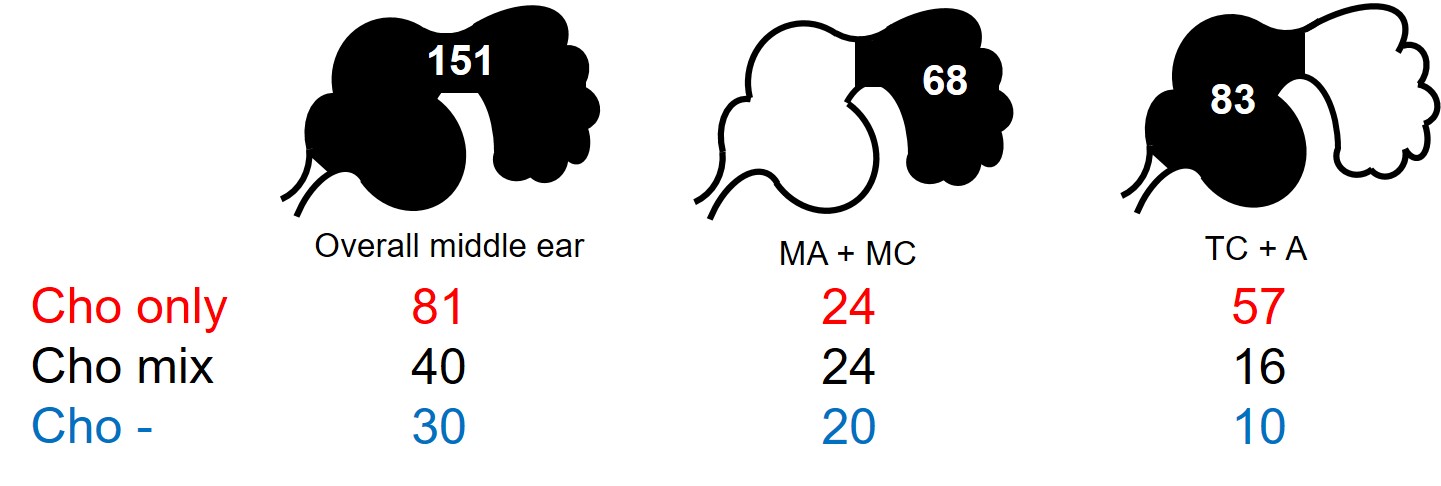
Fig.4 The presence of cholesteatoma in the measurement sites
We evaluated the location of cholesteatoma using the operative records, and divided the soft tissue of the middle ear into three classification: cholesteatoma only (Cho only), cholesteatoma and other soft tissue (Cho mix), and soft tissue without cholesteatoma (Cho-). In the overall middle ear, 151 sites were measured (Cho only: 81, Cho mix: 40, and Cho-: 30 sites). In MA+MC, 68 sites were measured (Cho only: 24, Cho mix: 24, and Cho-: 20 sites). In A+TC, 83 sites were measured (Cho only: 57, Cho mix: 16, Cho-: 10 sites).
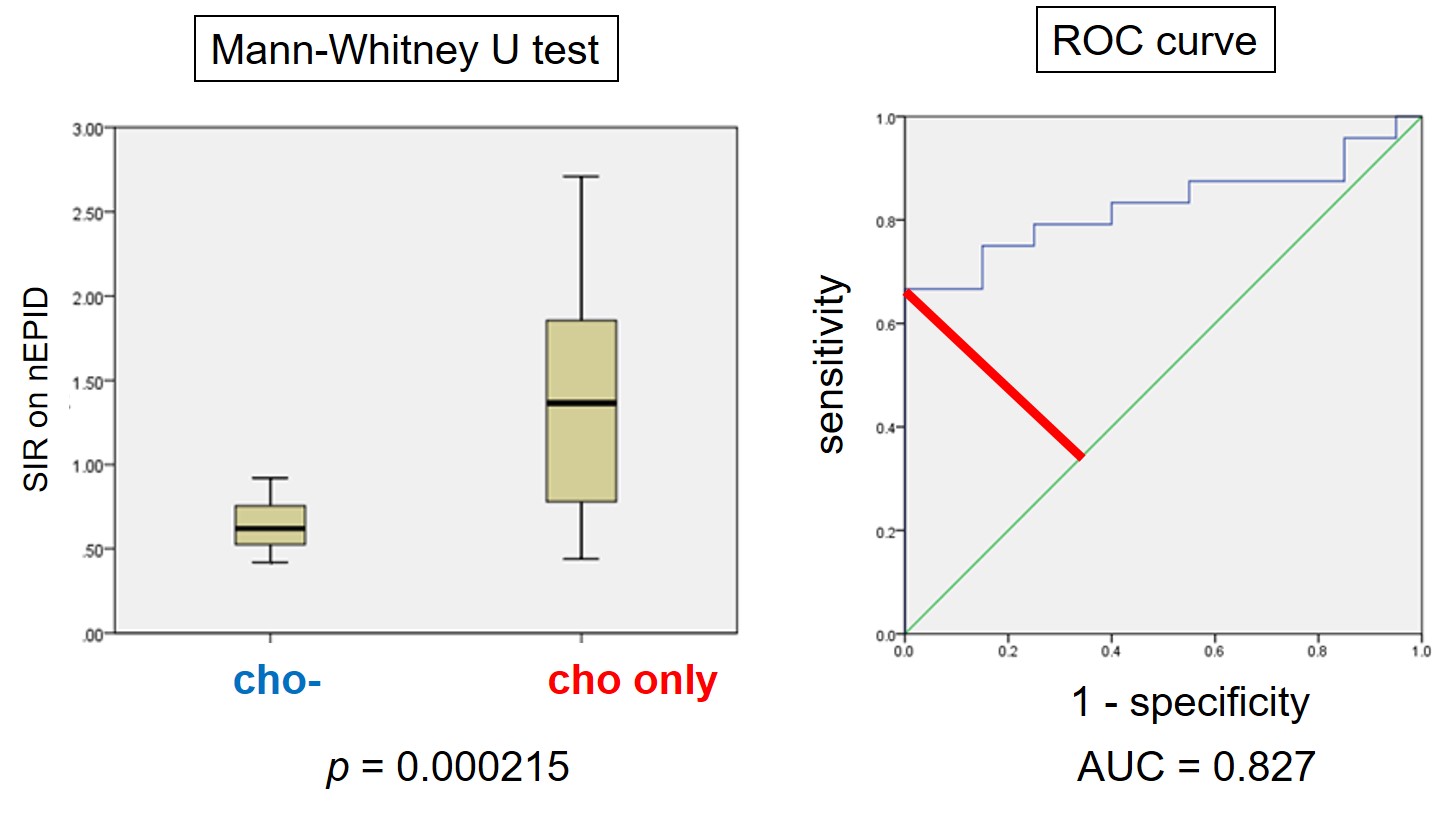
Fig.5 Evaluation of the SIR on nEPID of Cho only and Cho- in MA+MC
We evaluated the signal intensity ratio (SIR) on non-echo planar imaging diffusion-weighted imaging (nEPID) of Cho only and Cho- in the overall middle ear, MA+MC, and TC+A using the Mann-Whitney U test. The appropriate SIR was determined using the ROC curve with Youden’s index by SPSS. In MA+MC, the SIR on nEPID of Cho only was 1.37 (range: 0.44-2.71) and Cho- was 0.62 (range: 0.42-0.92) (p = 0.000215). The, appropriate SIR is 0.925 on the ROC (sensitivity: 66.7%, specificity: 100%, AUC = 0.827).